
 ?Mathematical formulae have been encoded as MathML and are displayed in this HTML version using MathJax in order to improve their display. Uncheck the box to turn MathJax off. This feature requires Javascript. Click on a formula to zoom.
Abstract
Faults significantly affect the stability of surrounding rock and stress distribution, which increases the possibility of water inrush disasters in a coal mine. Also, the precisely advanced prevention and control of floor limestone water become the foundation of ensuring mine safety and efficient production in coal mines. Fault development evaluation is one of the elements that control further transparent and fine studies. In this paper, the fault control index (FCI) is built based on the fractal dimension (Ds) and fault influence factor (E), which is determined according to the measured water inflow of water inrush points. The box meshing level is analyzed to calculate and compare the FCI. The results show that the box-meshing level affects the value of Ds and FCI and a meshing level of 6 seems to be the minimum standard of Ds for high accuracy. To verify the results, a comprehensive risk evaluation model of floor water inrush is established to illustrate the implications of fault complexity degree on safety mining. A stricter meshing grade when using the box-counting method in fault complexity degree is necessary for further studies in the precise prevention and control of mine hazards.
1. Introduction
Water inrush disasters occur in general during geology and civil engineering. The geo-structure especially fault plays an important role in underground engineering projects, such as tunnels and coal mines (Li et al. Citation2021; Xue et al. Citation2019). The fault is a water-conducting channel or a water storage reservoir, which increases the possibility of water inrush during the project. In China, coal will still be the main resource of China’s total energy consumption in the coming decades (He et al. Citation2020; Jia and Lin Citation2021). Therefore, continual research on safety mining is needed and necessary. As the mining depth increases, the floor limestone aquifer that is rich in water becomes a major threat to safety mining (Lan et al. Citation2016). Statistically, more than 200 water inrush accidents occurred due to the Ordovician limestone aquifer and caused more than 1300 deaths over the last 40 years (Cao et al. Citation2022). The current deep mining conditions lead to the influence of fault, especially the hidden fault, on floor water inrush becomes more obvious. The inherent conditions and hydrogeological conditions of faults such as stress field and seepage-stress distribution promote the water inrush hazards under high water pressure. Therefore, paying attention to fault development in underground coal mining projects is important.
But how to describe the spatial distribution of faults and apply it to solve practical engineering issues? Fault has basic elements of strike length, dip angle, and throw, Xu et al. (Citation1991) first proposed a quantitative evaluation method for geological structure in a coal mine. Quantitative evaluation of geological structure is hence widely used, such as water abundance evaluation and risk assessment of mine water inrush (Yin et al. Citation2018; Han et al. Citation2020; Qiu et al. Citation2017; Wang and Sui Citation2022). Fractal theory and fractal dimension provide new ideas and methods for quantitative assessment of faults which is realized according to the fault trace on the strata surface. The fractal dimension is the most popular method to evaluate the complexity of fault structure (Li et al. Citation2011; Li et al. Citation2017; Yang et al. Citation2019). In fractal theory, the mathematical definition of fractal dimension is that the Ds are established when ε→0. Therefore, the calculation results may be different with different grid grades. For decades, research has been done to divide the fault complexity grade using fractal dimension by water inrush rate (Li et al. Citation2011; Liu et al. Citation2015; Li et al. Citation2017; Zhou et al. Citation2017). The fault complexity degree in a coal mine is affected by many factors, such as the number of faults, strike length, dip angle, injections, endpoints, and strata incline (Yang et al. Citation2019; Wang and Sui Citation2022). The fractal dimension is similar to the fault density and without considering other influence factors, which cannot ideally reflect the fault complexity. The fault influence factor was proposed based on the fault intensity index, which takes fault intersections and endpoints into consideration (Guo and Shi Citation2014; Shi et al. Citation2014; Shi et al. Citation2015). However, these studies were conducted according to the relationship between fractal dimension, fault influence factor, and water inrush coefficient (Ts). The Ts is the ratio of water pressure and the aquiclude thickness, which is irrelevant to fault structure. The relationship between fault complexity and the water inflow at the water inrush points seems more reasonable and reliable.
The fault complexity degree controls the rock integrity, stability of surrounding rock, and stress distribution, which also has an important promoter action on water inrush rate. As Wu et al. (Citation2008) presented about 80% of mine water inrush accidents are related to faults. The fault complexity degree, as well as water abundance, mining depth, coal mine thickness, and rock sequence, are factors that affect mine water inrush. Therefore, a comprehensive evaluation model that considers fault was then built to evaluate the aquifer water abundance (Yin et al. Citation2018; Han et al. Citation2020; Qiu et al. Citation2017), as well as the risk assessment of mine water inrush (Li and Sui Citation2021; Li et al. Citation2017; Ruan et al. Citation2019; Sun and Xue Citation2019; Wang et al. Citation2019). In the previous studies, most of them use fractal dimension to evaluate the fault complexity and serve as an indicator in the comprehensive evaluation model, without considering the geometric elements of the fault. In practice, faults with more endpoints and intersections make the rock more cracked. In calculation, the meshing level affects the fractal dimension. However, the fractal dimension only considers the trace on the strata surface, while the Ts only considers the water pressure and thickness of the aquiclude layer. The water flow at roadways is related to the water abundance of the aquifers and is mostly related to faults. The hazard identification and risk assessment of floor water inrush, especially in deep mining, are crucial before mining for safety mining. Therefore, it is important to accurately predict the risk assessment of floor water inrush using the data acquired during geological exploration. Under faults developed geo-conditions, it is more reasonable and practical for water inrush prevention research to explore and determine the relation between fault and flow rate at water inrush points. Therefore, considering the above-mentioned problems, this paper presents a method to evaluate the fault complexity degree using the fault control index and the flow rate at water inrush points in the Taoyuan coal mine.
The main objective of the proposed study is to 1) construct the fault control index of the Taoyuan coal mine by combining fractal dimension and fault influence factor, 2) determine the relationship between fault complexity degree and flow rate at water inrush point, 3) discuss the optimal meshing level in fractal dimension calculation and make practice with a case study. In this study, the main difference in the method used between this research and the previous studies will be described, which will support future studies on fault complexity degree and risk assessment model.
2. Geological backgrounds
The Taoyuan coal mine belongs to the Huaibei coalfield, which is located in Huaibei, Anhui province, China. The coal mine is covered by an ultra-thick loose layer, with a length of 15 km (SN) and a width of 1.5 ∼ 3.5 km (EW). According to the geological drilling data, the strata exposed in the study area from old to new consist of Ordovician (O), Carboniferous (C), Permian (P), Jurassic (J), Neogene (E), and Quaternary (Q). The coal-bearing strata in the Taoyuan coal mine are the Carboniferous and the Permian. The Taiyuan Formation of the Carboniferous contains 6 ∼ 8 layers of coal seams, and 2 ∼ 3 layers of them cannot be mined. The coal-bearing strata in the Permian consist of the Lower Shanxi Formation, Lower Shihezi Formation, and Upper Shihezi Formation, consisting of 11 coal seams (groups) with a total thickness of 21.75 m. as shown in is the simple strata and coal-bearing strata of Huaibei Coalfield. The main minable and stable coal seams are Nos. 32, 82, and 10, of which the coal seam No.10 with a thickness of 0 ∼ 5.52 m is the research object in this paper.
Figure 1. Strata and coal-bearing strata of Huaibei Coalfield.
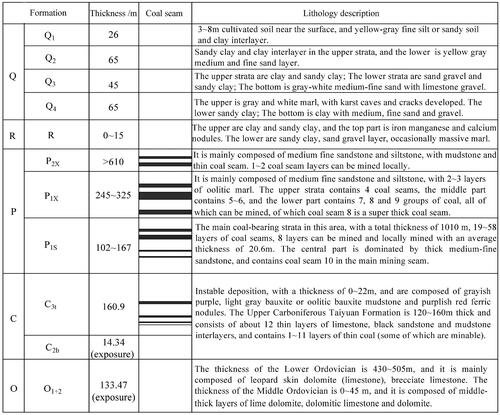
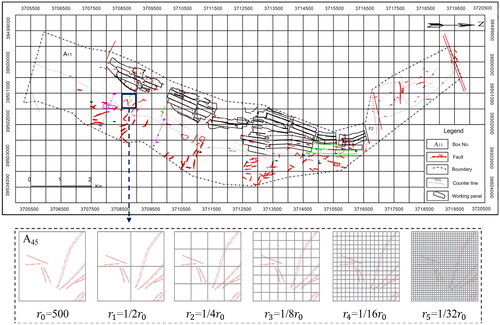
According to the geological survey results, geo-structures including faults and karst collapse columns are developed in the study area. The whole coal mine is cut by fault F2, and the direction of the strata changed on the two sides of fault F2 (). According to mining reveal conditions, there are 2 faults with a drop of >400 m, 2 faults with a drop of 20 ∼ 30 m, 6 faults with a drop of 10 ∼ 20 m, and 10 faults with a drop of >10 m. The small scale faults are well developed with a number of about 266. Besides, karst collapse columns were revealed in the mining process, which is a big threat to safety mining. The geo-structures including faults and collapse columns are the main water-conducting channels in the Taoyuan coal mine. The water filling sources for coal seam No.10 are the limestone water in the Taiyuan Formation and Ordovician limestone aquifers, and fissure water comes from the overburdened sandstone aquifer.
Figure 2. Box meshing with different geometric similarity ratios.
According to the engineering geological data, there are 27 water inrush accidents that occurred with a rate over 10 m3/h, 9 medium-scale water inrush, 1 extremely large water inrush, and the rest are less than 60 m3/h. Of these, there are 18 floor water inrushes, 8 roof water inrushes, and 1 goaf water inrush, and 16 out of 18 were caused because of the excavation of coal seam No.10, and some of them were caused by the water-conducting fault and karst-collapse column. The coal mine water-filling factors mainly include the water-conducting and water storage capacity of the faults or karst collapse column, and the water abundance of the floor limestone. Other factors such as statistical hazards and dynamic hazards also influence the water inrush possibility (Wang et al. Citation2022).
3. Methods
3.1. The fault control index (FCI)
The fault control index (FCI) is built to evaluate the fault complexity degree. The FCI is a combination of fractal dimension Ds and fault influence factor E, which is determined by grey correlation analysis according to the water inflow of water inrush points. MATLAB can be used to calculate the grey correlation with simple code. Then the relationship between the FCI and the water inrush rate is analyzed which is used to explore the implications for risk evaluation of mine water inrush.
The calculation of self-similarity dimension, Ds, is widely used, which can be expressed as EquationEq. (1)(1)
(1) . It refers to the box scale r and the number of boxes with fault trace. presents the box meshing method in the calculation process. For the detailed calculation process, please refer to Wang and Sui (Citation2022).
(1)
(1)
where N(r) is the number of boxes at scale r. The box-counting method was used to calculate the Ds, which is the most commonly used method (Sarkar and Chaudhuri Citation1994; Panigrahy et al. Citation2019).
The calculation of E (EquationEq. (2)(2)
(2) ) including the fault intensity index
(Xu et al. Citation1991) and M. It refers key element of fault including fault length, drop, intersection and endpoint. The box dividing is presented in Figure (2).
(2)
(2)
where S is the box area, l is fault length, h is fault drop, and M is the normalized value of the fault intersections and endpoints.
3.2. The EWM-AHP method
The Entropy Weight Method and Analytic Hierarchy Process (EWM-AHP) method is widely used to weight the evaluation index of mine water inrush. For the detailed theory and explanations, please refer to the work developed by Hu et al. (Citation2019). The major steps of the EWM-AHP are as follows:
Construct the evaluation index system according to the geological background of the study area.
Determine the evaluation matrix
where m is the evaluation object, n is the evaluation index.
Calculate the entropy weight
Calculate the AHP weight
where, is the inconsistency degree index;
is the ratio of random consistency of the paired comparison matrix
is the average random consistency index;
is the largest eigenvalue.
Determine the synthesis weight
where, is coefficient,
The value of α should be determined according to the importance of indicators (Wang Citation1999). If the relative importance of each indicator cannot be determined subjectively, it is considered that they are at the same level, then α = 1. If the indicators are in different importance levels, then α = 0.5; If the indicators are in different importance levels, the weights of the two are different and the importance level is different, then α = 0.
4. Results
In this paper, the Ds is calculated according to EquationEq. (1)(1)
(1) and used to analyze the relationship between the Ds and the flow rate at the water inrush points. Figure S1 is the Ds contour map drawn by ArcGIS. The results show that the Ds ranges from 0 to 1.5 in the whole mining area. The high value Ds in the shallow area are mainly concentrated in the south of the study area, while the high value Ds in the deep area are mainly concentrated in the Middle East. Currently, the coal in the Taoyuan coal mine above −800 m (level I and II) has been almost mined out, while the deep area below −800 m (level III) has not been exploited which has a complex hydrogeological condition in the central area. To realize and ensure safe mining at level III, a hydrogeological supplementary survey at level III has been carried out in the mining area. By projecting the coordinates of fault-induced water inrush points on the Ds contour map as well as the fault traces, it can be found that water inrush accidents mainly occur in the northern part of the coal mine, while there are relatively few in the southern part. The Ds contour map has a good correspondence with the development of fault structures. Besides, the analysis results show that the Ds is positively correlated with the water inrush rate, and the linear fitting coefficient is up to 0.82, showing a good linear correlation.
The E is a comprehensive index of fault intensity index, fault intersection and endpoint density, which is another index that differs from the fractal dimension. Therefore, the relationship between E and water inrush is analyzed, and the water inrush rate and the corresponding value of E are listed in . According to the calculation results, mapping the E contour map is shown in Figure S2. The results show that the value of E is a range of 0 ∼ 0.12, and the calculation process presents that the influence of fault intersections on E value is the largest and then is the faults development scale. In the mining area above −800 m, the high E values are mainly concentrated in the north and south areas of the coal mine, which is slightly different from the Ds distribution. According to the location distribution of the fault-induced water inrush points in the study area, more than 50% of water inrush occurs in the area with a higher E value. The analysis results show that there is an obvious linear relationship between the fault influence factor and water inrush rate, which has a linear fitting coefficient of 0.87 (Figure S3).
Table 1. E And fault-induced water inrush points of the Taoyuan coal mine.
According to the above analysis, Ds and E are positively correlated with the water inrush rate respectively. Therefore, the correlation degree between water inrush rate and Ds and E is calculated according to the grey correlation analysis. Then, the FCI is determined based on the magnitude of the correlation degree, the expression of FCI is expressed by EquationEq. (10)(10)
(10) . In order to eliminate the effects of dimensions between the Ds and E, the maps were normalized and created the FCI contour map, as shown in . The FCI contour map shows the difference between the Ds and E distribution and the FCI contour map is much more matched to the fault development. That is to say, Ds cannot totally reflect the fault development characteristics, especially in the vertical direction including the drop and the depth of the fault. Take in the reference Wang and Sui (Citation2022) for example, the large-scale fault developed may cut through several strata and link to the Ordovician limestone aquifer while most of the faults are small-scale developed. Up to now, a large number of faults are concealed and determined in the mining process and it is hard to detect the whole fault completely. However, the FCI is more reasonable than Ds which takes fault elements into consideration.
Figure 3. The FCI contour map.
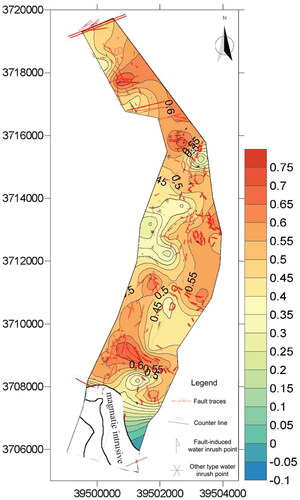
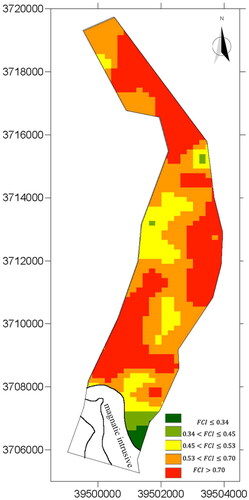
In this paper, the degree of fault complexity is divided into five grades: relatively simple, simple, relatively complex, complex, and ultra-complex. The fault complexity degrees correspond to FCI ranges of
The distribution map of the fault complexity degree is constructed using the natural breaks method (Jenks Citation1963) based on ArcGIS ().
(10)
(10)
Figure 4. Zonation of the fault complexity degree.
5. Discussions
5.1. Controlling effects of box scale
The box scale r or the box meshing level influences the value and the distribution of the Ds, according to the calculation process. However, there is no standard box scale for fractal dimension calculation, which influences the research results. The abovementioned analysis results show that the Ds, as well as E, are linear dependent on the water inrush rate, separately. As listed in are the water inrush rate and the Ds values, there are different box scales and box meshing levels (Li et al. Citation2017; Shi et al. Citation2015; Li et al. Citation2011; Zhou et al. Citation2017). The statistical Ds in the references shows that the Ds is just positively related to the water inrush rate, the scatter diagram is present in Figure S4. According to the case studies of the aforementioned references, most of the results indicate that the Ds and water inrush rate are linearly dependent. But the statistical result shows that there is no linear or exponential correlation between the Ds and water inrush rate, which is different from the conclusion of this paper and the referred literature.
Table 2. Statistic of fault-induced water inrush points and Ds values.
Considering that the difference between the statistical results is the box scale r and the box meshing level, then, whether the box scale r or the box meshing level controls the Ds values even the fault complexity degree needs to be verified.
To explore the influence of the box scale or the box meshing level on Ds values, take one of the boxes for example to analyze the changes in Ds. Let’s still take box A45 for example meshing and calculating the Ds (). The Ds listed in are the values corresponding to the meshing level. The result shows that the Ds values decrease continually and remain stable finally. Therefore, it is not reasonable enough to divide the fault complexity according to the Ds calculated with a low meshing level. The results show that a meshing level of 6 seems to be the minimum standard in Ds calculation with high accuracy. And it is the same for the E calculation.
Table 3. Relationship between the meshing level and Ds.
According to the statistical results, the range of Ds for each case study is different, and there are various classification standards for fault complexity degree. This is another factor that influences the final result of the distribution of fault complexity degree. For example, the Ds in Liuqiao No.2 mine range from 0.602 to 1.672 which divided the degree of fault complexity into five: simple, relatively simple, common, relatively complex, and complex (Li et al. Citation2017). The Ds in Zhaojiazhai coal mine divided the degree of fault complexity into four: simple, common, complex, and ultra-complex (Zhou et al. Citation2017). Even some studies divided the degree of fault complexity into three: simple, common, and complex. The classification standard of fault complexity is not unified, which limits the study of fault complexity degree by using fractal theory. If the standard is unified, a transverse comparison can be done to find out the internal relationship between fractal dimension and fault complexity degree. Therefore, it is necessary to unify the classification standard of fault complexity degree. Currently, the 5 degree classification method is the most widely used which is also appropriate for the assessment of water abundance and water inrush risk.
Fault complexity degree is one of the factors controlling the occurrence of mine water inrush which is also determined especially by water abundance and aquiclude conditions on the base of fault complexity degree. The faults or fissures especially the ones that link to the aquifer promote the water abundance and the possibility of mine water inrush accidents. Therefore, the fault development characteristics can serve as an element to conduct a comprehensive assessment of water abundance and mine water inrush, of which the comprehensive assessment of mine water inrush is crucial for safety mining. However, Ds is commonly used in risk assessment models without considering the geometrical elements of fault (Li and Sui Citation2021; Li et al. Citation2017), and some studies built the risk assessment model without considering the influence of faults (Ruan et al. Citation2019; Sun and Xue Citation2019; Wang et al. Citation2019). The method that evaluates the fault complexity by using the relationship between the FCI and water inrush rate proposed in this paper verified it’s reasonable. Therefore, a risk assessment model for floor water inrush was conducted based on the study mentioned above.
5.2. Risk assessment of floor water inrush in the Taoyuan coal mine
Risk assessment is a crucial step in mine water inrush hazard prevention and control, and the indicators building the evaluation model are various but the several elements are usually the same (Wu et al. Citation2009). Based on the current research, some static hazard sources can be expressed by a certain geological index, such as the development of fracture structure can be expressed by the FCI, and the influence of structural development on the possibility of water inrush can be judged according to the water inflow at the water inrush point in the mining area. Also, lithology, thickness and combination of water-containing layers are the main controlling factors of water-rich rock formation. Based on these indicators and the results of the pumping test, regional water abundance can be evaluated. The higher the water abundance, the greater the possibility of water inrush under triggered conditions. Therefore, the static hazard sources of floor water inrush are evaluated from the aspects of the initial structure of the mine and water richness from the aspects of the influence degree and the possible consequences of floor water inrush. Although the coal seam thickness and other hazards have a certain control effect on the possibility of water inrush from the floor, they cannot be used for qualitative or quantitative hazard assessment, so they are taken as one of the elements in the risk assessment model of floor water inrush with other hazard assessment indicators (Wang et al. Citation2022). Assessment indicators are related to geological conditions in the study area.
According to the geological conditions of the study area, the model selects 7 evaluation indexes, including the FCI, water abundance, mining depth, water pressure, coal seam thickness, aquiclude thickness and sandstone coefficient. The comprehensive evaluation index system for the risk of floor water inrush is established. First, the synthesis weight of the 7 evaluation indexes was calculated based on the AHP-EWM method using MATLAB. The thematic maps of the risk evaluation index are presented in Figure S5, which was obtained by using existing measured data with the Spatial Analyst Tool in ArcGIS.
What should be noticed is that all indicators need to be normalized before the comprehensive evaluation to eliminate the influence of the different dimensions. EquationEq. (11)(11)
(11) and EquationEq. (12)
(12)
(12) are applied to the positive and negative indicators separately. The thematic maps for the normalized evaluation index were formed in ArcGIS according to the normalized data, as shown in Figure S6. Then, the risk zonation of floor water inrush is obtained according to the spatial superposition analysis function of ArcGIS, as shown in .
(11)
(11)
(12)
(12)
Figure 5. In Taoyuan coal mine.
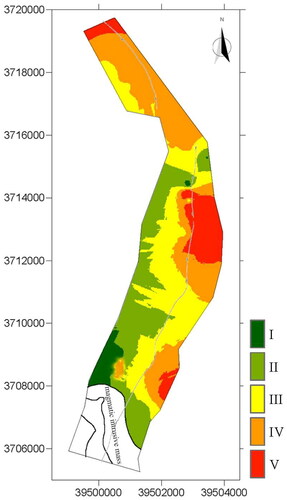
Currently, there is no regulation or qualitative classification scheme for the risk zonation of floor water inrush. The natural breaks method in ArcGIS is based on clustering theory which can realize the most appropriate grouping of similar values and maximize the difference between the classes. The risk of floor water inrush in the Taoyuan coal mine is then divided into five: safe zone (I), relatively safe zone (II), relatively dangerous zone (III), dangerous zone (IV), and high-risk zone (V), as shown in . It can be seen from the figure that the high-risk area of floor water inrush in the whole study area is mainly concentrated in the deep structural complex area, mainly due to its high water abundance and the development of the geo-structures including large-scale faults and collapse columns, which match to the measured data of the Taoyuan coal mine. According to the statistical data, there are 5 times floor water inrush accidents had occurred due to the Taiyuan Formation limestone and the Ordovician limestone aquifer. To verify the validity of the comprehensive evaluation model, projecting the water inrush points on . The results show that almost all the water inrush point is located in the dangerous zone (IV) or high-risk zone (V), which has a good congruent relationship with the measured data. Therefore, The AHP-EWM-based comprehensive evaluation model is used to partition the risk of floor water inrush, which has an important reference value for safety mining. As a consequence, for the high-risk evaluation and prediction areas, the corresponding supplementary exploration as well as prevention and control measures should be conducted to reduce the risk of water inrush.
Grouting is commonly used in coal seam floors to prevent water inrush that may result from the high water because it can increase the effective water-resisting thickness, reinforce overlying rock, and block fault fractured zones to prevent water flow. According to the geology and hydrogeology conditions, to solve the water disasters in the mining area below the −800 m level, the ‘advanced treatment technology scheme of ground strata pore area’ is put forward, aiming at grouting and strengthening karst fissures and caves, structural water-rich abnormal area, water-conducting structural fractures. Geophysical exploration and borehole verification are used to detect the abnormal areas, and the results show that the water abundance in the aquifers is at a safe level and the single-hole water discharge meets the requirements.
6. Conclusions
This paper presents a method to evaluate the fault complexity degree in the Taoyuan coal mine on the basis of the fault control index by using the relationship between the fault development characteristics and the water inrush rate. Then, the influence factors on the fractal dimension and the implications of the fault control index on safety mining were discussed. The main conclusions are drawn as follows:
The FCI proposed in this paper which is determined by the relationship among the E, Ds, and the water inrush rate is more reasonable than the single fractal dimension. The degree of fault complexity is divided into five grades: relatively simple, simple, relatively complex, complex, and ultra-complex.
In the analysis of fault complexity degree, the box scale r or the box meshing level influences the value of Ds, and a meshing level of 6 seems to be the minimum standard in Ds calculation with high accuracy. It is better to develop a standard in fault analysis with such a method.
The implications of FCI for risk evaluation of floor water inrush were discussed. A comprehensive evaluation model for the risk of floor water inrush based on the EWM-AHP method is established, which includes 7 indicators: FCI, water abundance, mining depth, water pressure, coal seam thickness, aquiclude thickness, and sandstone coefficient. The risk of floor water inrush in the Taoyuan coal mine is divided into five: safe zone (I), relatively safe zone (II), relatively dangerous zone (III), dangerous zone (IV), and high risk zone (V). The congruent relationship between the water inrush point and the risk zonation verified the reasonable of the model, which can then be used in the prevention and control of water inrush hazards.
Authors’ contributions
Dandan Wang: Conceptualization, Methodology, Formal analysis, Literature search, Data curation, Investigation, Resources, Visualization, Writing - original draft, Writing - review & editing. Wanghua Sui: Project administration, Funding acquisition, Supervision. Zhiqiang Ji: Supervision.
Supplemental Material
Download MS Word (16.5 MB)Acknowledgments
The authors thank the National Natural Science Foundation of China (Grant No. 42130706) and the Natural Science Foundation of Shandong Province (ZR2023QD083) for the financial support. Thanks were given to the anonymous reviewers for the detailed comments and suggestions for improving the quality of this paper.
Disclosure statement
The authors declare that they have no known competing financial interests or personal relationships that could have appeared to influence the work reported in this paper.
Data availability statement
Partial of the data related to the paper are confidential.
References
- Cao Z, Gu Q, Huang Z, Fu J. 2022. Risk assessment of fault water inrush during deep mining. Int J Min Sci Technol. 32(2):423–434. doi: 10.1016/j.ijmst.2022.01.005.
- Guo X, Shi L. 2014. Research on quantitative analysis of water inrush through risk based on fault impact factor and fault fractal dimension characteristics. J Shand Univ (Eng Sci). 44(5):58–64.
- Han C, Wei J, Xie D, et al. 2020. Water-richness evaluation of sandstone aquifer based on set pair analysis-variable fuzzy set coupling method: a case from Jurassic Zhiluo formation of Jinjiaqu coal mine in Ningdong mining area. J China Coal Soc. 45(7):2432–2443.
- He Z, Zhou Y, Liu Y. 2020. System dynamics simulation on China’s energy consumption in 2050: based on the policy scenarios of key industries. J Nat Resour. 35(11):2696–2707. doi: 10.31497/zrzyxb.20201111.
- Ho W. 2008. Integrated analytic hierarchy process and its applications–A literature review. Eur J Oper Res. 186(1):211–228. doi: 10.1016/j.ejor.2007.01.004.
- Hu Y, Li W, Wang Q, Liu S, Wang Z.,. 2019. Evaluation of water inrush risk from coal seam floors with an AHP–EWM algorithm and GIS. Environ Earth Sci. 78(10):1–15. doi: 10.1007/s12665-019-8301-5.
- Jenks GF. 1963. Generalization in statistical mapping. Ann Associat Am Geograp. 53(1):15–26. doi: 10.1111/j.1467-8306.1963.tb00429.x.
- Jia Z, Lin B. 2021. How to achieve the first step of the carbon-neutrality 2060 target in China: the coal substitution perspective. Energy. 233:121179. doi: 10.1016/j.energy.2021.121179.
- Lan H, Chen D, Mao D. 2016. Current status of deep mining and disaster prevention in China. Coal Sci Technol. 44(1):39–46.
- Li J, Zhang H, Feng Y, et al. 2011. Nonlinear analysis of complexity of faults structures in coal mines. Chin J Geol Hazard Control. 22(04):69–73.
- Li Q, Sui W. 2021. Risk evaluation of mine-water inrush based on principal component logistic regression analysis and an improved analytic hierarchy process. Hydrogeol J. 29(3):1299–1311. doi: 10.1007/s10040-021-02305-3.
- Li R, Wang Q, Wang X, Liu X, Li J, Zhang Y. 2017. Relationship analysis of the degree of fault complexity and the water irruption rate, based on fractal theory. Mine Water Environ. 36(1):18–23. doi: 10.1007/s10230-015-0348-2.
- Li S, Liu C, Zhou Z, Li L, Shi S, Yuan Y.,. 2021. Multi-sources information fusion analysis of water inrush disaster in tunnels based on improved theory of evidence. Tunnel Underg Space Technol. 113:103948. doi: 10.1016/j.tust.2021.103948.
- Liu R, Jiang Y, Li B, Wang X. 2015. A fractal model for characterizing fluid flow in fractured rock masses based on randomly distributed rock fracture networks. Comput Geotech. 65:45–55. doi: 10.1016/j.compgeo.2014.11.004.
- Panigrahy C, Seal A, Mahato NK, Bhattacharjee D. 2019. Differential box counting methods for estimating fractal dimension of gray-scale images: a survey. Chaos Solit Fract. 126:178–202. doi: 10.1016/j.chaos.2019.06.007.
- Qiu M, Shi L, Teng C, Zhou Y. 2017. Assessment of water inrush risk using the fuzzy delphi analytic hierarchy process and grey relational analysis in the Liangzhuang coal mine, China. Mine Water Environ. 36(1):39–50. doi: 10.1007/s10230-016-0391-7.
- Ruan Z, Li C, Wu A, Wang Y. 2019. A new risk assessment model for underground mine water inrush based on AHP and D–S evidence theory. Mine Water Environ. 38(3):488–496. doi: 10.1007/s10230-018-00575-0.
- Saaty TL. 1980. The analytic hierarchy process. New York: McGraw-Hill.
- Sarkar N, Chaudhuri BB. 1994. An efficient differential box-counting approach to compute fractal dimension of image. IEEE Trans Syst Man Cybern. 24(1):115–120. doi: 10.1109/21.259692.
- Shi L, Liu L, Zhou J, et al. 2014. Fault fractal information dimension and its application in floor water burst. Coal Min Technol. 19(1):12–16.
- Shi L, Teng C, Li C, Wang D. 2015. Influence of fault quantitative on water inrush at floor limestone in Huaheng coal mine. Safety Coal Mines. 46(9):23–26.
- Sun W, Xue Y. 2019. An improved fuzzy comprehensive evaluation system and application for risk assessment of floor water inrush in deep mining. Geotech Geol Eng. 37(3):1135–1145. doi: 10.1007/s10706-018-0673-x.
- Wang D, Sui W, Ranville JF. 2022. Hazard identification and risk assessment of groundwater inrush from a coal mine: a review. Bull Eng Geol Environ. 81(10):1–17. doi: 10.1007/s10064-022-02925-3.
- Wang D, Sui W. 2022. Hydrogeological effects of fault geometry for analysing groundwater inflow in a coal mine. Mine Water Environ. 41(1):93–102. doi: 10.1007/s10230-021-00795-x.
- Wang M. 1999. A comprehensive analysis method on determining the coefficient in multi-index evaluation. System Eng. (02):56–61.
- Wang X, Li S, Xu Z, Hu J, Pan D, Xue Y.,. 2019. Risk assessment of water inrush in karst tunnels excavation based on normal cloud model. Bull Eng Geol Environ. 78(5):3783–3798. doi: 10.1007/s10064-018-1294-6.
- Wu Q, Zhou W, Wang J, Xie S. 2009. Prediction of groundwater inrush into coal mines from aquifers underlying the coal seams in China: application of vulnerability index method to Zhangcun Coal Mine, China. Environ Geol. 57(5):1187–1195. doi: 10.1007/s00254-008-1415-9.
- Wu Q, Zhu B, Li J, et al. 2008. Numerical simulation of lagging water-inrush mechanism of rock roadways near fault zone. J China Univ Min Technol. 37(6):780–785.
- Xia W, Wu Z. 2007. Suppliers selection with multiple criteria in volume discount environments. Omega. 35(5):494–504. doi: 10.1016/j.omega.2005.09.002.
- Xu F, Long R, Xia Y, Xie S. 1991. Quantitive assessment and prediction of geological structure in coal mine. J China Coal Soc. 16(4):93–102.
- Xue Y, Li Z, Li S, Qiu D, Su M, Xu Z, Zhou B, Tao Y.,. 2019. Water inrush risk assessment for an undersea tunnel crossing a fault: an analytical model. Mar Georesourc Geotechnol. 37(7):816–827. doi: 10.1080/1064119X.2018.1494230.
- Yang B, Yuan J, Duan L, Liu Q. 2019. Using GIS and fractal theory to evaluate degree of fault complexity and water yield. Mine Water Environ. 38(2):261–267. doi: 10.1007/s10230-018-0563-8.
- Yin H, Shi Y, Niu H, Xie D, Wei J, Lefticariu L, Xu S.,. 2018. A GIS-based model of potential groundwater yield zonation for a sandstone aquifer in the Juye Coalfield, Shangdong, China. J Hydrol. 557:434–447. doi: 10.1016/j.jhydrol.2017.12.043.
- Zhou Y, Chen J, Xiao X, Xiong F. 2017. Fractal analysis of fault structures and its application in the assessment of water burst. Chin J Geol Hazard Control. 28(1):115–127.