
Abstract
In recent years, urban flooding disasters have occurred frequently. Conducting research on flood susceptibility assessment is critical for urban flood prevention and urban renewal planning. However, determining how to effectively improve the accuracy of flood susceptibility assessment remains a challenging topic. Combining machine learning algorithms and SHapely Additive exPlanations (SHAP) method, this study proposes an effective technical framework for urban flood susceptibility assessment. Firstly, in terms of data selection, three types of data sources were considered comprehensively. Then, based on the above data sources, five different experimental scenarios were constructed and feature preferences were performed using SHAP. Finally, the performance differences of five commonly used advanced machine learning algorithms are compared. The results show that it is feasible to use the feature importance information provided by SHAP for feature optimization. Compared with the experimental scenario without feature optimization, feature optimization greatly improves the performance of the model. XGboost works best when paired with the optimal feature combination, and its AUC value reaches the maximum. The results indicate that in urban flood susceptibility assessment studies, the selection of the optimal machine learning algorithm and the best combination of features are important to improve the accuracy and reliability of the assessment.
1. Introduction
In the context of global climate change and the rapid development of urbanization in China, the frequency and intensity of urban flood disasters, as well as the damage they inflict, are increasing (Liang et al. Citation2017; Luo and Zhang Citation2022). Currently, after urban concerns such as population congestion, traffic congestion, and environmental pollution, urban flood has now emerged as a major ‘urban disease’ (Tang et al. Citation2018; Wang et al. Citation2015). This is a huge obstacle to the healthy and sustainable development of the economy and society, and it is a key issue for China in its urbanization process (Du et al. Citation2015; Wu and Zhang Citation2017). Therefore, carrying out urban flood susceptibility assessment research is of great practical significance. The mapping of urban flood susceptibility is helpful to identify urban flood-prone areas, which can provide theoretical and practical references for urban flood prevention and control, land use planning, and sustainable urban development.
Scholars have conducted extensive research on urban flood susceptibility assessment, and the findings are very rich. Currently, commonly used methods can be categorized as follows: (1) Susceptibility assessment methods based on historical disaster conditions or indicator systems. Benito et al. proposed a susceptibility assessment method based on historical disaster data by combining multiple sources of historical data and applied it to European countries (Benito et al. Citation2004). In addition, the Analytic Hierarchy Process (AHP) based on an indicator system (Yang et al. Citation2013), Fuzzy Comprehensive Evaluation (FCE) (Jiang et al. Citation2009), and other methods have become prevalent for urban flood susceptibility assessment. The method based on historical disaster data is simple to calculate, but it is mainly for susceptibility assessment in a larger area with lower spatial accuracy (Su et al. Citation2015). The calculation of AHP is simple and easy, but it relies more on expert knowledge and judgment, which is influenced by subjectivity and the results are difficult to be accepted by all decision-makers (Wang et al. Citation2015). FCE has the characteristics of clear and systematic results, but the calculation is more complicated and the determination of indicator weights is more subjective (Zou et al. Citation2013). (2) Hydrological and hydrodynamic models. With the development of GIS, hydrological models and hydrodynamic models are widely used in this field, such as SWMM, Mike, Info Works ICM, etc. (Cheng et al. Citation2017;Bisht et al. Citation2016; Hénonin et al. Citation2015). Hydrological models divide the study area into a large number of sub-catchments, and then calculate surface runoff based on empirical estimates or soil retention curves, and simulate urban inundation areas based on pipe network data (Smith Citation1993). However, any hydrological model is developed under specific sub-surface conditions and has obvious individuality, so it is difficult to have universal applicability (Rui et al. Citation2015). The water movement process is more complex, especially in regions with high spatial heterogeneity, which limits the applicability of hydrological models to certain extent (Zhang et al. Citation2020). To overcome this deficiency, the 2D hydrodynamic model can better simulate the water flow process under different topographic conditions and is more suitable for urban areas with complex sub-surfaces (Felder et al. Citation2017). However, while two-dimensional hydraulic models can accurately simulate the physical processes of surface runoff, for large-scale areas, these physics-based models still face challenges such as insufficient timeliness and higher modeling data costs in rapid urban flood simulations. (Felder et al. Citation2017; Tan et al. Citation2024; Ye et al. Citation2023). Therefore, conducting urban flooding susceptibility assessment studies remains a challenging task.
With the advancement of artificial intelligence technology, there has been a trend in recent years to apply machine learning algorithms to evaluation of urban flood susceptibility. Machine learning algorithms can handle complex nonlinear problems, avoid subjective determination of weights, and are not limited by the size of the study area, providing a new way for urban flooding susceptibility assessment research. At present, several common machine learning algorithms have been applied to urban flooding susceptibility assessment, such as decision trees (Tingsanchali and Karim Citation2010), artificial neural network (ANN)(Li et al. Citation2013), support vector machine (SVM) (Tang et al. Citation2019), weakly labeled SVM (Zhao et al. Citation2019), Bayesian classifier (Tang et al. Citation2018), and random forest (RF) (Woznicki et al. Citation2019), etc. Among them, the RF algorithm has many advantages such as fast training speed and not easy to overfit, and has been successfully applied in different countries and regions (Wang et al. Citation2015; Woznicki et al. Citation2019). However, another new machine learning algorithm based on the Boosting framework, extreme gradient boosting (XGBoost) (Chen et al. Citation2016), is popular in major data competitions for its powerful performance and is seen in various top solutions (Lu Citation2022). Compared with other machine learning algorithms, XGBoost improves the accuracy of the model by expanding the loss function to second-order derivatives, increases the runtime speed by using weighted quantile and sparse-aware algorithms, and improves the robustness of the model by introducing regularization terms, scaling rates, and column sampling (Budholiya et al. Citation2022). Currently, XGBoost has been used in species classification (Xu et al. Citation2021), atmospheric environment (Li et al. Citation2020), and mountain torrent vulnerability assessment (Ma et al. Citation2021). Therefore, a comprehensive evaluation and comparison of five commonly used advanced machine learning algorithms are needed to explore the best machine learning algorithm for urban flood susceptibility assessment.
In addition, in previous studies, most of the models were constructed mainly considering topographic and land use information, while the research on the urban flood susceptibility assessment that comprehensively integrates terrain topography, land use and landscape pattern is not deep enough (Tang et al. Citation2018; Tang et al. Citation2019). Although studies have shown that landscape pattern has an important influence on urban flood, these studies are mainly based on traditional regression analysis methods. For example, Zhang et al. (Zhang et al. Citation2020), and Wu et al. (Wu and Zhang Citation2017) used Pearson correlation analysis and multiple linear regression analysis to explore the relationship between landscape pattern and urban flood. However, traditional regression analysis methods are inadequate in dealing with complex, high-dimensional nonlinearities, so these methods are often difficult to apply to urban flood susceptibility prediction and assessment. On the other hand, due to the high dimensionality of the data, noise or redundant features within the data may interfere with the model’s performance. Therefore, this study introduces a new SHAP-based method for feature selection. Feature selection helps reduce data dimensionality, thereby enhancing model efficiency and generalization performance.
This research proposes an effective technical framework for urban flood susceptibility assessment from three perspectives of data selection, feature selection and method selection based on machine learning algorithms, to improve the accuracy of urban flood susceptibility prediction in a case study of Shenzhen, China, and then provide technical support for urban renewal planning oriented to urban flood prevention and control. The primary contributions of this study are as following: 1) comparing the performance differences of five advanced machine learning algorithms in urban flood susceptibility assessment; 2) improving the accuracy of urban flooding susceptibility prediction by proposing the optimal feature combination considering three types of features: terrain topography, land use and landscape pattern.
2. Data and methods
2.1. Overview of the study area
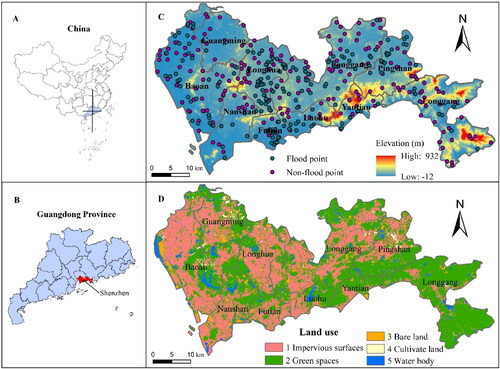
Shenzhen is located in the south of Guangdong Province and is one of the four central cities in the Guangdong-Hong Kong-Macao Greater Bay Area. The land area is located between 22°27′-22°52′N & 113°46′-114°37′E, with a total area of about 2020 km2. As of 2021, Shenzhen has nine municipal districts, Luohu District, Futian District, Nanshan District, Baoan District, Longgang District, Yantian District, Longhua District, Pingshan District and Guangming District (Qian et al. Citation2021). The topography of Shenzhen is high in the southeast and low in the northwest, with a coastal plain in the west (). Since the establishment of the Shenzhen Special Economic Zone in 1980, and in the context of rapid urbanization, the land use of Shenzhen has undergone significant changes, including an increase in the area of impervious surface from 18.64 km2 in 1979 to 892.76 km2 in 2015 (Yang and Chen Citation2021). The spatial distribution of impervious surface in Shenzhen in 2015 is shown in . In recent years, under the combined effects of rapid expansion of impervious surface, urban ‘rain island effect’ and typhoons, urban flood have occurred frequently in Shenzhen.
Figure 1. Geographical location of Shenzhen city.
2.2. Data collection and pre-processing
Digital elevation model (DEM) data derived from the global FABDEM (Forest and Buildings removed Copernicus DEM) dataset with a spatial resolution of 30 m × 30m. Compared to the existing DEM, this dataset removes the bias caused by trees and buildings from COPDEM30 (Copernicus GLO-30) (Hawker et al. Citation2022). The elevation data of Shenzhen is shown in .
Land use data of Shenzhen City from the Institute of Space and Sky Information Innovation, Chinese Academy of Sciences, dated 2015, with a spatial resolution of 2 m × 2m (https://data.casearth.cn/). To further validate the accuracy and reliability of this dataset, we conducted a comparison with high-resolution images from Google Earth using visual interpretation. The results indicated a high classification accuracy of the dataset, which is in close agreement with the actual features. This level of accuracy fulfills the requirements of our study. The land use data for Shenzhen is presented in . The land use data of Shenzhen is shown in .
The flood locations (points) are obtained from Water Authority from 2015 to 2016, and the number of flooded points are 197. To ensure the scientific rationality of the sample data, it is recommended that the number of flooded points be equal to the number of non-flooded points (Chen et al. Citation2019). The imbalance between flooded and non- flooded samples may lead to the model becoming overly sensitive to specific features during training, resulting in model instability. Therefore, an equal number of non-flooded points were randomly created in the study area using ArcGIS, and a total of 394 sample point data were obtained (), and values of 1 and 0 were used to represent the flooded and non- flooded points, respectively. Finally, the sample data were randomly divided into two groups, and 75% of the data were used for model training and 25% of the data were used for the accuracy evaluation of the model.
2.3. Research methodology
2.3.1. Feature selection
In this study, terrain topography, land use and landscape pattern were selected as the feature sets affecting urban storm flood. To unify the spatial resolution of different data, all data were converted into a 100 m × 100m grid. If the grid is too large, the spatial resolution will be low; if the grid is too small, the data volume will increase exponentially and it will be difficult to reflect the landscape pattern information of the waterlogged area. 100 m is a medium resolution accuracy, which can meet the accuracy needs of this study. Therefore, before acquiring the feature data, we used ArcGIS 10.8 to create a 100 m × 100m grid with unique value fields, each grid representing a spatial cell object, and then extracted the feature information corresponding to each spatial cell. The WGS_1984_UTM_Zone_50N coordinate system is used for all features. The process of acquiring features for each category is as follows.
Terrain and topography features. Using ArcGIS 10.8 software, this study obtained the elevation, slope, topographic fluctuation, surface roughness, and flow accumulation based on the original DEM data. Subsequently, using the “zonal statistics function”, the corresponding feature mean value of each spatial unit was extracted as the feature variable. Among them, the flow accumulation is calculated according to the natural law of water flowing from higher to lower areas, and then the value of water flowing through each spatial unit is calculated according to the numerical matrix of water flow direction in the study area (Jenson and Domingue Citation1988).
Land use features. Based on the land use data (), the proportion of the area of different land use types in the study area to the area of the spatial unit in which they are located is obtained as a feature variable by using the ‘Tabulate Area’ tool of ArcGIS 10.8.
Landscape pattern features. The landscape pattern features at two levels: category level and landscape level. Category level is used to calculate the landscape indices of different land use types, while landscape level is used to calculate the landscape indices of overall land use types. According to the connotation of each landscape pattern indices, seven common landscape pattern indices were selected in this study (). Then, based on the five land use types and the seven landscape pattern indices, 27 landscape pattern characteristics corresponding to each spatial unit were calculated using Fragstats 4.2.1 software ().
Table 1. Landscape pattern index.
Table 2. Feature variables (the serial number in the names of landscape pattern features correspond to the serial number of land use type in Figure 1D).
Finally, to eliminate the impact of inconsistent dimensions on the analysis and expedite the convergence speed of the model, Max-min normalization is employed in this study to standardize all 37 feature variables in to a range between 0 and 1.
2.3.2. Experimental protocol
Five different experimental protocols were designed for this study (). There are two purposes of setting different scenarios: firstly, to study the influence of different scenarios on urban flood susceptibility assessment. Secondly, to explore the best solution to improve the accuracy of urban flood susceptibility assessment through the comparison of different scenarios. Among them, scenario 1 mainly considers terrain topography features. Based on scenario 1, scenario 2 and 3 consider land use and landscape pattern, respectively. While scenario 4 integrates three types of features: terrain topography, land use and landscape pattern. Based on scenario 4, the optimal combination of features is explored and used as scenario 5.
Table 3. Experimental protocol.
2.3.3. Machine learning algorithms
Five widely used machine learning algorithms were selected for urban flood susceptibility assessment, including artificial neural network (ANN), naive Bayesian classifier (NB), random forest (RF), support vector machine (SVM), and extreme gradient boosting (XGBoost).
ANN is an abstract mathematical model inspired by modern neuroscience aiming to reflect the structure and function of the human brain. The general neural network model includes an input layer, a hidden layer and an output layer (Liu et al. Citation2020). The main function of the hidden layer is to increase the complexity of the ANN so that the algorithm can simulate complex nonlinear relationships. In this study, the back propagation (BP) algorithm is used to train the neural network model. The basic principle is to continuously adjust the parameters by forward propagation of the input signal and back propagation of the error signal, and finally the parameter with the lowest loss is the best learning parameter (Li and Fan Citation2022; Liu Citation2022). There are four important custom parameters in the BP neural network, which are the number of hidden layers, the number of nodes, the maximum iterations to learn and the activation function. In this study, the ‘RSNNS’ package is used to build the model on the R language compiler platform, and the grid search method is used to obtain the optimal set of parameters (Bergstra and Bengio Citation2012).
NB classifier is a Bayesian decision theory-based probabilistic classification model with the advantages of simplicity, high learning efficiency, and does not require complicated iterative parameter estimation schemes (He et al. Citation2019). For computational purposes, the NB classifier assumes that the features used for classification are independent of each other. Specifically, the input feature vector is assumed to be X = (x1, x2, …, xn) and the output categorical variable is Y = (y1, y2), and the Bayesian classifier calculates the prior probability P(Y=yi) and the posterior probability P(X=xi | Y=yi) based on the training set. Then for a given new instance, the maximum posterior probability is calculated using Bayes’ theorem (Lu Citation2022). In this study, the ‘e1071’ package in R language is used to implement the NB classifier model.
RF is an integrated learning algorithm designed based on the Bagging framework, with the core concept of bootstrap sampling (Breiman Citation2001; Liu et al. Citation2019). The algorithm process can be described as follows: 1) assume that there are N samples, and randomly select N samples with put-back; 2) assume that each sample has M features, and when each node of the decision tree needs to be split, randomly select m features from these M features, and then some strategy (such as information gain) is used to select 1 feature from these m features as the splitting attribute of the node; 3) based on the sampled N samples m features according to node splitting; 4) construct a large number of decision trees according to the above three steps, and finally synthesize the results of each tree (Lu Citation2022). There are two key parameters in the RF classifier, namely: the number of regression trees and the number of features per tree (Zhang et al. Citation2014). In this study, we use the ‘randomForest’ package of R language to build the model and use the grid search method to explore the optimal parameters.
SVM is a supervised machine learning technique based on statistical learning theory that provides a solution to nonlinear problems (Tang et al. Citation2019). The basic principle is to find the best partitioned hyper-plane in a high-dimensional feature space that maximizes the spacing between positive and negative samples on the training set. Compared with traditional linear regression models, SVM can solve the covariance problem without data distribution constraints and is less affected by outliers (Chen et al. Citation2022). The SVM classifier is sensitive to the kernel function, cost (C) and gamma (G), and other related parameters. The four commonly used kernel functions include Linear Kernel, Polynomial Kernel, RBF Kernel and Sigmoid Kernel, among which, Polynomial and RBF are the most common in SVM research (Marjanović et al. Citation2011). C parameter and G parameter can be preferred by the Tune function. This study implemented the construction of SVM models on the R language compilation platform using the "e1071" package and optimized hyperparameters through grid search.
XGBoost is an integrated learning algorithm based on the Boosting framework. The most important feature of this algorithm is that by expanding the loss function to the second order derivative, the gradient boosting model can better approximate the true loss (Chen et al. Citation2016). It is essentially a Gradient Boosting Decision Tree (GBDT) algorithm, but it outperforms GBDT in terms of algorithmic accuracy, speed and generalization ability (Jang et al. Citation2022). In this study, we use the ‘xgboost’ package of R language to construct the model, and used the grid search method to optimize the key parameters, such as the learning rate, max number of iterations, maximum depth of a tree, minimum sum of instance weight, gamma, subsample ratio of the training instance, subsample ratio of columns, lambda and alpha.
In addition, it is worth noting that all experiments in this study were conducted on the following hardware environment: AMD Ryzen 9 5900HX processor, NVIDIA GeForce RTX 3060 Laptop GPU, 32GB memory, and Windows operating system. RStudio was the programming software used in the experiments.
2.3.4. SHapely additive exPlanations (SHAP) method
This study quantified the contribution of each feature variable to the susceptibility of urban flood using the Shapley value as a unified measure of feature importance, and then performed feature preferences based on the relative contribution of each feature. SHAP is a game-theoretic-based technique proposed by Lundberg and Lee (Lundberg and Lee Citation2017). SHAP can be used to analyze the relative contribution of input features and the interaction between them (Vega García and Aznarte Citation2020). SHAP is the only consistent feature attribution method with the property of ‘local accuracy’, compensates for the limitations and inconsistencies of feature importance information inherent in the model, and provides a more detailed and personalized interpretation than global interpretation techniques (Chang et al. Citation2022; Jang et al. Citation2022). More detailed theoretical information on SHAP can be found in Lundberg and Lee (Citation2017). This study takes the constructed XGBoost model as a representative, utilizing the "shap" package on the R language compilation platform to interpret the XGBoost model. For detailed code information regarding SHAP, please refer to https://github.com/pablo14.
2.3.5. Accuracy evaluation
In this study, the receiver operating characteristic curve (ROC) and the corresponding areas under the curve (AUC) are used to evaluate the performance of each classifier. ROC and AUC are popular methods used to evaluate the performance of classifiers (Jaafari et al. Citation2018). AUC is the area enclosed by the X-axis and the ROC curve, and the range of AUC values is between 0.5 and 1 (Tang et al. Citation2019). The closer ROC is to the upper left corner of the axis, the better the classification effect and the larger the area under ROC (AUC).
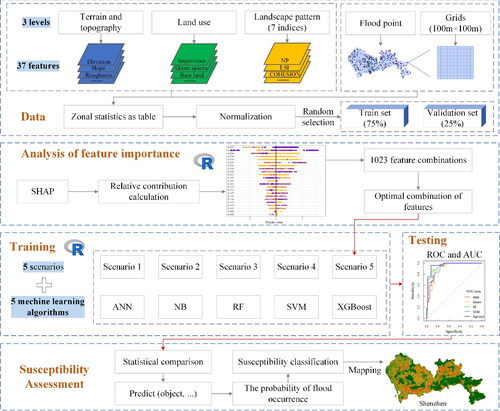
The general technical framework of machine learning-based urban flood susceptibility assessment is shown in .
Figure 2. Technical framework for urban waterlogging susceptibility assessment.
3. Results and discussion
3.1. Determination of the optimal combination of features
Scenario 1 to 4 in are used as comparison experiments without feature selection, aiming to explore effects of different categories on the accuracy of flood susceptibility assessment. Based on scenario 4, the final combination of features with the highest classification accuracy is chosen at randomly and freely combining 37 features to constitute scenario 5. However, calculations show that there are about 137.4 billion feature combinations for 37 features, each of which requires a separate model construction and hyper parameter optimization, which undoubtedly entails a huge cost in terms of time. To solve this problem, this study assumes that the least important part of the 37 features has a small and negligible impact on the performance of the classifier, and only the most important part of the features is selected for random free combination as a way to simplify the combination method of the 37 features.
Therefore, based on the above assumptions, the SHAP method was introduced in this study to quantify the contribution of each feature to the susceptibility of flood, and then feature preferences were made based on the relative contribution of each feature. Each point in represents the Shapley value of a sample. The closer the color of each point is to purple, the larger the value; the closer the color is to yellow, the smaller the value. The more discrete the point, the greater the impact of the feature on flood susceptibility. The vertical coordinate decreases in importance from the top to the bottom of the feature, and the following value indicates the mean of all Shapley absolute values. shows the top 23 features with Shapely value greater than zero. According to , the greater the Shapely value, the greater the influence of the features on flood susceptibility. Based on this, this study chose the top 10 features with the greatest influence for random free combination in order to simplify the combination of 37 features, and a total of 1023 feature combination methods were obtained. Then five machine learning algorithms were used to construct models and hyper parameter optimization for each feature combination, and the advantages and disadvantages of different feature combinations of each algorithm were measured by AUC, and a total of 5115 results were obtained (). Finally, based on , the feature combinations for each algorithm to obtain the maximum classification accuracy are further obtained, and this combination is used as the feature combination of scenario 5 ().
Figure 3. SHAP-based feature importance distribution.
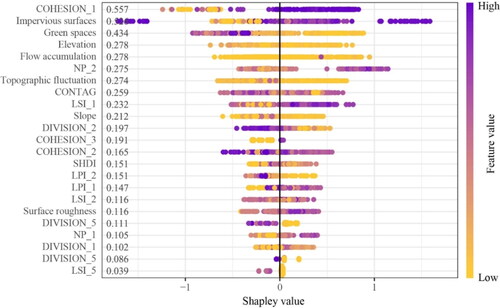
Figure 4. Comparison of the AUC values of each classifier with different feature combinations.
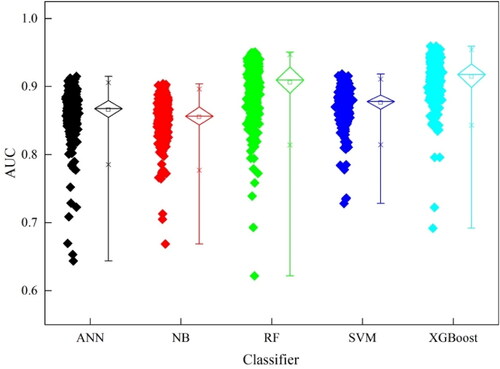
Table 4. Feature combinations for each classifier to obtain the maximum AUC.
3.2. Analysis of the importance of features affecting urban flood
The analysis of the optimal feature combinations of scenario 5 reveals that the two main categories of landscape pattern and terrain topography are used in the feature combinations of all five machine learning algorithms. Among them, the feature COHESION_1 is used in all five algorithms, indicating that COHESION_1 is a very important factor affecting the susceptibility of urban flood. This is mainly because the aggregation of large impervious surfaces will block the infiltration of rainwater and cut off the hydrological connection between surface water and groundwater, leading to an increased flood susceptibility. Additionally, we found that flow accumulation was included in the best feature combinations in ANN, RF, SVM, and XGBoost classifiers, indicating that flow accumulation can provide important feature information for urban flood susceptibility assessment. This may be due to the fact that flow accumulation aids in identifying spatial units with high impervious surfaces but with small cumulative water values, which are less prone to flood. However, flow accumulation is a topographic feature that is easily overlooked by several studies on urban flood susceptibility assessment (Tang et al. Citation2018; Tang et al. Citation2019; Zhao et al. Citation2019).
Further analysis of the optimal combination of features in scenario 5 revealed that there were differences in the weighting of different categories of features in participating in the urban flood susceptibility assessment. In terms of the number of features in different categories (), land use features account for the least number of features among the five machine learning algorithms, compared to landscape pattern and terrain topography. In the ANN algorithm, landscape pattern has the largest number of features, accounting for 4, followed by terrain topography, accounting for 2. In XGBoost, SVM and RF, the number of features of landscape pattern and terrain topography remained consistent, all with 3. In the NB algorithm, the number of terrain topography features is the highest, accounting for 3. In general, the comparison of the number of features in different categories shows that landscape pattern > terrain topography > land use.
Figure 5. The number of different feature types in the optimal feature combination (A) and the proportion of their Shapely values (B).
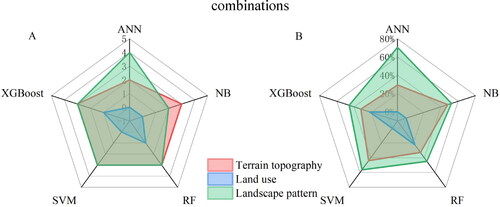
In terms of the weight of Shapely values for different types of features (), among the five machine learning algorithms of scenario 5, compared to terrain topography and land use, landscape pattern accounts for more than 50% in ANN, NB and SVM, while it accounts for 46% and 45% in XGBoost and RF, respectively. The share of land use is the lowest in each algorithm, which is generally consistent with the results in . In summary, the comparison of the weight of Shapley values for different categories of features shows that landscape pattern > terrain topography > land use, which further confirms the significant role of landscape pattern in flood susceptibility assessment.
However, it is worth noting that although topography plays a greater role in flood susceptibility than land use in general, impervious surface in land use features is still a very important factor in urban flood in terms of a single feature, with a Shapley value of 0.526. The most important feature of topography is elevation, with a Shapley value of 0.278, which is significantly lower than the impervious surface.
3.3. Comparison of different machine learning algorithms for urban flood susceptibility assessment
In order to quantitatively and accurately reflect the impact of different machine learning algorithms and different scenarios on the accuracy of urban flood susceptibility assessment, this study conducted an evaluation analysis of different scenarios in each algorithm using AUC values based on validation samples. In comparison to scenario 3, scenario 4 (based on terrain topography, land use, and landscape pattern) has the largest number of features but does not have the highest AUC value across all classifiers, demonstrating that more features are not often better (). When all features are involved in classification, the redundant features may be counterproductive due to information redundancy. Compared with the first four scenarios, the AUC values of scenario 5 after feature filtering in all classifiers has improved significantly, indicating that feature information that plays a key role in classification can be screened out through feature preference, and the interference of cross-redundant information can be avoided, resulting in a greater improvement of classification accuracy.
Figure 6. AUV values of each classifier in different scenarios (A) and their ROC (B).
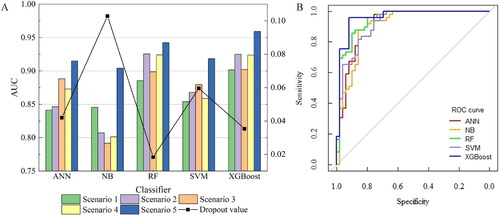
Among the five machine learning algorithms, the overall AUC value of XGBoost is higher, and the AUC values of XGBoost in different scenarios are greater than 0.900. In addition, a comparison of each classifier in scenario 5 shows that RF and XGBoost, as two machine learning algorithms based on decision trees, have significantly better classification accuracy than ANN, NB, and SVM. Between them, XGBoost has the highest AUC value of 0.9592, which is 0.017 higher than RF and 0.055 higher than the worst NB.
The difference of AUC obtained by using all features (scenario 4) and using the best feature combination (scenario 5) is called the dropout value, which reflects the dependence of each classifier on the best features. RF has the smallest dropout value of 0.018 (), indicating that it has the least reliance on the best features, which might be related to the fact that RF randomly selects the features while constructing each decision tree, hence the addition of additional features has less detrimental impact (Xiao et al. Citation2020). In contrast, the relationship between the features of NB, a classifier that uniquely assumes the features are independent of each other, has a significant impact on model performance, resulting in NB having the highest dropout value of 0.103. The comparison of the first four scenarios of NB also shows that scenario 1 has the least number of features, but its AUC value is significantly higher than that of scenario 2, 3 and 4, which indicates that the inclusion of additional features can have a significant negative impact on the classification performance of NB. In addition, the comparison of the classifiers () also reveals that NB is paired with the least number of features among the five machine learning algorithms, which further confirms that the NB classifier is more dependent on the best features.
Additional information can be obtained from the ROC of the five classifiers when they achieve maximum classification accuracy. It can be seen that no classifier can occupy the optimum at all thresholds, but XGBoost is closer to the upper left corner of the axis and shows better performance overall compared to the other models (). Specifically, XGBoost is closest to the upper-left corner of the axis when sensitivity is between 70% and 96%. Compared with XGBoost, ANN, RF, and SVM dominate at Sensitivity between 96% and 98%, with ANN being the closest to the upper left corner of the coordinate axis, but the Specificity is severely underestimated due to the extreme value taking. Therefore, in general, it is still considered that XGBoost can be the preferred classifier for urban flooding susceptibility assessment.
3.4. Urban flood susceptibility assessment
In order to reveal the spatial distribution of urban flood susceptibility in Shenzhen, this study obtained the flood susceptibility prediction results for each spatial unit in the study area based on the obtained optimal flood susceptibility assessment process method (i.e. the model obtained by XGBoost with the optimal combination of features). It can be seen that the susceptibility prediction values of each spatial unit range from 0 to 0.99 (), and the larger the susceptibility prediction value, the higher the probability of flood in that spatial unit. Based on , natural intermittent method was used to classify the susceptibility level of flooding into five categories: highest susceptibility, high susceptibility, medium susceptibility, low susceptibility and lowest susceptibility (Tang et al. Citation2019).
Figure 7. XGBoost-based urban flooding susceptibility prediction (a), susceptibility level classification (B), and zoning statistics (C).
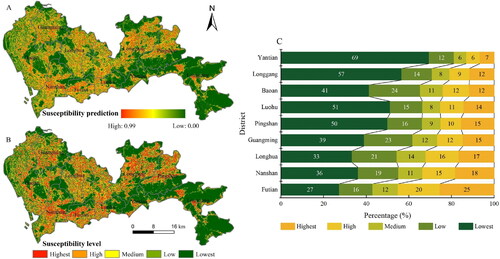
It can be seen that there are obvious regional differences in the distribution of urban flood susceptibility levels in Shenzhen (). Overall, the area proportions of highest susceptibility, high susceptibility, medium susceptibility, low susceptibility and lowest susceptibility areas in Shenzhen are 13.59%, 11.55%, 9.74%, 18.02% and 47.10%, respectively. Among them, the high-susceptibility areas are more obviously distributed in Futian District, the central part of Nanshan District, the northern part of Pingshan District, the western part of Luohu District and the northern part of Longgang District. Beacause of low vegetation coverage and flat terrain, these areas are more vulnerable to urban flood. The low-susceptibility areas are mainly located in the southeast of Longgang District, the north of Yantian District, the west of Luohu District and the south of Pingshan District, where the rugged terrain and lush vegetation can effectively reduce the susceptibility of flood. We computed the proportion of land occupied by different flood susceptibility levels in each region based on ‘Zonal Statistics’ in ArcGIS to further compare and evaluate the distribution of flood susceptibility in different administrative divisions of Shenzhen (). In terms of the proportion of area occupied by low-susceptibility areas, the proportion in Yantian, Longgang, Luohu, and Pingshan districts are above 50%, while the proportion in Baoan, Guangming, Nanshan, Longhua, and Futian districts are 41%, 39%, 36%, 33%, and 27%, respectively. While Futian District has the highest proportion of high-susceptibility areas, 25%, followed by Nanshan District, Longhua District and Guangming District, while Bao’an District, Longgang District and Yantian District have the lowest proportion of high-susceptibility areas, 12%, 12% and 7%, respectively. The prevention and control of urban flood, as well as the optimization of the impervious surface pattern and the layout of the underground drainage pipe network, should be prioritized for this segment of the high-susceptibility distribution.
4. Conclusion
Landscape pattern has significant influence on urban flooding susceptibility in the importance assessment of features, where impervious surface cohesion shows the highest importance and is used in the optimal feature combinations of all five machine learning algorithms. Therefore, the optimization of surface landscape pattern, especially the optimization of the spatial aggregation of impervious surface, should be emphasized in the future urban flood prevention and control.
The impact of incorporating different feature variables based on topographic characteristics on the accuracy of flood susceptibility prediction varies. In scenario 4, the AUC value did not approach the optimal with the combination of terrain topography, land use, and landscape pattern. In contrast, the AUC values following feature optimization using SHAP showed improved significantly. The above results show that the SHAP-based feature optimization method is feasible, and can retain the most important feature information of the ground surface, maintain a high accuracy level while reducing the data dimensionality.
XGBoost coupled with seven features, namely impervious surface cohesion, impervious surface area, elevation, flow accumulation, number of green space patches, contagion, and slope, delivers the best results among all classifiers, and its ROC curve is overall closer to the upper left corner of the coordinates. Therefore, XGBoost can be the first choice for urban flood susceptibility assessment. The results of NB are relatively poor compared with other classifiers, and NB is paired with the least number of features and more dependent on the best features.
The proportion of area occupied by highest susceptibility, high susceptibility, medium susceptibility, low susceptibility and lowest susceptibility areas in Shenzhen is 13.59%, 11.55%, 9.74%, 18.02% and 47.10%, respectively. In terms of spatial distribution, there are obvious regional differences in the distribution of flood susceptibility, among which, the proportion of area occupied by high-susceptibility areas in Futian District is the highest, followed by Nanshan District and Longhua District. Construction activities in high-susceptibility area should be strictly controlled in future urban renewal planning, and the drainage emergency management capacity of high-susceptibility areas should be strengthened to prevent the hazards caused by urban flood from the city planning source.
This study has certain limitations. First, it is a flood susceptibility assessment study from the perspective of ground information without considering the influence of underground drainage network. However, the underground drainage network is an important component in the urban flood study. Therefore, an integrated consideration of above-ground and below-ground is required in the subsequent study, with a view to further improving the rationality of urban flood susceptibility assessment. Secondly, we collected data on flood points in Shenzhen from 2015 to 2016, but lacked specific dates. Therefore, we assumed that the precipitation in the study area was constant, but this may have some influence on the study results.
CRediT authorship contribution statement
Conceptualization, JZ and YZ; Data Curation, YZ and CZ; Methodology, YZ, JZ and CZ; Software and code, JZ and ZA; Formal analysis, JZ, JW and YZ; Resources, JW and ZA; Visualization, JZ and CZ; Writing – Original Draft, JZ; Writing – Review & Editing, JZ, ZA and YZ; Supervision, YZ and JW; Project administration, YZ.
Disclosure statement
No potential conflict of interest was reported by the author(s).
Data availability statement
Data will be made available on request.
Additional information
Funding
References
- Benito G, Lang M, Barriendos M, Llasat MC, Frances F, Ouarda T, Thorndycraft VR, Enzel Y, Bardossy A, Coeur D, et al. 2004. Use of systematic, palaeoflood and historical data for the improvement of flood risk estimation. Review of scientific methods. Nat Hazards. 31(3):623–643. doi: 10.1023/B:NHAZ.0000024895.48463.eb.
- Bergstra J, Bengio Y. 2012. Random search for hyper-parameter optimization. J Mach Learn Res. 13(1):281–305.
- Breiman L. 2001. Random forests. Mach Learn. 45(1):5–32.), doi: 10.1023/A:1010933404324.
- Budholiya K, Shrivastava SK, Sharma V. 2022. An optimized xgboost based diagnostic system for effective prediction of heart disease. J King Saud Univ - Comput Inform Sci. 34(7):4514–4523. doi: 10.1016/j.jksuci.2020.10.013.
- Chang I, Park H, Hong E, Lee J, Kwon N. 2022. Predicting effects of built environment on fatal pedestrian accidents at location-specific level: application of xgboost and shap. Accid Anal Prev. 166:106545. doi: 10.1016/j.aap.2021.106545.
- Chen D, Zhang F, Zhang M, Meng Q, Jim CY, Shi J, Tan ML, Ma X. 2022. Landscape and vegetation traits of urban green space can predict local surface temperature. Sci Total Environ. 825:154006. 10.1016/j.scitotenv.2022.154006.
- Chen TQ, Guestrin C, Assoc CM. 2016. Xgboost: a scalable tree boosting system. Proceeding of the 22nd acm sigkdd International Conference on Knowledge Discovery and Data Mining, 785 – 794. doi: 10.1145/2939672.2939785.
- Chen W, Hong H, Li S, Shahabi H, Wang Y, Wang X, Ahmad BB. 2019. Flood susceptibility modelling using novel hybrid approach of reduced-error pruning trees with bagging and random subspace ensembles. J Hydrol (Amst). 575:864–873. doi: 10.1016/j.jhydrol.2019.05.089.
- Cheng T, Xu Z, Hong S, Song S. 2017. Flood risk zoning by using 2d hydrodynamic modeling: a case study in Jinan City. Math Probl Eng. 2017:1–8. doi: 10.1155/2017/5659197.
- Bisht DS, Chatterjee C, Kalakoti S, Upadhyay P, Sahoo M, Panda A., 2016. Modeling urban floods and drainage using SWMM and MIKE URBAN: a case study. Nat Hazards. 84(2):749–776. doi: 10.1007/s11069-016-2455-1.
- Du S, Van Rompaey A, Shi P, Wang JA. 2015. A dual effect of urban expansion on flood risk in the Pearl River Delta (China) revealed by land-use scenarios and direct runoff simulation. Nat Hazards. 77(1):111–128. doi: 10.1007/s11069-014-1583-8.
- Felder G, Zischg A, Weingartner R. 2017. The effect of coupling hydrologic and hydrodynamic models on probable maximum flood estimation. J Hydrol. 550:157–165. doi: 10.1016/j.jhydrol.2017.04.052.
- Hawker L, Uhe P, Paulo L, Sosa J, Savage J, Sampson C, Neal J. 2022. A 30 m global map of elevation with forests and buildings removed. Environ Res Lett. 17(2):024016. doi: 10.1088/1748-9326/ac4d4f.
- He Q, Shahabi H, Shirzadi A, Li S, Chen W, Wang N, Chai H, Bian H, Ma J, Chen Y, et al. 2019. Landslide spatial modelling using novel bivariate statistical based Naïve Bayes, RBF classifier, and RBF network machine learning algorithms. Sci Total Environ. 663:1–15. doi: 10.1016/j.scitotenv.2019.01.329.
- Hénonin J, Hongtao M, Zheng-Yu Y, Hartnack J, Havnø K, Gourbesville P, Mark O., 2015. Citywide multi-grid urban flood modelling: the July 2012 flood in Beijing. Urban Water J. 12(1):52–66. doi: 10.1080/1573062X.2013.851710.
- Jaafari A, Zenner EK, Pham BT. 2018. Wildfire spatial pattern analysis in the Zagros mountains, Iran: a comparative study of decision tree based classifiers. Ecol Inform. 43:200–211. doi: 10.1016/j.ecoinf.2017.12.006.
- Jang E, Kim YJ, Im J, Park Y, Sung T. 2022. Global sea surface salinity via the synergistic use of SMAP satellite and HYCOM data based on machine learning. Remote Sens Environ. 273:112980. doi: 10.1016/j.rse.2022.112980.
- Jenson K, Domingue O. 1988. Extracting topographic structure from digital elevation data for geographic system analysis. Pe. & RS. 54(11)
- Jiang W, Deng L, Chen L, Wu J, Li J. 2009. Risk assessment and validation of flood disaster based on fuzzy mathematics. Prog Nat Sci. 19(10):1419–1425. doi: 10.1016/j.pnsc.2008.12.010.
- Li Q, Jiang X, Liu D. 2013. Analysis and modelling of flood risk assessment using information diffusion and artificial neural network. WSA. 39(5):643–648. doi: 10.4314/wsa.v39i5.8.
- Li R, Cui L, Fu H, Meng Y, Li J, Guo J. 2020. Estimating high-resolution PM1 concentration from Himawari-8 combining extreme gradient boosting-geographically and temporally weighted regression (XGBoost-GTWR). Atmos Environ. 229 (1994):117434. doi: 10.1016/j.atmosenv.2020.117434.
- Li S, Fan Z. 2022. Evaluation of urban green space landscape planning scheme based on pso-bp neural network model. Alex Eng J. 61(9):7141–7153. doi: 10.1016/j.aej.2021.12.057.
- Liang ZC, Zhao YL, Fu YC. 2017. Optimization of spatial pattern of urban imperviousness based on the integration of scs-cn hydrological model and the ant colony algorithm. J Geo-Inform Sci. 19(10):1315–1326.
- Liu X, Zhu X, Zhang Q, Yang T, Pan Y, Sun P. 2020. A remote sensing and artificial neural network-based integrated agricultural drought index: index development and applications. Catena (Amst). 186:104394. doi: 10.1016/j.catena.2019.104394.
- Liu H. 2022. Optimal selection of control parameters for automatic machining based on bp neural network. Energy Rep. 8:7016–7024. doi: 10.1016/j.egyr.2022.05.038.
- Liu WD, Tang ZP, Xia Y, Han MY, Jiang WB. 2019. Identifying the key factors influencing chinese carbon intensity using machine learning, the random forest algorithm, and evolutionary analysis. Acta Geogr Sin. 74(12):2592–2603.
- Lu W. 2022. Machine learning formula derivation and code implementation. People’s posts and telecommunications Press, Beijing.
- Lundberg SM, Lee SI. 2017. A unified approach to interpreting model predictions . Advances in neural information processing systems 30 (NIPS 2017), Long Beach, CA, USA, Curran Associates Inc. pp . 4768–4777.
- Luo K, Zhang X. 2022. Increasing urban flood risk in China over recent 40 years induced by lucc. Landsc Urban Plan. 219:104317. doi: 10.1016/j.landurbplan.2021.104317.
- Ma M, Zhao G, He B, Li Q, Dong H, Wang S, Wang Z. 2021. Xgboost-based method for flash flood risk assessment. J Hydrol (Amst). 598:126382. doi: 10.1016/j.jhydrol.2021.126382.
- Marjanović M, Kovačević M, Bajat B, Voženílek V. 2011. Landslide susceptibility assessment using SVM machine learning algorithm. Eng Geol. 123(3):225–234. doi: 10.1016/j.enggeo.2011.09.006.
- Qian Y, Wang H, Wu J. 2021. Protecting existing urban green space versus cultivating more green infrastructures: strategies choices to alleviate urban waterlogging risks in Shenzhen. Remote Sens (Basel). 13(21):4433. doi: 10.3390/rs13214433.
- Rui XF, Jiang CY, Chen QJ, Ding XY. 2015. Principle analysis and application of storm water management model on stimulating rainfall-runoff. Adv Sci Technol Water Res. 4(35):1–5.
- Smith MB. 1993. A GIS‐based distributed parameter hydrologic model for urban areas. Hydrol Process. 7(1):45–61. doi: 10.1002/hyp.3360070106.
- Su BN, Huang H, Zhang N. 2015. Dynamic urban waterlogging risk assessment method based on scenario simulations. J Tsinghua Univ (Sci Technol). 55(06):684–690.
- Tang X, Hong H, Shu Y, Tang H, Li J, Liu W. 2019. Urban waterlogging susceptibility assessment based on a pso-svm method using a novel repeatedly random sampling idea to select negative samples. J Hydrol (Amst). 576:583–595. doi: 10.1016/j.jhydrol.2019.06.058.
- Tang X, Shu Y, Lian Y, Zhao Y, Fu Y. 2018. A spatial assessment of urban waterlogging risk based on a weighted Naïve Bayes classifier. Sci Total Environ. 630:264–274. doi: 10.1016/j.scitotenv.2018.02.172.
- Tan Y, Cheng Q, Lyu F, Liu F, Liu L, Su Y, Yuan S, Xiao W, Liu Z, Chen Y. 2024. Hydrological reduction and control effect evaluation of sponge city construction based on one-way coupling model of SWMM-FVCOM: a case in university campus. J Environ Manage. 349:119599. 10.1016/j.jenvman.2023.119599.
- Tingsanchali T, Karim F. 2010. Flood-hazard assessment and risk-based zoning of a tropical flood plain: case study of the Yom River, Thailand. Hydrol Sci J/J Des Sci Hydrol. 55(2):145–161. doi: 10.1080/02626660903545987.
- Vega García M, Aznarte JL. 2020. Shapley additive explanations for no2 forecasting. Ecol Inform. 56:101039. doi: 10.1016/j.ecoinf.2019.101039.
- Wang WW, Wang Q, Lin H, Gong JD, Zhang SW. 2015. Summarization and prospection for the studies on China’s urban waterlogging. Urban Problems. (10), :24–28.
- Wang Z, Lai C, Chen X, Yang B, Zhao S, Bai X. 2015. Flood hazard risk assessment model based on random forest. J Hydrol (Amst). 527:1130–1141. doi: 10.1016/j.jhydrol.2015.06.008.
- Woznicki SA, Baynes J, Panlasigui S, Mehaffey M, Neale A. 2019. Development of a spatially complete floodplain map of the conterminous United States using random forest. Sci Total Environ. 647:942–953. doi: 10.1016/j.scitotenv.2018.07.353.
- Wu JS, Zhang PH. 2017. The effect of urban landscape pattern on urban waterlogging. Geogr Sin. 72(03):444–456.
- Xiao XW, Shen XY, Ke CQ, Zhou XH. 2020. Comparison of machine learning algorithms based on sentinel-1a data to detect icebergs. Acta Geod Cartogr Sin. 49(04):509–521.
- Xu Y, Zhen JN, Jiang XP, Wang JJ. 2021. Mangrove species classification with UAV-based remote sensing data and xgboost. Natl Remote Sen Bull. 25(3):737–752. doi: 10.11834/jrs.20210281.
- Yang LY, Chen YB. 2021. Information extraction and analysis on temporal and spatial pattern changes of surfaces impervious to water in Shenzhen City during 1979-2020. Bull Soil Water Conserv. 41(05):198–205.
- Yang XL, Ding JH, Hou H. 2013. Application of a triangular fuzzy ahp approach for flood risk evaluation and response measures analysis. Nat Hazards. 68(2):657–674. doi: 10.1007/s11069-013-0642-x.
- Ye C, Xu Z, Lei X, Chen Y, Ding X, Liang Y. 2023. Flood simulation and risk analysis on urban block scale based on swmm and infoworks icm. Water Resources Protection. 39(02):87–94.
- Zhang L, Wang LL, Zhang XD, Liu SR, Sun PS, Wang TQ. 2014. The basic principle of random forest and its applications in ecology: a case study of Pinus yunnanensis. Acta Ecol Sin. 34(03):650–659.
- Zhang Q, Wu Z, Zhang H, Dalla Fontana G, Tarolli P. 2020. Identifying dominant factors of waterlogging events in metropolitan coastal cities: the case study of guangzhou, china. J Environ Manage. 271:110951. doi: 10.1016/j.jenvman.2020.110951.
- Zhao G, Pang B, Xu Z, Peng D, Xu L. 2019. Assessment of urban flood susceptibility using semi-supervised machine learning model. Sci Total Environ. 659:940–949. doi: 10.1016/j.scitotenv.2018.12.217.
- Zou Q, Zhou J, Zhou C, Song L, Guo J. 2013. Comprehensive flood risk assessment based on set pair analysis-variable fuzzy sets model and fuzzy AHP. Stoch Environ Res Risk Assess. 27(2):525–546. doi: 10.1007/s00477-012-0598-5.