
 ?Mathematical formulae have been encoded as MathML and are displayed in this HTML version using MathJax in order to improve their display. Uncheck the box to turn MathJax off. This feature requires Javascript. Click on a formula to zoom.
Abstract
Bhaktapur, lying in the Kathmandu Basin, suffered damages during the 2015 Gorkha Earthquake, potentially exacerbated by local site effects. This research addresses the lack of site response study on Suryabinayak Municipality, located in the southern part of Bhaktapur district. Horizontal to Vertical Spectral Ratio (HVSR) and Floor Spectral Ratio (FSR) methods were employed to determine the fundamental frequencies of soil deposits at 241 free field stations and 20 Reinforced Concrete (RC) isolated buildings respectively. The fundamental frequency of soil deposits varies from 0.27 Hz to 10.00 Hz. Higher frequencies were noted near the basin edges, attributed to shallow sediment deposits, whereas a lower frequencies prevailed towards the basin centre due to an increase in sediment thickness. Out of 20 buildings studied, 7 are highly susceptible to soil-structure resonance as the frequency disparity between building and free-field is less than 15%. This research not only quantified the frequency distribution and soil-structure resonance likelihood but also established a correlation between building height and its fundamental frequency. A significant correlation is observed with a coefficient of determination (R2) value of 60.64% and 83.36% in the longitudinal and transverse directions respectively. The study’s results can be endorsed to mitigate seismic hazards, build seismic-resilient structures, and maintain historical monuments.
1. Introduction
Suryabinayak Municipality is located in a rapidly urbanizing settlement lying on the southeast part of Kathmandu basin occupying an area of 42.45 km2. The study area is a hilly region lying in the foothills of the Suryabinayak reserve forest, with rugged terrains in the form of gentle ridges, saddles, spurs, and valleys with gradually sloping topography. The occurrence of large earthquakes every 80–100 years has resulted in significant damage in Kathmandu Valley and the vicinity of Bhaktapur City (Rana Citation1935; Pandey and Molnar Citation1988; Chaulagain et al. Citation2018). The recent 2015 Gorkha earthquake has shown the uneven distribution of damages in the core areas as well as the basin edges of Kathmandu Valley (such as Sankhu and Ramkot) (Goda et al. Citation2015; McGowan et al. Citation2016; Ohsumi et al. Citation2016; Shakya and Kawan Citation2016; Chaulagain et al. Citation2018). According to the Ministry of Home Affairs, Nepal (MoHA Citation2015), 333 people lost their lives, 2101 people were injured, and 18,905 buildings collapsed completely in Bhaktapur district in the 2015 Gorkha Earthquake. Following the 2015 Gorkha Earthquake, 6721 and 84 beneficiaries were granted funds for the reconstruction and strengthening of buildings respectively in Suryabinayak Municipality, Bhaktapur by the Nepal Reconstruction Authority (NRA). The significant damage to structures in the study region may be caused by unplanned settlement, haphazard building construction, and improper adherence to National building codes. Furthermore, compared to the 2011 A.D. census, the population density and total number of households in Suryabinayak Municipality increased by about 45% and 37% respectively, in the 2021 census (censusnepal.cbs.gov.np) and are increasing. Due to these reasons, a high risk of vulnerability during seismic events can be anticipated in the coming future and implies the need for site effect study in the study area.
Besides this, local geology (stratigraphic effect), topographic effects, and geotechnical characteristics also play a significant role in escalating damages to a particular site during an earthquake (Kim et al. Citation2018; Sextos et al. Citation2018; Fayjaloun et al. Citation2021; Sabetta et al. Citation2023). When the seismic wave propagates near-surface soil deposits, significant fluctuations in ground motion characteristics (amplitude, frequency content, and duration) occur, which is the primary cause of stratigraphic or local site effects. Besides this, the surface topography and terrains also affect the motion characteristics. However, Geli et al. (Citation1988) pointed out that the topographical effect on ground motion is quite complex and depends on various factors such as surface layering and wave fields. Various researchers (Rizzitano et al. Citation2014; Mori et al. Citation2022) carried out a study accounting for both the stratigraphic and topographic effects on the ground motion and suggested that a very complex interaction exists between these effects and is difficult to evaluate independently. The Mexico City Earthquake is a clear example of the effects of underlying geology and soil conditions and the amplification caused by them (Lermo and Chávez-García 1994b; Osorio and Mayoral Citation2013). This earthquake occurred on 19 September 1985, with a magnitude of Ms = 8.1, causing moderate damage in the nearby area of its epicentre but causing extreme damage in Mexico City, which is about 350 km from the epicentre (Kramer Citation1996; Mayoral et al. Citation2019). Furthermore, some earthquakes (e.g. Loma Prieta 1989, Northridge 1994, Kobe 1995, Bhuj 2001, Central Italy earthquake 2016, and Gorkha 2015) show how the local soil condition affects the extent of damage to buildings and loss of life (Manne and Satyam Citation2013; Sextos et al. Citation2018). Sharma et al. (Citation2017) conducted a study on the impacts of surface geology and topography on the level of damage during the 2015 Nepal Gorkha Earthquake. The authors placed a strong emphasis on the local site conditions, showing that soft soil deposits, ridge effects, and basin effects, in addition to non-engineered structures play a critical role in determining the extent of building damage. Our study area lies in Kathmandu Basin, which is predominantly filled with thick, soft Pleistocene fluvio-lacustrine sediments consisting of silt, sand, clay, and gravel (Dangol Citation1985; Yoshida and Gautam Citation1988; Sakai Citation2001; Sakai et al. Citation2002; Bijukchhen et al. Citation2017). The local site effect in the study area can be expected due to its varying soil formation, stratigraphic features, and topography. According to previous research (Pandey and Molnar Citation1988; Hough and Bilham Citation2008; Paudyal et al. Citation2012), the fluvio-lacustrine deposit in the Kathmandu valley amplified ground motion during the 1934 Nepal-Bihar earthquake.
The characteristics of these soft deposits can be determined using different approaches such as laboratory testing, wave propagation models, and different empirical methods (Pegah and Liu Citation2016; Bijukchhen et al. Citation2017; Álvarez et al. Citation2022). Among them, an experimental microtremor HVSR technique proposed by Nakamura (Citation1989) which was first introduced by Nogoshi and Igarashi (Citation1971) following the initial research of Kanai and Tanaka (Citation1961), is a widely used method for microzonation as well as site response investigations due to its easiness, affordability, and effectiveness. These microtremors are very weak signals with very low amplitude and intensity of shaking (Okada Citation2003), and is difficult to address the non-linear behaviour of soil (Field and Jacob Citation1993; Kramer Citation1996; Satyam and Towhata Citation2016; Stanko et al. Citation2019; Kawan et al. Citation2022). However, the non-linear influence of soil could be taken into consideration if the measurement is carried out during intense earthquake shaking. Through the use of non-linear attributes (material damping curves, stress-strain backbone curves, yield surfaces) in cyclic non-linear models or advanced constitutive models, these non-linear site responses can be better understood (Darendeli Citation2001; Bazzurro and Cornell Citation2004; Mahmood et al. Citation2020; Kawan et al. Citation2022). Even though strong ground motion may result in the non-linear behaviour of soil, several investigations (Lermo and Chávez-García 1994b; Bhandary et al. Citation2021) show a good concordance between weak signal and strong motion site response. So, The microtremor technique has been used for the seismic microzonation around the world that are located in soft deposits, such as those in the Kathmandu Basin (Lermo and Chávez-García 1994a; Gallipoli et al. Citation2004; Paudyal et al. Citation2012; Rochman et al. Citation2023). Seismic microzonation using microtremor observations was carried out by Paudyal et al. (Citation2012) primarily focusing on the three main core areas of Kathmandu Valley at grid spacing of 1000 m. However, the present study is conducted at the southeast edge of Kathmandu Basin at a much denser grid. The microtremor HVSR method also known as Nakamura’s method was utilized for frequency-based microzonation mapping of the study area.
Likewise, the measurement of ambient vibrations in the structure has been introduced by different researchers (Nakamura Citation1997; Gallipoli et al. Citation2004; Gosar et al. Citation2010; Herak Citation2011; Stanko et al. Citation2017; Bhandary et al. Citation2021) to determine building characteristics, vulnerability index, frequency shifts, and soil-structure resonance possibility. Vacca et al. (Citation2022) proposed a seismic model calibrated on ambient vibrations (SMAV) for calculating fragility curves that have good coherency with nonlinear FEM methods. These fragility curves based on the SMAV model can be used in seismic risk assessment at different locations. These SMAV models can also address the non-linear seismic behaviour of a building by knowing its frequency shift. Gallipoli et al. (Citation2004) attempted to determine the frequency shift before and following the building damage and found that the frequency decreased by 25% compared to the undamaged one. In addition, investigating the potential for soil-structure resonance might shed light on a building’s susceptibility to earthquakes. In recent years, the possibility of soil-structure resonance has been investigated frequently using microtremor measurements (Gallipoli et al. Citation2004; Gosar Citation2010; Gosar et al. Citation2010; Herak Citation2011; Al-Nimry et al. Citation2014; Gallipoli et al. Citation2020; Tragni et al. Citation2021). The resonance between the ground and the structure is an important factor in amplifying structural damage (Gosar et al. Citation2010; Öziçer et al. Citation2017; Stanko et al. Citation2017; Kumar and Narayan Citation2018; Bhandary et al. Citation2021). Bhandary et al. (Citation2021) investigated the impact of the resonance of tall buildings in the Kathmandu Basin aftermath 2015 Gorkha earthquake. They concluded that one of the major factors contributing to structural damage was the resonance between soil and structure.
This study strives to understand the spatial distribution of the fundamental frequencies of soil deposits in the area and to observe the possibility of soil-structure resonance during the next earthquake. For the aforementioned goals, we considered grid sizes of 200 × 200 m and 400 × 400 m in densely and sparsely populated regions respectively, and observed ambient vibration measurements at the intersection of the grid lines. The measurements were carried out in 241 locations and microzonation based on fundamental frequency was prepared. The microtremor measurement of 20 Reinforced Concrete (RC) isolated buildings, primarily residential buildings, was also performed to assess the predominant frequency of the structures. The frequencies obtained for the selected buildings were then compared with the fundamental frequency of the ground to check the possibility of resonance. The authors believe that the presented results will be useful for seismic vulnerability assessment, seismic hazard mitigation, urban planning, and preservation of monuments in the study area.
2. Area of interest
Geologically, the intermontane basin of the Kathmandu basin is surrounded by pre-Cambrian to Devonian basement rocks of the Kathmandu complex and is composed of Pilo-Pleistocene and recent quaternary fluvio-lacustrine deposits (Shrestha et al. Citation1999; Chapagain et al. Citation2010). Sakai (Citation2001) proposed a stratigraphic division of Kathmandu basin sediments into three parts: southern, central, and northern part. The southern region is made up of alluvial fan deposits with lake deposits of clay, silt, and sand. Piedmont fan deposits which are fluvio-deltaic or fluvio-lacustrine deposits constitute the northern portion. The central part has dark grey carbonaceous clay, river sand, and mud beds. shows the Engineering geological map of Suryabinayak Municipality and surrounding areas published by the Department of Mines and Geology (DMG) (Shrestha et al. Citation1998). The study area is mainly composed of the black clay soil of the Kalimati Formation with recent floodplain deposits of the Hanumante River and basement rocks of the Tistung Formation in the basin edge.
Figure 1. (a) Engineering geological map of Suryabinayak Municipality and surrounding areas with data acquisition points (redrawn and modified after Shrestha et al. (Citation1998). Source: Department of Mines and Geology (DMG), Nepal. (b) Stratigraphic cross section profile of Bhaktapur district from South (S) to North (N). Redrawn and modified after Kawan et al. (Citation2019)
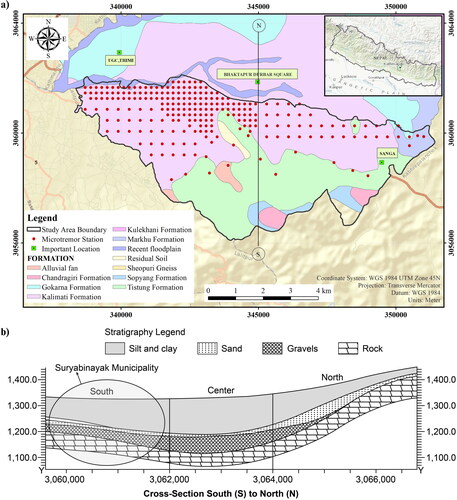
The Kalimati Formation is predominantly composed of black clay, grey to dark silty clay with fine sand bed, organic clay, and peat layers (Paudel and Sakai Citation1970; Sakai Citation2001). The floodplain deposits are composed of fine silts, sand, and clay-rich in humus. The Precambrian to Devonian Tistung formation consists of greenish-grey to brown fine-grained phyllite and slate with sand and quartzite. According to several studies (Chapagain et al. Citation2010; Kawan et al. Citation2019), Bhaktapur is made up of weak geological formations with highly loose soil structures. These factors contribute to the strong shaking of the structures, which causes a significant amount of damage. The Suryabinayak region has bedrock outcroppings in certain sections that are covered with a thin layer of coarse sediment (Kawan et al. Citation2019). This region is anticipated to have relatively little shaking and minimal damage compared to areas with thick soft sediment deposits. shows the stratigraphic cross-section profile of the Bhaktapur district along the South to North direction. The profile clearly illustrates thin sediment deposits in the Suryabinayak Municipality than that in the centre part.
3. Materials and methods
3.1. Instrumentation
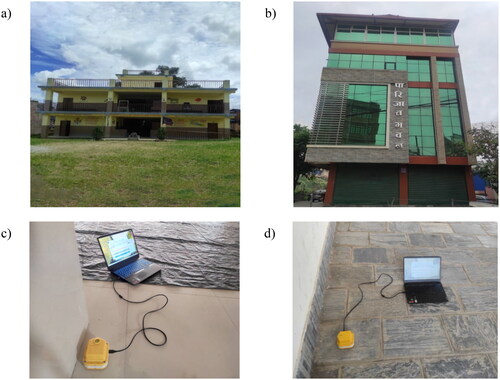
A portable geophone HG-6 manufactured by HGS (India) Limited with technology transfer from sensor Nederland BV with a natural frequency of 4.5 Hz was used for ambient vibration measurements owing to its compact size, lightweight, and easy setup. The device consists of three sensors that are arranged perpendicularly to one another inside the housing. The sensor detects ground vibration in three different components: two horizontal (East-west direction and North-South direction) and one vertical up–down direction). Microtremors in free fields and structures were recorded using Themino-Dolfrang data acquisition software (www.theremino.com; Magaro Citation2016) and a portable laptop as shown in .
Figure 2. (a) Instrumentation for the data acquisition; (b) comparison of frequency obtained from geophone and accelerometer.
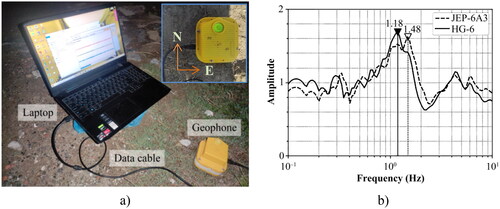
Before measurement, a huddle test was conducted between two different instruments on the ground premises of Khwopa Engineering College, Libali, Bhaktapur. The purpose was to compare the results of a geophone and a strong motion accelerometer (MITSUTOYO JEP-6A3-2 triaxial accelerometer of 3 Hz). Placed 2 m apart, the instruments measured vibrations for 15 min. The geophone’s result was then compared to that of an accelerometer to ensure instrument reliability. Based on the results, the geophones had a peak frequency of 1.18 Hz, whereas the accelerometer’s peak frequency was 1.48 Hz (). Khanal et al. (Citation2023) used ambient vibrations to evaluate soil characteristics in Hetauda, Bagmati Province, Nepal, and compared geophone and accelerometer having identical specifications as ours. In most of the sites, they discovered very similar results from both instruments. Since accelerometers are not recommended for microtremor measurement because they are not sensitive enough for frequencies less than 1 Hz (SESAME Citation2004) and require lengthy setup time, HG-6 geophone was used in this study to collect ambient vibration data.
3.2. Free-field measurements and analysis
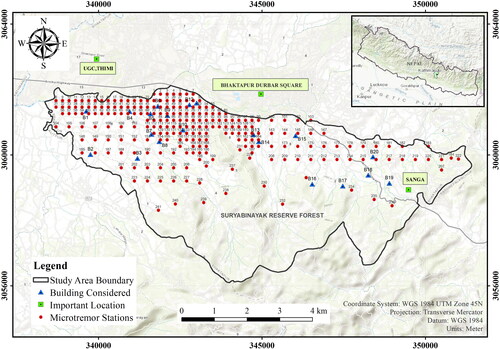
A total of 241 measurement points were considered with a grid spacing of 200 × 200 m and 400 × 400 m in densely and sparsely populated areas, respectively (). The precise location of the microtremor station was determined with the use of a Geographic Positioning System (GPS) and reference sites such as roads, schools, and governmental buildings.
Figure 3. Microtremor measurement station in 200 × 200 m and 400 × 400 m grid spacing and location of building considered. B = building.
The recording duration, recording parameters, and soil-sensor coupling were configured as shown in . The microtremor data acquisition in each station was recorded for at least 15 min at a sampling frequency of 100 Hz. The processing and analysis of microtremor data was carried out using GEOPSY, an open-source software developed during the SESAME European project. An individual window length of 20–25 s was considered for the computation of the HVSR. For processing and analysis, the stationary windows were chosen so that at least 20 windows were available. To filter out energetic transient noises (footsteps, industrial disturbances, close traffic, etc.) from ambient vibration recordings and to maintain only quasi-stationary windows, the minimum ratio of Short Time Average (STA) to Long Time Average (LTA) was set to 0.2 and the maximum ratio was set to 2 (SESAME Citation2004).
Table 1. Guidelines recommended by SESAME (Citation2004) for microtremor data acquisition.
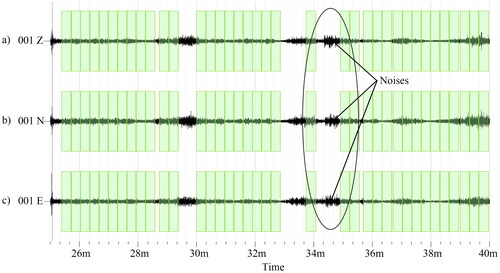
shows the velocity time history and removal of noises from all three components of the signal. Each stationary window (Each rectangular shape in ) was then analysed to obtain Fourier amplitude spectra using Fast Fourier Transformation (FFT). The obtained spectra were smoothed using the Konno–Ohmachi smoothing function with a filter coefficient b value of 40 (Konno and Ohmachi Citation1998; Cox et al. Citation2020) and tapered with a 5% cosine function. The square average/quadratic mean approach (Fäh et al. Citation2001; Bonnefoy-Claudet et al. Citation2008) was used to compute the signal’s horizontal components. The average HVSR for the specific station is the average H/V ratio of each window result. The frequency corresponding to clear HVSR peaks represents the fundamental frequency of the free field (Gallipoli et al. Citation2004; SESAME Citation2004; Gosar Citation2010; Gosar et al. Citation2010; Paudyal et al. Citation2012; Molnar et al. Citation2022).
Figure 4. Typical velocity time history graph of measured data; (a) vertical direction (UD); (b) North-South (NS) direction; (c) East-West (EW) direction.
The analysed HVSR results were subjected to reliability and clarity checks as per SESAME guidelines. Low amplitude with flat HVSR peaks, multiple HVSR peaks, and significant levels of noise lead to the failure of the SESAME's criteria. Out of 241 stations, 58 stations don’t comply with the reliability and clarity requirements and weren’t considered for the predominant frequency mapping. The frequency-based seismic microzonation map was then prepared by interpolation using the Inverse Distance Weighted (IDW) method due to its easy understandability, efficiency, and computational simplicity (Tuladhar et al. Citation2004; Paudyal et al. Citation2012; Wu and Hung Citation2016).
3.3. Measurement in buildings and analysis
The majority of structures in the study area are Reinforced Concrete (RC) buildings with two to five stories due to constraints from the National Building Code (NBC) and building byelaws of Nepal. Using a random sampling approach, a total of 20 single-standing isolated buildings varying from two to five stories, the majority of which are residential and a few institutional buildings were subjected to ambient vibration measurement. The location of the buildings considered for the microtremor measurements is shown in . The fundamental instructions and guidelines for measuring vibrations in the building were referenced from Gallipoli et al. (Citation2004), Parolai et al. (Citation2005), and Gosar (Citation2010).
shows some of the photographs of the measured buildings. The horizontal directions of the microtremor instrument were positioned with the building’s longitudinal and transverse direction (). The measurements were carried out for 5 min on the topmost and bottom floors of the buildings. To minimize the impacts of torsional frequency, the instrument was set up near the centre of mass (C.M) of the building (Al-Nimry et al. Citation2014; Stanko et al. Citation2017). The results are not usually disturbed by human noises such as walking on stairs, operating lifts, etc. (Yuen et al. Citation2002; Shrestha and Karanjit Citation2017). Nevertheless, measurement was conducted in quiet time without any disturbances.
Figure 5. Representative picture for microtremor measurements of building ID (a) B9 and (b) B12; data acquisition of the building on (c) the top floor and (d) the bottom floor of the building (B12).
The signals were analysed using a window length of 20 s with a Konno-Ohmachi smoothing window of a smoothing constant of 40 (Konno and Ohmachi Citation1998; Cox et al. Citation2020) and tapered with a 5% cosine function. Gosar et al. (Citation2010) suggested that the floor Spectral Ratio (FSR) approach is only the reliable parameter for figuring out a fundamental frequency of low-rise buildings because of free-field influence. So, the Floor Spectral Ratio (FSR), a ratio of horizontal components of the top floor and bottom floor for both longitudinal and transverse directions was computed to figure out the predominant frequency of the building.
4. Results and discussion
4.1. Determination of free field frequency
Samples of the HVSR graph with fundamental frequency are presented in . Low-frequency HVSR curves were observed in the northern part of the study area (station 2, station 95, and station 127 in ). The site’s low frequency could be the result of thick sediment deposits over the basement rock. The clear HVSR peak in station 2 and station 95 indicates a significant impedance contrast between soil deposits and the underlying bedrock (SESAME Citation2004; Molnar et al. Citation2022). The edges of the basin and some parts of the centre region in the study area constitute significantly higher frequencies with distinct HVSR curves (station 46, station 119, station 233, and station 239 in ) which might be an indication of shallow sediment deposits over the underlying bedrock. Flat HVSR curves were also observed in some locations (station 88 and station 134 in ). This might show the existence of hard soil or rocky terrain as well as the lack of a significant impedance differential between the layers. To verify the results, two borehole log data were considered as illustrated in . This verification will show the low frequency with thick sediment deposits, while rocky sites or very thin sediment deposits are associated with high fundamental frequency (D’Amico et al. Citation2004; Birgören et al. Citation2009; Paudyal et al. Citation2012). The lithological features of the borehole were classified based on the Unified Soil Classification System (USCS) adopted by the ASTM (Citation1996) as shown in . BH1 lies in the northern part (near station 95) and constitutes a 45 m thick sediment deposit over bedrock. Due to the significant impedance contrast at the boundary of two layers and thick sediment deposits (station 95 in ) exhibits a clear peak in low frequency. Similarly, BH2 constitutes of very thin layer of soil deposits above hard rock/stratum which lies in the foothill of the Suryabinayak reserve forest (basin edge). A nearly flat high-frequency HVSR curve is observed near BH2 (station 134 in ) which occurs because of very shallow sediment deposits.
Figure 6. Representative Horizontal to Vertical Spectral Ratio (HVSR) graph of microtremor measurement stations. The black line represents the average H/V spectra graph; the dotted line represents the average H/V ± standard deviation
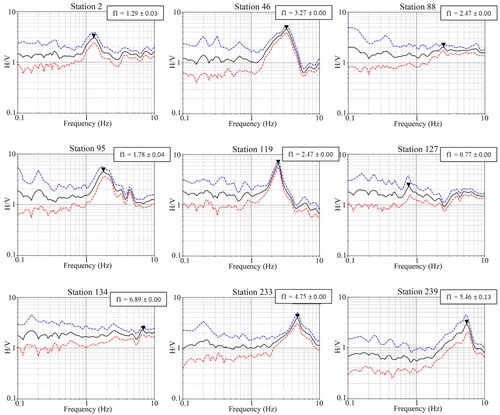
Figure 7. (a) Frequency-based microzonation map of the study area and resonance possibility of buildings with soil. B = building. (b) Stratigraphic features of Borehole BH1 and BH2. Source: modified after Kawan et al. (Citation2019).
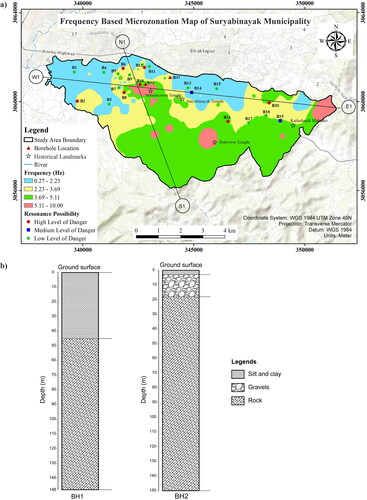
depicts the frequency-based seismic microzonation map of the study area. In accordance with the results from the study, station 184 (near Sanga) possesses a higher fundamental frequency of 10 Hz, whereas station 9 (Basidol, Gatthaghar) has a lower fundamental frequency of 0.27 Hz. The microzonation map demonstrates that the majority of the northern part of the study area, which lies in low elevation has low-frequency content, which is due to thick sediment deposits over the bedrock. The southern and basin edges at higher elevations show higher frequency which might be attributed to shallow sediment deposits over the bedrock. This suggests that changes in elevation and uneven distribution of soil deposits alter the frequency of the ground. However, it doesn’t mean that the fundamental frequency of the site with higher elevation should always be on the higher side and vice-versa. In our study, Katunje even at low elevation comprises of high frequency due to shallow deposits and exposed bedrock. Thus, the topographical features, as well as geological variations and non-uniform distribution of deposits have a considerable impact on the frequency of site. However, the topographic abnormalities together with the focusing and diffraction phenomena of seismic waves and the nature of slopes may change the fundamental frequency of site (Sanchez-Sesma Citation1987; Ashford et al. Citation1997; Falcone et al. Citation2023).
To clearly visualize the change in frequency with respect to distance, frequency-based cross-section profiles were plotted in the longitudinal and transverse directions (). displays the frequency-based cross-section profile in the transverse direction (Profile S1-N1). The profile demonstrates how the fundamental frequency of sediment deposits varies moving from the south (basin edges) to the north (basin) of the study area. The cross-section profile S1-N1 progresses through the Suryabinayak reserve forest area followed by Anantalingeswor temple (near station 239), Katunje (station 132), and ends up with the Sallaghari (station 25). The profile illustrates that the Katunje area possesses the highest frequency. The Anantalingeswor area, which is located in the basin edge (southern part) constitutes a higher frequency than that of the Sallaghari which is situated in the northern part.
Figure 8. Frequency-based cross-sectional profile along (a) S1-N1 (transverse direction) and (b) W1-E1 (longitudinal direction) of the study area.
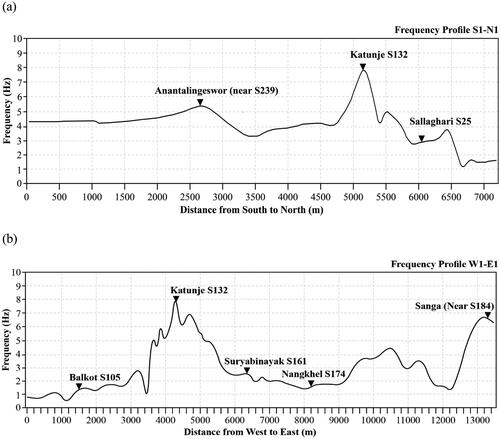
Likewise, illustrates the cross-section profile along longitudinal axes (Profile W1-E1). Profile W1-E1 crosses through the Balkot (station 105) in the west followed by Katunje (station 132), Suryabinayak temple (station 161), Nangkhel (station 174), and eventually terminates at Sanga (near station 184). This profile indicates that Sanga, which is located on the eastern outskirts of the Kathmandu basin, and Katunje, which consists of thin sediment deposits, exhibit higher frequency. While Balkot, situated in the northern part of the study area with thick sediment deposits possesses a low frequency. This suggests that low-frequency buildings might be affected in the Balkot area during seismic events, whereas high-frequency buildings (low-rise structures) might undergo resonance in the Katunje and Sanga areas. According to Paudyal et al. (Citation2012), the fundamental frequency of soil deposits in the Kathmandu basin ranges from 0.49 to 8.89 Hz. However, we found a slight increase in the frequency of deposits, which may be caused by the shallow depth of rocks, extension of the study area to basin edges, and close spacing of station points.
4.2. Determination of fundamental frequency of building
depicts the representative FSR vs. frequency graphs for both longitudinal and transverse directions. The building’s fundamental frequency (longitudinal or transverse) is considered to be the frequency at which FSR reaches its maximum value. The fundamental frequency of the buildings in the study area ranges from 2.36 Hz to 9.11 Hz. presents the results of microtremor measurements of the surveyed buildings in both the longitudinal and transverse directions. The longitudinal frequency is higher than the transverse frequency in the majority of the surveyed buildings, possibly because of the higher stiffness in the longitudinal direction. According to Al-Nimry et al. (Citation2014) and Gosar et al. (Citation2010), the multiple columns arranged along the longitudinal direction and the masonry walls strengthen the building’s lateral stiffness, which enhances the longitudinal frequency. B16 exhibits the same frequency in both directions, indicating the regular symmetry of the building.
Figure 9. Floor Spectral Ratio (FSR) vs frequency (Hz) for B6; B9; B16 and B19.
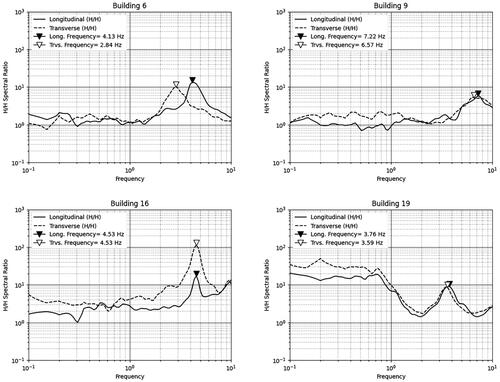
Table 2. Soil-structure resonance possibility of all measured buildings.
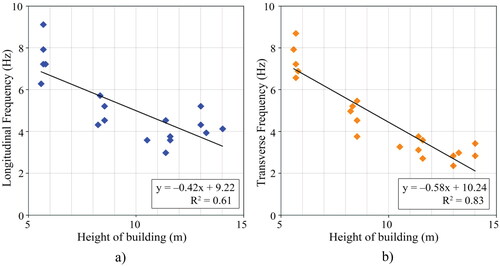
The decreasing trend of the fundamental frequency in both longitudinal and transverse directions can be observed in with a rise in building height, which is in good agreement with studies conducted by different researchers and codal provisions (such as Hong and Hwang Citation2000; Chiauzzi et al. Citation2012; Shrestha and Karanjit Citation2017). The relationship between building height and fundamental frequency was determined using a single-variable regression analysis. displays a good correlation with a coefficient of determination (R2) of 60.64% and 83.36% in longitudinal and transverse directions respectively. The acquired coefficient was compared to the findings of the study conducted by Gosar et al. (Citation2010), which indicate an almost identical value for the longitudinal direction and a significantly higher coefficient in the transverse direction which might be because of low effective stiffness.
Figure 10. Fundamental frequency and height relationship of surveyed building (a) along longitudinal direction; and (b) along transverse direction.
4.3. Soil-structure resonance
The fundamental frequency of the building was then plotted over the frequency-based microzonation map of the study area to assess the possible soil-structure resonance (). It can be inferred from the microzonation map that low-frequency structures might encounter resonance in the northern section of the study area, whereas the southern and basin edges area might see the resonance of high-frequency structures.
A potential resonance between the soil and structure is taken into account if the building’s fundamental frequency is close to the free-field frequency. Using the relationship given by Gosar et al. (Citation2010) and Stanko et al. (Citation2017), the percentage difference between the frequency of the building and the free field (F diff, FSR) was computed using EquationEquation (1)(1)
(1) .
(1)
(1)
The severity of soil structure is high if the Fdiff, FSR (%) is within 15%, medium if it is between 15% and 25%, and low if it is greater than 25% (Gosar et al. Citation2010; Stanko et al. Citation2017). lists the potential for soil-structure resonance of some of the considered buildings.
The difference between the frequency of free fields and buildings B2, B6, B8, B10, B12, B16, and B20 lies within 15%. Therefore, there is a high risk of soil-structure resonance in these buildings. Moreover, the frequency of B10 is in close proximity to that of the free field which could cause significant damage during earthquake occurrence. B10 is a two-story reinforced concrete building that is constructed over the hard rocky soil (Katunje area). The structure was just recently built and complies with the building code of Nepal. Therefore, despite the building’s high soil-structure resonance, a low grade of damage can be anticipated. B14 and B19 were assigned medium risk of soil-structure resonance as the F diff, FSR (%) is between 15 and 25%. Since the percentage difference between structure and free-field frequency is higher than 25%, the remaining structures display a relatively low degree of soil-structure resonance. Among the 20 buildings surveyed, 7 buildings have high, 2 buildings have medium and 11 buildings have low possibility of soil-structure resonance ().
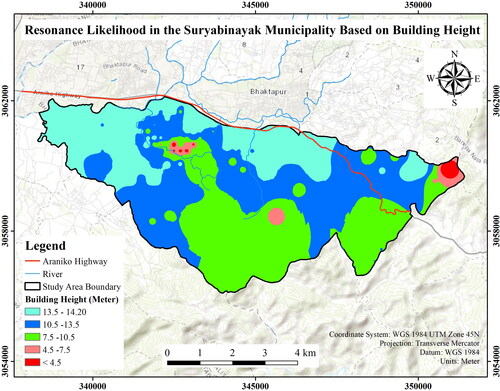
Furthermore, the resonance likelihood map based on building height was developed using the regression equation derived, as illustrated in , and the spatial frequency distribution map of . The map was categorized into five distinct zones to account for a variety of building heights. Since our study area consists of buildings with a maximum of five stories (about 14.20 m height), the equation developed in is only applicable up to five stories. Consequently, the produced map is only suitable for up to five stories. The map demonstrates that the buildings with a height of 13.5–14.20 m have a higher possibility of experiencing resonance in the major portion of the northern section. Similarly, structures with a height of less than 7.5 m are more likely to resonate in areas, where fundamental frequency is higher (Katunje and Sanga areas). The map in will be extremely beneficial in the preliminary planning and design of buildings for urban planners, architects, and engineers.
Figure 11. Soil-structure resonance possibility of Suryabinayak Municipality based on height of building.
5. Conclusions
Despite the lack of enough borehole investigations, geophysical data, and geological information, single-station microtremor measurement has shown to be an effective and efficient method for investigating the fundamental frequency of deposits and assessing soil-structure resonance possibility. The microtremor measurements were conducted in a 200 × 200 m in densely populated area and 400 × 400 m grid spacing in a sparsely populated region of the study area. The microtremor measurements were conducted at 241 station points. The frequency-based microzonation map was prepared, which shows the spatial distribution of fundamental frequency ranging from 0.27 Hz to 10 Hz. Prominent HVSR peaks were observed at the majority of stations. The study depicts relatively higher frequency in the southern part and basin edges than in the northern part of the study area. Ambient vibration measurements of 20 single-standing isolated buildings were also carried out to study the soil-structure resonance possibility and its danger level. Out of 20 buildings considered, 7 have a high possibility of soil-structure resonance, 2 have a medium possibility, and 11 have a low possibility of resonance. The resonance between soil and structure can potentially be the reason for the structural damage in the study area during future seismic events and shouldn’t be overlooked. Furthermore, the spatial distribution of resonance possibilities of Suryabinayak Municipality based on the structure’s height was developed, which might serve as a valuable tool for the initial planning and design of buildings for urban planners, architects, and engineers. Hence, the study results can provide useful insights into the spatial distribution of seismic hazards within the area, which is crucial for effective urban planning, risk assessment, and disaster mitigation strategies.
Disclosure statement
No potential conflict of interest was reported by the author(s).
Data availability statement
The data underlying this article will be shared on the reasonable request to the corresponding author.
Additional information
Funding
References
- Al-Nimry H, Resheidat M, Al-Jamal M. 2014. Ambient vibration testing of low and medium rise infilled RC frame buildings in Jordan. Soil Dyn Earthq Eng. 59:21–29. doi: 10.1016/j.soildyn.2014.01.002.
- Álvarez BI, Palma HB, Besenzon D, Vera-Grunauer X, Amoroso S. 2022. in the Guayaquil city through in situ and laboratory tests. S&R. 45(3):1–15. doi: 10.28927/SR.2022.07402.
- [ASTM] American Society for Testing and Materials. 1996. Standard practice for classification of soils for engineering purposes (unified soil classification system) 1. West Conshohocken (PA): American Society for Testing and Materials.
- Ashford SA, Sitar N, Lysmer J, Deng N. 1997. Topographic effects on the seismic response of steep slopes. Bull Seismol Soc Am. 87(3):701–709. doi: 10.1785/BSSA0870030701.
- Bazzurro P, Cornell CA. 2004. Ground-motion amplification in nonlinear soil sites with uncertain properties. Bull Seismol Soc Am. 94(6):2090–2109. doi: 10.1785/0120030215.
- Bhandary NP, Paudyal YR, Okamura M. 2021. Resonance effect on shaking of tall buildings in Kathmandu Valley during the 2015 Gorkha earthquake in Nepal. Environ Earth Sci. 80(13):1–16. doi: 10.1007/s12665-021-09754-9.
- Bijukchhen SM, Takai N, Shigefuji M, Ichiyanagi M, Sasatani T, Sugimura Y. 2017. Estimation of 1-D velocity models beneath strong-motion observation sites in the Kathmandu Valley using strong-motion records from moderate-sized earthquakes. Earth Planets Sp. 69(1):1–16. doi: 10.1186/s40623-017-0685-4.
- Birgören G, Özel O, Siyahi B. 2009. Bedrock depth mapping of the coast south of Istanbul: comparison of analytical and experimental analyses. Turkish J Earth Sci. 18(2):315–329. doi: 10.3906/yer-0712-3.
- Bonnefoy-Claudet S, Kohler A, Cornou C, Wathelet M, Bard P-Y. 2008. Effects of love waves on microtremor H/V ratio. Bull Seismol Soc Am. 98(1):288–300. doi: 10.1785/0120070063.
- censusnepal.cbs.gov.np. [accessed 2023 Nov 4]. https://censusnepal.cbs.gov.np/.
- Chapagain SK, Pandey VP, Shrestha S, Nakamura T, Kazama F. 2010. Assessment of deep groundwater quality in Kathmandu Valley using multivariate statistical techniques. Water Air Soil Pollut. 210(1-4):277–288. doi: 10.1007/s11270-009-0249-8.
- Chaulagain H, Gautam D, Rodrigues H. 2018. Revisiting major historical earthquakes in Nepal: overview of 1833, 1934, 1980, 1988, 2011, and 2015 seismic events. In: Gautam D and Rodrigues H, editors Impact and Insights of the Gorkha Earthquake. Elsevier; p. 1–17. doi: 10.1016/B978-0-12-812808-4.00001-8.
- Chiauzzi L, Masi A, Mucciarelli M, Cassidy JF. 2012. Estimate of fundamental period of reinforced concrete buildings: code provisions vs. experimental measures in Victoria and Vancouver (BC, Canada). In: 15th world conference on Earthquake Engineering 2012; Sept 24–28; Lisboa, Portugal: Sociedade Portuguesa de Engenharia Sismica (SPES).
- Cox BR, Cheng T, Vantassel JP, Manuel L. 2020. A statistical representation and frequency-domain window-rejection algorithm for single-station HVSR measurements. Geophys J Int. 221(3):2170–2183. doi: 10.1093/gji/ggaa119.
- D’Amico VERA, Picozzi M, Albarello D, Naso G, Tropenscovino S. 2004. Quick estimate of soft sediment thicknesses from ambient noise horizontal to vertical spectral ratios : a case study in southern Italy. J Earthq Eng. 8(6):895–908. doi: 10.1080/13632460409350513.
- Dangol GM. 1985. Geology of the Kathmandu fluviatile lacustrine sediments in the light of new vertebrate fossil occurrences. J Nepal Geol Soc. 3:43–57.
- Darendeli M. 2001. Development of a new family of normalized modulus reduction and material damping curves. USA: The University of Texas at Austin.
- Fäh D, Kind F, Giardini D. 2001. A theoretical investigation of average HIV ratios. Geophys J Int. 145(2):535–549. doi: 10.1046/j.0956-540x.2001.01406.x.
- Falcone G, Elia G, di Lernia A. 2023. Investigating the influence of a pre-existing shear band on the seismic response of ideal step-like slopes subjected to weak motions: preliminary results. Geosciences. 13(5):148. doi: 10.3390/geosciences13050148.
- Fayjaloun R, Negulescu C, Roullé A, Auclair S, Gehl P, Faravelli M. 2021. Sensitivity of earthquake damage estimation to the input data (soil characterization maps and building exposure): case study in the Luchon Valley, France. Geosciences. 11(6):249. doi: 10.3390/geosciences11060249.
- Field E, Jacob K. 1993. The theoretical response of sedimentary layers to ambient seismic noise. Geophys Res Lett. 20(24):2925–2928. doi: 10.1029/93GL03054.
- Gallipoli MR, Calamita G, Tragni N, Pisapia D, Lupo M, Mucciarelli M, Stabile TA, Perrone A, Amato L, Izzi F, et al. 2020. Evaluation of soil-building resonance effect in the urban area of the city of Matera (Italy). Eng Geol. 272:105645. doi: 10.1016/j.enggeo.2020.105645.
- Gallipoli MR, Mucciarelli M, Castro RR, Monachesi G, Contri P. 2004. Structure, soil-structure response and effects of damage based on observations of horizontal-to-vertical spectral ratios of microtremors. Soil Dyn Earthq Eng. 24(6):487–495. doi: 10.1016/j.soildyn.2003.11.009.
- Geli L, Bard PY, Jullien B. 1988. The effect of topography on earthquake ground motion: a review and new results. Bull Seismol Soc Am. 78(1):42–63. doi: 10.1785/BSSA0780010042.
- Goda K, Kiyota T, Pokhrel RM, Chiaro G, Katagiri T, Sharma K, Wilkinson S. 2015. The 2015 Gorkha Nepal earthquake: insights from earthquake damage survey. Front Built Environ. 1:1–15. doi: 10.3389/fbuil.2015.00008.
- Gosar A. 2010. Site effects and soil-structure resonance study in the Kobarid basin (NW Slovenia) using microtremors. Nat Hazards Earth Syst Sci. 10(4):761–772. doi: 10.5194/nhess-10-761-2010.
- Gosar A, Rošer J, Motnikar BŠ, Zupančič P. 2010. Microtremor study of site effects and soil-structure resonance in the city of Ljubljana (central Slovenia). Bull Earthquake Eng. 8(3):571–592. doi: 10.1007/s10518-009-9113-x.
- Herak M. 2011. Overview of recent ambient noise measurements in Croatia in free-field and in buildings. Geofizika. 28(1):21–40.
- Hong L, Hwang W. 2000. Empirical formula for fundamental vibration periods of reinforced concrete buildings in Taiwan. Earthquake Eng Struct Dyn. 29(3):327–337. doi: 10.1002/(SICI)1096-9845(200003)29:3<327::AID-EQE907>3.0.CO;2-0.
- Hough SE, Bilham R. 2008. Site response of the Ganges basin inferred from re-evaluated macroseismic observations from the 1897 Shillong, 1905 Kangra, and 1934 Nepal earthquakes. J Earth Syst Sci. 117(S2):773–782. doi: 10.1007/s12040-008-0068-0.
- Kanai K, Tanaka T. 1961. On microtremors. VIII. Bull Earthq Res Inst. 39:97–114.
- Kawan CK, Maskey PN, Motra G. 2019. Spatial variation of silt and clay sediment deposit in Bhaktapur city. J Sci Eng. 7:34–43. doi: 10.3126/jsce.v7i0.26788.
- Kawan CK, Maskey PN, Motra GB. 2022. A study of local soil effect on the earthquake ground motion in Bhaktapur City, Nepal using equivalent linear and non-linear analysis. Iran J Sci Technol Trans Civ Eng. 46(6):4481–4498. doi: 10.1007/s40996-022-00858-1.
- Khanal A, Dahal RK, Bijukchhen SM. 2023. A study of soil characteristics using ambient vibration measurement at Hetauda, Bagmati Province, Central Nepal. In: XIV IAEG Congress 2023; Sept 21–27.Chengdu, China; IAEG China National Group; p. 205.
- Kim HS, Sun CG, Cho HI. 2018. Geospatial assessment of the post-earthquake hazard of the 2017 Pohang earthquake considering seismic site effects. IJGI. 7(9):375. doi: 10.3390/ijgi7090375.
- Konno K, Ohmachi T. 1998. Ground-motion characteristics estimated from spectral ratio between horizontal and vertical components of microtremor. Bull Seismol Soc Am. 88(1):228–241. doi: 10.1785/BSSA0880010228.
- Kramer SL. 1996. Geotechnical earthquake engineering. Hall WJ, editor. Upper saddle River, NJ: Prentice-Hall International Series in Civil Engineering and Engineering Mechanics.
- Kumar N, Narayan JP. 2018. Quantification of site-city interaction effects on the response of structure under double resonance condition. Geophys J Int. 212(1):422–441. doi: 10.1093/gji/ggx397.
- Lermo J, Chávez-García FJ. 1994a. Are microtremors useful in site response evaluation? Bull - Seismol Soc Am. 84(5):1350–1364. doi: 10.1016/0148-9062(95)93340-u.
- Lermo J, Chávez-García FJ. 1994b. Site-Effect-Evaluation-at-Mexico-City: dominant period and relative amplification from strong motion and microtremor records. Soil Dyn Earthq Eng. 13(6):413–423. doi: 10.1016/0267-7261(94)90012-4.
- Magaro F. 2016. Environmental and building seismic risk: HVSR analysis and technique—Theoretical aspects and environmental aspects. Italy: University of calabria.
- Mahmood K, Khan SA, Iqbal Q, Karim F, Iqbal S. 2020. Equivalent linear and nonlinear site-specific ground response analysis of Pashto Cultural Museum Peshawar, Pakistan. Iran J Sci Technol Trans Civ Eng. 44(S1):179–191. doi: 10.1007/s40996-020-00346-4.
- Manne A, Satyam ND. 2013. Estimation of local site effects using microtremor testing in Vijayawada City, India. Geotech Lett. 3(4):173–179. doi: 10.1680/geolett.13.00033.
- Mayoral JM, Asimaki D, Tepalcapa S, Wood C, Roman-de la Sancha A, Hutchinson T, Franke K, Montalva G. 2019. Site effects in Mexico City basin: past and present. Soil Dyn Earthq Eng. 121(February):369–382. doi: 10.1016/j.soildyn.2019.02.028.
- McGowan SM, Jaiswal KS, Wald DJ. 2016. Using structural damage statistics to derive macroseismic intensity within the Kathmandu valley for the 2015 M7.8 Gorkha, Nepal earthquake. Tectonophysics. 714-715:158–172. doi: 10.1016/j.tecto.2016.08.002.
- [MoHA] Ministry of Home Affairs. 2015. Nepal disaster report 2015. Kathmandu: Ministry of Home Affairs.
- Molnar S, Sirohey A, Assaf J, Bard P-Y, Castellaro S, Cornou C, Cox B, Guillier B, Hassani B, Kawase H, et al. 2022. A review of the microtremor horizontal-to-vertical spectral ratio (MHVSR) method. J Seismol. 26(4):653–685. doi: 10.1007/s10950-021-10062-9.
- Mori F, Mendicelli A, Falcone G, Acunzo G, Spacagna RL, Naso G, Moscatelli M. 2022. Ground motion prediction maps using seismic-microzonation data and machine learning. Nat Hazards Earth Syst Sci. 22(3):947–966. doi: 10.5194/nhess-22-947-2022.
- Nakamura Y. 1989. A method for dynamic characteristics estimation of subsurface using microtremor on the ground surface. Railw Tech Res Inst Q Rep. 30(1):25–33.
- Nakamura Y. 1997. Seismic vulnerability indices for ground and structures using microtremor. In: World Congress on Railway Research. p. 1–7. Florence, Italy: WCRR.
- Nogoshi M, Igarashi T. 1971. On the amplitude characteristics of ambient noise (part 2). J Atmos Ocean Technol. 24(1):26–40.
- Ohsumi T, Mukai Y, Fujitani H. 2016. Investigation of damage in and around Kathmandu Valley related to the 2015 Gorkha, Nepal Earthquake and beyond. Geotech Geol Eng. 34(4):1223–1245. doi: 10.1007/s10706-016-0023-9.
- Okada H. 2003. The microtremor survey method. USA: Society of exploration geophysicists with the cooperation of Society of exploration geophysicists of Japan and Australian society of exploration geophysicists. doi: 10.1190/1.9781560801740.fm.
- Osorio L, Mayoral JM. 2013. Seismic microzonation for the northeast Texcoco lake area, Mexico. Soil Dyn Earthq Eng. 48:252–266. doi: 10.1016/j.soildyn.2013.01.013.
- Öziçer S, Uyanik O, Timur E. 2017. Investigation of period and resonance risk of buildings with various heights using microtremor method. In: 9th Congress of the Balkan Geophysical Society BGS 2017; Nov 5–9; Antalya, Turkey. The Netherlands: European Association of Geoscientists and Engineers (EAGE). doi: 10.3997/2214-4609.201702586.
- Pandey MR, Molnar P. 1988. The distribution of intensity of Bihar-Nepal Earthquake of 15 January 1934 and bounds on the extent of the rupture zone. J Nepal Geol Soc. 5(1):22–24.
- Parolai S, Fäcke A, Richwalski SM, Stempniwski L. 2005. Assessing the vibrational frequencies of the Holweide Hospital in the City of Cologne (Germany) by means of ambient seismic noise analysis and FE modelling. Nat Hazards. 34(2):217–230. doi: 10.1007/s11069-004-0686-z.
- Paudel MR, Sakai H. 1970. Stratigraphy and depositional environments of basin-fill sediments in southern Kathmandu Valley, Central Nepal. Bull Dept Geol. 11:61–70. doi: 10.3126/bdg.v11i0.1544.
- Paudyal YR, Bhandary NP, Yatabe R. 2012. Seismic microzonation of densely populated area of Kathmandu Valley of Nepal using microtremor observations. J Earthq Eng. 16(8):1208–1229. doi: 10.1080/13632469.2012.693242.
- Paudyal YR, Yatabe R, Bhandary NP, Dahal RK. 2012. Basement topography of the Kathmandu Basin using microtremor observation. J Asian Earth Sci. 62:627–637. doi: 10.1016/j.jseaes.2012.11.011.
- Pegah E, Liu H. 2016. Application of near-surface seismic refraction tomography and multichannel analysis of surface waves for geotechnical site characterizations: a case study. Eng Geol. 208:100–113. doi: 10.1016/j.enggeo.2016.04.021.
- Rana JB. 1935. Nepal ko Maha Bhukampa (Great earthquake of Nepal). Kathmandu: Jorganesh Press.
- Rizzitano S, Cascone E, Biondi G. 2014. Coupling of topographic and stratigraphic effects on seismic response of slopes through 2D linear and equivalent linear analyses. Soil Dyn Earthq Eng. 67:66–84. doi: 10.1016/j.soildyn.2014.09.003.
- Rochman JPGN, Sadewa MA, Putra AM. 2023. Earthquake microzonation using microtremor analysis and horizontal to vertical spectral ratio method study case at Ampelgading and Tirtoyudo Sub-district, Malang, East Java. In: Susanti E, Juhari J, Nafie Jauhari M, editors. Proceedings of the 12th International Conference on Green Technology (ICGT 2022); Malang, Indonesia; Oct 26–27. Atlantic press; p. 127–136. doi: 10.2991/978-94-6463-148-7_14.
- Sabetta F, Fiorentino G, Bocchi F, Sinibaldi M, Falcone G, Mendicelli A. 2023. Influence of local site effects on seismic risk maps and ranking of Italian municipalities. Bull Earthquake Eng. 21(5):2441–2468. doi: 10.1007/s10518-023-01619-9.
- Sakai H. 2001. Stratigraphic division and sedimentary facies of the Kathmandu Basin Group, Central Nepal. J Nepal Geol Soc. 25:19–32.
- Sakai H, Fujii R, Kuwahara Y. 2002. Changes in the depositional system of the Paleo-Kathmandu Lake caused by uplift of the Nepal Lesser Himalayas. J Asian Earth Sci. 20(3):267–276. doi: 10.1016/S1367-9120(01)00046-3.
- Sanchez-Sesma FJ. 1987. Seismic response of topographies and alluvial basins. Soil Dyn Earthq Eng. 6(2):124–132. doi: 10.1016/0267-7261(87)90022-4.
- Satyam ND, Towhata I. 2016. Site-specific ground response analysis and liquefaction assessment of Vijayawada City (India). Nat Hazards. 81(2):705–724. doi: 10.1007/s11069-016-2166-7.
- SESAME. 2004. Guidelines for the implementation of the H/V spectral ratio technique on ambient vibrations measurements, processing and interpretation. [place unknown]: European Commission -Research General Directorate.
- Sextos A, De Risi R, Pagliaroli A, Foti S, Passeri F, Ausilio E, Cairo R, Capatti MC, Chiabrando F, Chiaradonna A, et al. 2018. Local site effects and incremental damage of buildings during the 2016 Central Italy Earthquake sequence. Earthq Spectra. 34(4):1639–1669. doi: 10.1193/100317EQS194M.
- Shakya M, Kawan CK. 2016. Reconnaissance based damage survey of buildings in Kathmandu Valley: an aftermath of 7.8Mw, 25 April 2015 Gorkha (Nepal) earthquake. Eng Fail Anal. 59(April):161–184. doi: 10.1016/j.engfailanal.2015.10.003.
- Sharma K, Subedi M, Parajuli RR, Pokharel B. 2017. Effects of surface geology and topography on the damage severity during the 2015 Nepal Gorkha earthquake. Lowl Technol Int. 18(4):269–282.
- Shrestha OM, Koirala A, Hanisch J, Busch K, Kerntke M, Jäger S. 1999. A geo-environmental map for the sustainable development of the Kathmandu Valley, Nepal. GeoJournal. 49(2):165–172. doi: 10.1023/A:1007076813975.
- Shrestha OM, Koirala A, Karmacharya SL, Pradhananga UB, Pradhan PM, Karmacharya R. 1998. Engineering and environmental geological map of the Kathmandu Valley, scale 1:50,000. Kathmandu: Department of Mines and Geology.
- Shrestha R, Karanjit S. 2017. Comparative study on the fundamental time period of RC buildings based on codal provision and ambient vibration test – a case study of Kathmandu Valley. J Sci Eng. 4:31–37. doi: 10.3126/jsce.v4i0.22378.
- Stanko D, Markušić S, Gazdek M, Sanković V, Slukan I, Ivančić I. 2019. Assessment of the seismic site amplification in the city of Ivanec (NW part of Croatia) using the microtremor HVSR method and equivalent-linear site response analysis. Geosciences. 9(7):312. doi: 10.3390/geosciences9070312.
- Stanko D, Markušić S, Strelec S, Gazdek M. 2017. HVSR analysis of seismic site effects and soil-structure resonance in Varaždin city (North Croatia). Soil Dyn Earthq Eng. 92:666–677. doi: 10.1016/j.soildyn.2016.10.022.
- Tragni N, Calamita G, Lastilla L, Belloni V, Ravanelli R, Lupo M, Salvia V, Gallipoli MR. 2021. Sharing soil and building geophysical data for seismic characterization of cities using Clara Webgis: A case study of Matera (southern Italy). Appl Sci. 11(9):4254. doi: 10.3390/app11094254.
- Tuladhar R, Yamazaki F, Warnitchai P, Saita J. 2004. Seismic microzonation of the greater Bangkok area using microtremor observations. Earthq Eng Struct Dyn. 33(2):211–225. doi: 10.1002/eqe.345.
- Vacca V, Occhipinti G, Mori F, Spina D. 2022. The use of SMAV model for computing fragility curves. Buildings. 12(8):1213. doi: 10.3390/buildings12081213.
- Wu Y-H, Hung M-C. 2016. Comparison of spatial interpolation techniques using visualization and quantitative assessment. In: Hung M, editor. Application of spatial statistics.Intechopen; pp.17–34 doi: 10.5772/65996.
- www.theremino. 2023. [accessed 2023 Nov 24]. [Internet]. https://www.theremino.com/en/downloads/geology.
- Yoshida M, Gautam P. 1988. Magnetostratigraphy of Plio Pleistocene lacustrine deposits in the Kathmandu Valley, Central Nepal. Proc Indian Natl Sci Acad. 54(3):410–417.
- Yuen KV, Beck JL, Katafygiotis LS. 2002. Probabilistic approach for modal identification using non-stationary noisy response measurements only. Earthq Eng Struct Dyn. 31(4):1007–1023. doi: 10.1002/eqe.135.