
 ?Mathematical formulae have been encoded as MathML and are displayed in this HTML version using MathJax in order to improve their display. Uncheck the box to turn MathJax off. This feature requires Javascript. Click on a formula to zoom.
Abstract
Frequent floods caused by monsoons and rainstorms have significantly affected the resilience of human and natural ecosystems in the Nam Ngum River Basin, Lao PDR. A cost-efficient framework integrating advanced remote sensing and machine learning techniques is proposed to address this issue by enhancing flood susceptibility understanding and informed decision-making. This study utilizes remote sensing geo-datasets and machine learning algorithms (Random Forest, Support Vector Machine, Artificial Neural Networks, and Long Short-Term Memory) to generate comprehensive flood susceptibility maps. The results highlight Random Forest’s superior performance, achieving the highest train and test Area Under the Curve of Receiver Operating Characteristic (AUROC) (1.00 and 0.993), accuracy (0.957), F1-score (0.962), and kappa value (0.914), with the lowest mean squared error (0.207) and Root Mean Squared Error (0.043). Vulnerability is particularly pronounced in low-elevation and low-slope southern downstream areas (Central part of Lao PDR). The results reveal that 36%–53% of the basin’s total area is highly susceptible to flooding, emphasizing the dire need for coordinated floodplain management strategies. This research uses freely accessible remote sensing data, addresses data scarcity in flood studies, and provides valuable insights for disaster risk management and sustainable planning in Lao PDR.
Graphical Abstract
1. Introduction
A flood is a remarkable high-water flow that overflows the banks of a river, causing water to spread to the floodplain due to severe rains (Cirella and Iyalomhe Citation2018). Flood is a major devastating natural disaster regarding the number of people affected and economic loss (Di Baldassarre et al. Citation2010; FitzGerald et al. Citation2010; Rappaport Citation2014; Khalil and Khan Citation2017; Morrison et al. Citation2018). Large and damaging floods are increasingly occurring every year around the world (Kundzewicz et al. Citation2014), particularly in low-economy countries (Li et al. Citation2012; Imamura Citation2022). For example, Lao PDR has faced several devastating floods, notably in 2009, 2011, 2013, 2018, and 2019. These disasters have significantly impacted the country’s socio-economic development. In 2018, flood damages amounted to about 2.1% of the nation’s GDP, equivalent to around US$ 371 million (UN et al. Citation2018; Government of Lao PDR and Asian Development Bank Citation2022). The country experiences damage from natural disasters every year, with floods in the plains and frequent landslides in hilly areas. These incidents endanger people’s lives and property and significantly impact the economy and agriculture sectors.
The Nam Ngum River Basin (NNRB) in Laos, a key food source and home to the country’s oldest hydropower station, faces recurring floods and droughts due to climate change, human interventions, and unpredictable monsoon rainfalls (Wei et al. Citation2020). Despite numerous reservoirs for flood protection, the area still suffers significant agricultural and infrastructural damage, leading to high economic losses (Keophila et al. Citation2019; Kimmany et al. Citation2020). Vientiane province, the major part of NNRB, experiences flooding in most of its districts. For example, the August 2018 flooding affected five out of nine districts, with more than 16,000 people and thousands of hectares of farmland affected (https://vientiantimes.org.la). Likewise, the 2023 flooding affected ten provinces in Laos, including Xienkhoung, Saysomboun, and Vientiane provinces of NNRB. This flooding caused substantial damage to the agricultural area and infrastructures, such as roads, irrigation plants, hospitals, and schools; the single event took away six lives and affected around 69,000 people in 14,000 families. Similarly, in 2022, Tropical Storm Mulan also affected this area (https://reliefweb.int/country/lao). These examples signify the importance of NNRB's flood susceptibility mapping. For proper disaster management, baseline data for hazards, exposures, and vulnerabilities are crucial. In the case of Lao PDR, the availability of data and information at the sub-national level hinders disaster management (UNDRR Citation2019). Accurate flood susceptibility prediction is crucial for effective floodplain management and socio-economic development (Fang et al. Citation2021).
Flood susceptibility is the likelihood of future floods due to various factors (Nguyen Citation2022; Sharir and Roslee Citation2022). Flood susceptibility modeling involves various methods, including physical, statistical, multi-criteria decision-making (MCDM), and machine learning approaches (Mehravar et al. Citation2023). MCDM techniques, while useful, can face challenges, such as uncertainty and potential bias (Broekhuizen et al. Citation2015). Statistical methods evaluate the correlation between floods and their causes (Poudyal et al. Citation2010; Ozdemir and Altural Citation2013; Arabameri et al. Citation2019; Natarajan et al. Citation2021; Ramesh and Iqbal Citation2022; Sharir and Roslee Citation2022), but their effectiveness can be limited by the scale of datasets and the complex nature of flood occurrences (Liu et al. Citation2023). Hydrologic models like HEC-HMS and HEC-RAS are excellent for simulating flood scenarios (Zeleňáková et al. Citation2019), but they require accurate data and deep hydrology knowledge (Costache and Tien Bui Citation2019). Machine learning models, including Artificial Neural Networks (ANN) (Andaryani et al. Citation2021; Priscillia et al. Citation2021; Ighile et al. Citation2022), Support Vector Machine (SVM) (Tehrany, Pradhan, Mansor, et al. Citation2015; Tehrany, Jones, et al. Citation2019; Costache et al. Citation2020; Liu et al. Citation2022; Duwal et al. Citation2023), Decision Trees (Khosravi et al. Citation2018), K-nearest neighbors (Al-Aizari et al. Citation2022), Naïve Bayes (Hasanuzzaman et al. Citation2022), Adaptive Neuro-Fuzzy Inference Systems (Wang et al. Citation2019), and decision tree–based models like random forest (Shafizadeh-Moghadam et al. Citation2018; Hasanuzzaman et al. Citation2022; Kulithalai and Kundapura Citation2023; Razavi-Termeh, Sadeghi-Niaraki, et al. Citation2023), CatBoost, LightGBM (Saber et al. Citation2022; Kulithalai and Kundapura Citation2023), Extreme Gradient Boosting (Ma et al. Citation2021; Mirzaei et al. Citation2021; Hasanuzzaman et al. Citation2022; Razavi-Termeh, Seo, et al. Citation2023), and gradient boosting machines (Felix and Sasipraba Citation2019; Saravanan et al. Citation2023), have been introduced to analyze large complex datasets for flood susceptibility investigation efficiently. The availability of numerous satellite-based remote sensing data has enhanced flood susceptibility modeling to a new level, however, the issues related to clouds during the flooding events hindered the rapid and accurate floodwater mapping (Shahabi et al. Citation2020; Chen et al. Citation2021). This issue is largely solved with the development of synthetic aperture radar (SAR) images (Hansana et al. Citation2023). The pre-and post-flood Sentinel-1 SAR images for water detection paved the path for simple and efficient water detection for flood mapping (Shahabi et al. Citation2020; Elkhrachy et al. Citation2021). The availability of historical flood data, such as the Colorado Flood Observatory and the LAO Knowledge for Development (K4D), adds ease to flood inventory preparation. This study uses machine learning, including ANN, SVM, LSTM, and RF, for flood susceptibility mapping in Laos. A review of flood studies in Lao PDR reveals a scarcity of machine learning applications in flood susceptibility mapping for river basins. Previous research by (Keophila et al. Citation2019; Phrakonkham et al. Citation2019; Du et al. Citation2020; Hansana et al. Citation2023) primarily employed methods like AHP, hydrological modeling, and flash flood potential indices. To address this gap, this study proposes a simple and efficient data-driven machine-learning approach based on remote sensing data for effective flood susceptibility mapping in the NNRB. The findings of this study aid in informed decision-making for flood management and urban development. It aligns with the National Strategy on Disaster Risk Reduction (NSDRR) 2021–2030 (Government of Lao PDR and Asian Development Bank 2022), Sendai Framework for Disaster Risk Reduction, and sustainable development goals (SDGs-11 –sustainable cities and communities, and SDG-13 Climate change), aiming to address climate change and ensure safety in flood-prone areas.
2. Study area
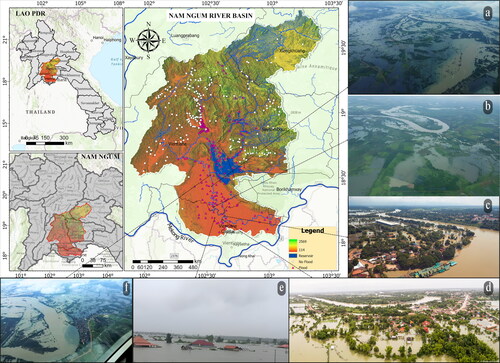
Lao PDR, situated in Southeast Asia, is rich in water resources, with the Mekong River Basin covering 90% of its territory. The Nam Ngum River, a key watercourse, extends about 420 km from the Xiengkhouang plateau to the Vientiane Plain (Meema et al. Citation2021). The NNRB, the country’s fourth-largest basin, spans 16,800 km2 and is located between longitudes 102° 25′ E and 103° 30′ E and latitudes 18° 30′ N and 19° 30′ N (Meema et al. Citation2021; Dhungana et al. Citation2023; Adams et al. 2018). It is characterized by hilly terrain with elevations ranging from 2569 to 114 masl at the Mekong River confluence (). The basin, which includes 19 districts across six provinces, contributes 4% to the Mekong’s mean annual flow. It has a tropical climate with clear wet and dry seasons, influenced by East Asian and Indian monsoons. From June to October, the rainy season sees heavy rainfall of 1500 to 3000 mm annually, exacerbated by Southwest monsoons and Pacific Ocean typhoons causing floods almost every year (Bartlett et al. Citation2012; Meema et al. Citation2021; Dhungana et al. Citation2023).
Figure 1. The location of the Nam Ngum River Basin and photographs of flooded areas; (a,f) Thalat, (b) Tanpiao, (c) Thangon riverside, (d) Thangon, (e) Thasavang (Sources: a and f. photo credit: pilot bountem souphamixay, b. photo credit: pilot cap vanh mahayo, c. www.muan.sanook.com, d. www.vientianetimes.org.la, e. Photo credit: Ly vannaly).
3. Methodology
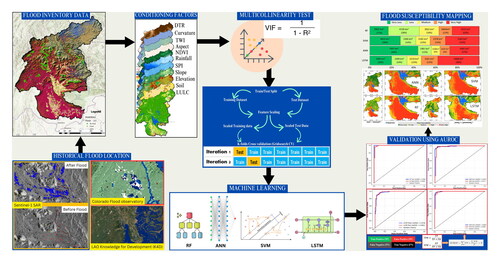
The proposed methodology comprises (a) preparation of flood inventory, (b) preparation of flood conditioning factors, (c) Selection of the suitable conditioning factors using multicollinearity test, (d) flood susceptibility modeling using machine learning approaches, (e) comparison and validation of the approaches, and (f) flood susceptibility mapping. The detailed methodological framework is shown in .
Figure 2. The methodology involved in the flood susceptibility modeling.
3.1. Data collection and preparation
The flood susceptibility mapping was initiated from data collection. One of the study’s main objectives was to use open-source remote sensing data for flood susceptibility mapping. Since data scarcity is the major hindrance in developing countries like Lao PDR, publically available satellite-based remote sensing data are vital (Saha et al. Citation2021). Historical flood records were collected from online news portals for the tentative location of the flooded areas. Likewise, sentinel-1 SAR images were analyzed in the Google Earth Engine for flood area detection. These data, along with the information from the Knowledge for Development (K4D) (https://apps.k4d.la/explorer) online portal (for years 2018, 2019, and 2020) and the historical flooded area (from 1985 to 2010) from Colorado Flood Observatory (https://floodobservatory.colorado.edu) were initially analyzed to locate flooded areas. For further processing, we acquired ALOS-PALSAR DEM (https://asf.alaska.edu/) to prepare conditioning factors. We extracted factors, such as slope, aspect, elevation, curvature, TWI, and SPI from ALOS-PALSAR DEM. The average rainfall data from 2010 to 2020 were acquired from ERA5 (https://cds.climate.copernicus.eu/), while NDVI was derived from Landsat 8 images (https://earthexplorer.usgs.gov/) using the Google Earth Engine. Land use/landcover(LULC) data were obtained from 10 m Sentinel 2 images ().
3.2. Preparation of flood inventory data
Flood inventory is the foremost and essential step in flood susceptibility modeling (Khosravi et al. Citation2018; Ahmed et al. Citation2022; Hansana et al. Citation2023). The historically flooded areas were used to prepare the flood inventory. To locate the flood points, random points were generated in the flooded area detected using Sentinel-1 SAR images in the Google Earth Engine. Sentinel-1 SAR satellite data of 10 m resolution excels in capturing images regardless of time and weather (Twele et al. Citation2016; Martinis et al. Citation2018; Hamidi et al. Citation2023). We used Level 1 GRD data in IW Swath mode (), which has a 250 km swath width (Nagler et al. Citation2015; Askar et al. Citation2022). After visual inspection of the generated flood points and assessment of the change in accuracy of the modeling results, we selected only 390 past flood points. The non-flood locations were selected visually, where the probability of flooding is none—for example, the hilltops and ridges of the mountains. Equal numbers of flood and non-flood locations were used for the inventory for increased accuracy, as suggested by (Buitinck et al. Citation2013; Tang et al. Citation2020; Towfiqul Islam et al. Citation2021). Values of 1 as flood and 0 as non-flood points were assigned for model training and testing, using 70% of the data for training and 30% for testing.
Table 1. Description of Sentinel-1 data.
3.3. Flood conditioning factors
The flood conditioning factors are crucial in mapping flood susceptibility (Mojaddadi et al. Citation2017). Identification of the factors that play a vital role in flood susceptibility mapping. However, the selection of appropriate conditioning factors depends on the nature of the particular region (Amiri et al. Citation2024). Eleven flood conditioning including elevation, slope, aspect, curvature, topographic wetness index (TWI), stream power index (SPI), distance to the river (DTR), normalized difference vegetation index (NDVI), land use/land cover (LULC), rainfall, and soil type were selected based on literature (Shafizadeh-Moghadam et al. Citation2018; Janizadeh et al. Citation2019; Khosravi et al. Citation2019; Dodangeh et al. Citation2020). Parameters like slope, curvature, aspect, DTR, drainage density, SPI, and TWI were derived from the ALOS-PALSAR DEM of 12.5 m resolution, and other data were acquired from different sources, as shown in . The spatial and temporal resolution of the conditioning factors affects the precision of the underlying results (Saha et al. Citation2021). However, the study by Avand et al. (Citation2022) states that spatial resolution alone does not affect the model’s prediction significantly, but the type of model and local condition are affected remarkably. For this study, we focused on the publically available data with better spatial and temporal resolution for the analysis. Since most of the conditioning factors are derived from DEM data, other conditioning factors were resampled to the resolution of the DEM data, i.e. 12.5 m, to obtain the final results. The conditioning factors were reclassified to create class data. Based on previous studies (Chapi et al. Citation2017; Tien Bui et al. Citation2018; Shahabi et al. Citation2020; Duwal et al. Citation2023) the natural break was used to reclassify elevation, slope, aspect, and rainfall. NDVI. TWI, SPI, and DTR were reclassified using quantile division, and LULC, soil, and curvature were reclassified manually.
Table 2. Description of data used in the study.
3.3.1. Description of conditioning factors
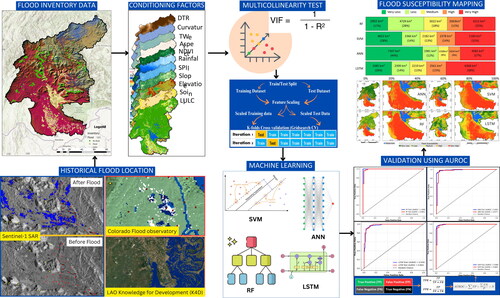
Low-lying areas, subject to rapid drainage from high to low elevations, are particularly vulnerable to flooding (Choubin et al. Citation2019). Similarly, the gradient of the slope significantly impacts flood risk (Khosravi et al. Citation2016), with lower gradients posing challenges for effective drainage after flooding (Tien Bui et al. Citation2018). Aspect, representing the orientations of the slope (Shafizadeh-Moghadam et al. Citation2018), affects soil moisture and weather conditions, influencing flood susceptibility (Rahmati et al. Citation2016). SPI quantifies flow erosion power and runoff density (Florinsky Citation2017). Curvature, indicating surface shape, identifies regions prone to flooding (Tehrany, Pradhan, Mansor, et al. Citation2015; Khosravi et al. Citation2019), with negative values signifying convexity, positive values indicating concavity, and zero indicating flatness (Youssef et al. Citation2016). Elevated TWI values highlight areas prone to inundation (Sørensen et al. Citation2006; Chen and Yu Citation2011). NDVI values represent vegetation vitality, with higher values indicative of denser vegetation cover (Askar et al. Citation2022), which is inversely related to flood susceptibility (Kumar and Acharya Citation2016). Rainfall is a primary driver of flooding (Tehrany, Jones, et al. Citation2019), The rainfall depth, intensity, and frequency majorly determine flooding. Annual average rainfall data was mapped using ERA5 data from 2010 to 2020. DTR influences flood probabilities, with closer proximity increasing the likelihood (Shahabi et al. Citation2020). Soil type affects water absorption and accumulation during floods (Rahmati et al. Citation2016), while LULC delineates areas at risk (Khosravi et al. Citation2016), vegetated areas increase travel time and slow the runoff, and bare lands and built-up areas facilitate the flow ().
Figure 3. Flood conditioning factors.
3.4. Selection and evaluation of factors based on multicollinearity test and information gain ratio
In this study, we first identified correlations in the data using a multicollinearity test (Alin Citation2010). A high correlation between independent variables can lead to errors in machine learning models and affect the accuracy of the final flood susceptibility map. We used the variance inflation factor (VIF) and tolerance values to detect and eliminate multicollinearity. Factors indicating multicollinearity (tolerance <0.10 and VIF >10) (Arabameri et al. Citation2019; Baig et al. Citation2022; Mehravar et al. Citation2023) should be removed. The VIF is calculated using EquationEquation (1)(1)
(1) as
(1)
(1)
where
is the coefficient of determination obtained by regressing the factor
on all other factors in the analysis (Miles Citation2014).
The Information Gain Ratio (IGR) (Ghorbanzadeh et al. Citation2019; Talukdar et al. Citation2020; Towfiqul Islam et al. Citation2021) test, a widely used feature selection technique, evaluates the significance of factors in flood events. A higher IGR value indicates a more decisive influence of the factor on the target variable (Al-Abadi Citation2018; Saber et al. Citation2023; Bhattarai et al. Citation2024).
3.5. Machine learning methods
3.5.1. Support vector machine (SVM)
SVM is widely used in flood susceptibility mapping (Tehrany, Pradhan, Mansor, et al. 2015; Tehrany, Jones, et al. Citation2019; Nachappa et al. Citation2020). SVM is a supervised learning technique for classification, regression, and outlier detection (Tehrany et al. Citation2014). The SVM model relies on a kernel linear mathematical function for data transformation and determination (Arabameri et al. Citation2022). It aims to find the optimal hyperplane that separates a dataset into two classes (Choubin et al. Citation2019).
3.5.2. Random forest (RF)
The RF method, an ensemble of decision trees, is used in classification and regression tasks. Its ability to deliver superior classification results and processing speed has garnered increasing attention in recent studies (Talukdar et al. Citation2020; Dabija et al. Citation2021; Bhattarai et al. Citation2024). During prediction, a random set of features is selected at each step, and each outcome is weighted by the value derived from the votes it receives. The final categorization decision tree is determined by the majority vote based on the results of the evaluated decision trees. In flood susceptibility mapping, RF is recognized as a significant non-parametric ensemble learning approach (Ghorbanzadeh et al. Citation2019; Towfiqul Islam et al. Citation2021).
3.5.3. Artificial neural network (ANN)
ANN models mimic the interconnected structure of a biological brain, responding to sensory inputs. ANN consists of artificial neurons or nodes organized in layers. The input layer connects to a hidden layer, with assigned weights for each connection. The output emerges from the hidden layer, influenced by these weights. Researchers favor ANN due to its nonlinear modeling capabilities and adaptability to complex frameworks (Priscillia et al. Citation2021). It is commonly used to analyze and predict natural disasters like landslides and floods (Ghorbanzadeh et al. Citation2019). The goal is to find an optimal model reflecting the relationship between flood inventory maps (dependent variables) and flood-influencing factors (independent variables) (Ighile et al. Citation2022). The input data feeds into the network, while the hidden layer processes operations and stores the resulting weights. The model’s output reveals how parameters interact.
3.5.4. Long-short-term-memory (LSTM)
LSTM (Sepp and Jürgen Citation1997) is an advanced type of recurrent neural network (RNN) designed to handle long data sequences by selectively remembering and forgetting information over time, making it effective for predicting hydrological variables and flood susceptibility mapping (Tripathy Citation2019; Fang et al. Citation2021; Bhattarai et al. Citation2024).
3.6. Evaluation metrics for flood susceptibility models
Generating a flood susceptibility map with a machine-learning algorithm involves a binary classification technique. In this approach, a chosen pixel from the study area is categorized as either flood pixels (P) as 1 or non-flood (N) as 0 (Tehrany, Pradhan, Mansor, et al. 2015; Towfiqul Islam et al. Citation2021). The selected machine-learning algorithm may not always yield accurate predictions during the classification process. The model’s performance is assessed using evaluation metrics, such as the area under the Receiver Operating Characteristics (AUROC) (EquationEquation 5(5)
(5) ), Kappa Score, and Accuracy.
(2)
(2)
(3)
(3)
(4)
(4)
(5)
(5)
In flood susceptibility mapping, correctly classified flood pixels and non-flood pixels are termed True Positives (TP) and True Negatives (TN). Conversely, inaccurately identified flood pixels and non-flood pixels are labeled as False Positives (FP) and False Negatives (FN) (Chapi et al. Citation2017; Janizadeh et al. Citation2019; Costache et al. Citation2020; Duwal et al. Citation2023). AUROC is a major evaluation criterion for classification model performance (Tien Bui et al. Citation2018). It represents the degree or measure of separability (Davis and Goadrich Citation2006; Towfiqul Islam et al. Citation2021). The AUROC is a tool for evaluating model performance, with the y-axis representing the true positive rate (sensitivity) (EquationEquation 3(3)
(3) ) and the x-axis representing the false positive rate (1 − specificity) (EquationEquation 4
(4)
(4) ) (Hanley Citation1989). It is a quantitative statistic to assess the model’s performance; a value closer to 1 indicates superior model performance, and 0.5 represents an inaccurate model.
4. Results
4.1. Feature selection and influence of conditioning factors on flood
For the feature selection multicollinearity and Information gain ratio values are considered (Arora et al. Citation2021; Bhattarai et al. Citation2024). In this study, VIF and Tolerance were used to evaluate multicollinearity. Likewise, Pearson’s correlation test results provide insight into the correlation between flooding and conditioning factors. The high correlation among the factors affects the prediction result in flood susceptibility mapping. The VIF values were <10, and tolerance values were >0.1 for all the selected 11 factors, so no multicollinearity exists. For further analysis, none of the conditioning factors were removed (). The highest VIF was obtained for slope (6.46), followed by TWI (3.11), elevation (2.62), and SPI (2.57). The tolerance values were highest for Aspect (0.95), followed by curvature (0.90), DTR(0.87), Soil(0.83), and Rainfall (0.81), and lowest values for Slope (0.15), TWI (0.32) and elevation (0.38). These results indicated that slope and elevation are the critical factors in flooding, followed by TWI, SPI, LULC, NDVI, DTR, Soil, Rainfall, Aspect, and Curvature.
Figure 4. Assessment of flood conditioning factors based on (a) Variance inflation factor, (b) Tolerance, (c) Pearson correlation, and (d) Information gain ratio.
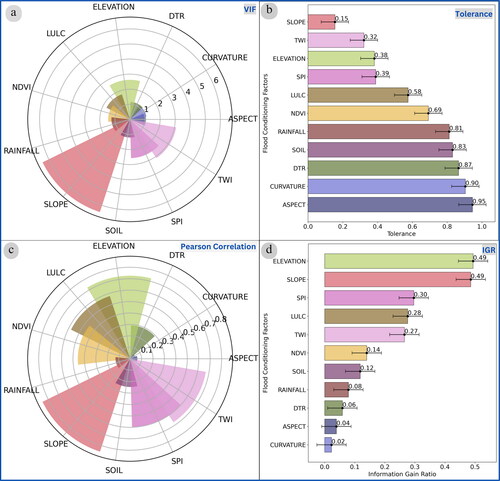
Based on IGR values, slope (0.49) and elevation (0.49) are highly influencing factors in the NNRB compared to other factors. Likewise, SPI (0.30), LULC (0.28), TWI (0.27), NDVI (0.14), and soil (0.12) demonstrated a slightly strong influence on the flood prediction compared to rainfall (0.08), DTR (0.06), Aspect (0.04), and Curvature (0.02) showed less influence on flood susceptibility. The Pearson correlation was highest for slope (0.85), then elevation (0.73), TWI(0.67), and SPI(0.60) signifying that these factors are more correlated to flooding in NNRB (). Based on the values of VIF, tolerance, Pearson Correlation, and IGR, it can be observed that the topographic factors like elevation, slope SPI, and TWI followed by landcover factors like LULC and NDVI are influential in flooding in NNRB compared to meteorological, geological, and location factors, such as rainfall, DTR, soil, and aspect.
4.2. Evaluation of model and validation
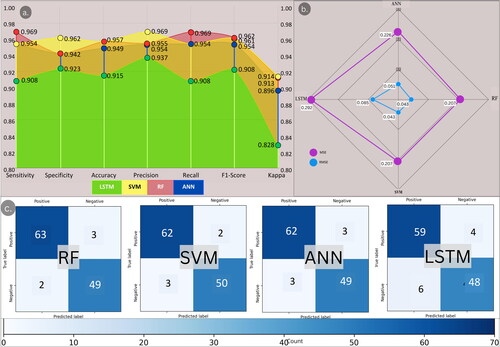
The machine learning models in this study were developed and validated using training and test datasets. Previous studies (Wang et al. Citation2020; Fang et al. Citation2021; Wubalem et al. Citation2021; Bera et al. Citation2022; Bhattarai et al. Citation2024) have suggested AUROC for model validation. The AUROC value indicates the performance of the model in detecting flood-prone areas. A higher AUROC value suggests better model performance. Sensitivity measures how accurately the model predicts positive instances, while specificity indicates the accuracy of predicting negative instances. The results revealed that all the models performed with higher precision with values >0.90. Based on AUROC, the RF performed the best (), evidenced by the train and test AUROC 1.00 and 0.993, respectively, followed by SVM (0.996 and 0.989), ANN (0.991 and 0.977), and LSTM (0.97 and 0.983). F1-score, precision, recall, kappa, MSE, and RMSE were employed for detailed evaluation accuracy. The F1-Score offers an equilibrium between precision and recall, where a high F1-Score reflects effective identification of flood-prone regions while minimizing false positives. (Zhang et al. Citation2022). A high level of sensitivity ensures that most flood-prone areas are correctly identified (Chapi et al. Citation2017). RF exhibits superior performance for other parameters also; with the highest Sensitivity (0.969), Accuracy (0.957), F1 Score (0.962), and Recall (0.969), indicating its robustness in correctly classifying flood-prone areas. In the case of accuracy, RF and SVM have the highest value (0.957) and Kappa scores (0.913 and 0.914, respectively), suggesting a strong agreement between the predicted and observed classifications. Specificity (True Negative Rate) is essential to avoid false alarms in non-flood-prone areas (Pourghasemi et al. Citation2020). The SVM model stands out with the highest specificity (0.962) and precision (0.969), highlighting its capability to correctly predict negative cases, i.e. non-flood points, and the proportion of correct positive predictions, i.e. flood points. LSTM lags in all metrics, with notably lower Accuracy (0.915) and higher MSE (0.292) and RMSE (0.085). Overall, RF emerges as the most reliable model for this application, effectively balancing accuracy and error metrics ( and ). However, it should be noted that all the models performed well, and their results should be considered for flood susceptibility mapping.
Figure 5. AUROCs For all models, (a) random forest, (b) artificial neural network, (c) long short-term memory, and (d) support vector machine.
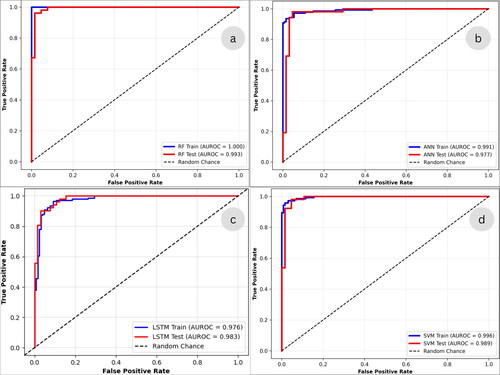
Figure 6. Performance of the models: (a) confusion matrix; (b) MSE and RMSE, and (c) precision and accuracy assessment parameters.
4.3. Flood susceptibility mapping
After the validation of the models, the flood susceptibility maps were prepared using each model. The flood susceptibility map obtained from the different models was reclassified into five classes: very less, less, medium, high, and very high. Various techniques, such as natural break, quantile, equal interval, and standard deviations are used for reclassifying flood susceptibility maps. We opted for the natural break reclassifying technique because it is well known for its superior performance compared to other methods and has been frequently used to reclassify flood-susceptible maps (Tehrany, Pradhan, Mansor, et al. 2015; Chapi et al. Citation2017; Choubin et al. Citation2019; Dodangeh et al. Citation2020; Towfiqul Islam et al. Citation2021; Wubalem et al. Citation2021; Sharir and Roslee Citation2022).
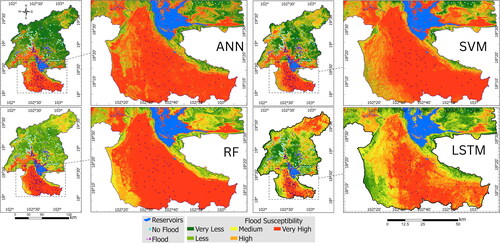
The results obtained from the four machine learning models are presented in and . The study revealed that for the LSTM model, 38% (6368 km2) of the area lies in a very high flood susceptibility zone, followed by 15% (2561 km2) in highly susceptible, 13% (2219 km2) in medium, 14% (2399 km2) in less and 20%(3385 km2) in very less flood susceptible zone. Similarly, SVM shows that 31% (5183 km2) of the area lies under very high susceptibility area, 14% (2378) in high, 13% (2182 km2) in medium, 14% (2366 km2) in less, and 28% (4822 km2) in very less flood susceptible area. The ANN model shows 27% (4582 km2) in very high, 9% (1634 km2) in high, 8%(1338 km2) medium, 12%(1981 km2) less, and 44% (7397 km2) in a very less susceptible area. Lastly, RF shows that 25% (4215 km2) lies in very high, 12% (2063 km2) in high, 18% (3022 km2) in medium, 28% (4729 km2) in less, and 17% (2902 km2) in very less susceptible areas. The spatial patterns of flood susceptibility of the RF and ANN are similar. For the downstream part of the basin, the very and high flood susceptibility patterns are similar for RF, ANN, and SVM compared to LSTM. The pattern for the upstream part of the basin is similar for SVM and RF, whereas ANN showed less area in the very high and high susceptible areas. In contrast, LSTM showed more area under the very high and high susceptibility zone (). Most of the vulnerable zones were in the lower portion of the basin (areas denoted as ‘very high’ in and ).
Figure 7. Flood susceptible areas in percentage and sq. km obtained from support vector machine, random forest, artificial neural network, and long short-term memory.
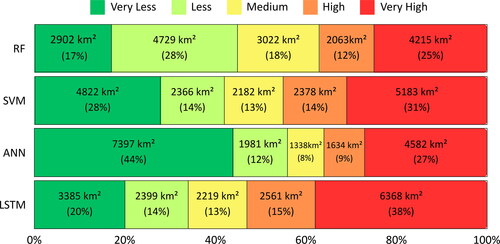
Figure 8. Flood susceptibility maps generated from machine learning models.
5. Discussion
Flood susceptibility mapping is a major step in flood disaster management and vulnerability assessment. The location of the probable flooding area is crucial for disaster management and future developments. Flood modeling based on remotely sensed satellite data has become a prominent and efficient method. Applying machine learning techniques enhances and makes the process much easier and more efficient. The application is advantageous in developing countries like the Lao PDR, where data scarcity is a major hindrance to studies. The coverage of satellite data to almost all over the world, enhanced quality of satellite remote sensing data, increased computational capacity, and development of easy-to-use and efficient machine learning approaches have become game changers in flood susceptibility mapping (Liu et al. Citation2017; Mehravar et al. Citation2023). This research in Lao PDR addresses the data scarcity issue in flood studies by developing a simple yet robust model for flood studies using publically available remote sensing data. In the case of flooding, the cloud cover during the flooding period has been a major drawback when using optical remote sensing techniques. This issue has been addressed with the development of synthetic aperture radar (SAR), which is less interfered with by cloud (Shahabi et al. Citation2020; Chen et al. Citation2021; Elkhrachy et al. Citation2021). This study thus analyzed the sentinel-1 SAR image for flood area detection along with available historical images to prepare the flood inventory. This study assessed the applicability of flood conditioning factors and their effects on flooding using multicollinearity and information gain ratio. The results from flood susceptibility mapping were validated statistically using different evaluation parameters and visually validated using the analysis results from SAR images and historical flood data.
5.1. Influence of the conditioning factors in flood modeling
A suitable flood conditioning factor selection is essential. Suitability analysis was carried out using the IGR method and multicollinearity test. In NNRB, the topographic factors dominated flood modeling. The higher values of IGR and VIF for slope, elevation, TWI, and SPI evidenced that DEM-generated factors are important factors in flood susceptibility mapping. Similar results have been observed from the studies carried out by previous researchers (Tehrany, Pradhan, et al. Citation2015; Tehrany, Jones, et al. Citation2019; Tehrany, Kumar, et al. Citation2019; Towfiqul Islam et al. Citation2021) in different parts of the world. When floods occur, low-lying places can act as natural basins that hold and collect water, prolonging the flooding and increasing the potential damage (Al-Kindi and Alabri Citation2024). The decreased flow velocity and increased flow path and infiltration rate can reduce the impact of the floods. The NNRB has a flat region characterized by low elevation and slopes in the downstream southern part of the basin before joining the Mekong River. It is relatively narrow; the bed slope is very mild, and the influence of the Mekong River level causes difficulty in draining the flooded area (Kimmany et al. Citation2020). In addition, there are also many low-lying areas in the Vientiane Plain, which are inundated by small floods. Even though many hydropower dams were constructed upstream of the flat plain, the downstream area is flooded almost yearly (Vilandone Keophila Citation2018; Keophila et al. Citation2019). Historical data indicates that central and southern regions are prone to floods due to their geographical position and terrain features (Hansana et al. Citation2023). These facts highlight the results of this study, which show that elevation, slope, SPI, and such topographic factors are major drivers of flooding in NNRB. Likewise, TWI, SPI, and LULC also significantly influence the NNRB. The high values of IGR for LULC and NDVI signify that vegetation is a vital causation factor in flooding. Some researchers (Yariyan et al. Citation2020; Al-Kindi and Alabri Citation2024; Maharjan et al. Citation2024) have demonstrated the importance of distance to the river, Rainfall, and curvature of the river basin for flood susceptibility detection. In our study, these factors contribute less to flood susceptibility. Predicting flooding events becomes challenging when considering aspects with a flat and smooth slope, as the distribution of flooding points lacks predictive significance in such cases (Towfiqul Islam et al. Citation2021). However, in this study aspect and curvature were observed to be the least influencing factors.
5.2. Model performances and validation
Based on the values of model evaluation parameters, it was observed that all models predicted well. The comparative analysis showed small differences in the parameter values whereas their spatial prediction was different, influencing the flood susceptibility mapping. AUROC is vital for assessing the model’s ability to discriminate between flood-prone and non-flood-prone areas (Khosravi et al. Citation2019). RF has the highest AUROC values on the training and test sets, suggesting better discrimination of flood and non-flood points. Considering these factors and the specific requirements of flood susceptibility mapping, RF remains the best model. It provides a good balance between sensitivity, specificity, and discrimination ability, as indicated by high F1-Score and AUROC values. RF is a popular machine-learning technique in hydrology that uses tree-based models. It is known for preventing overfitting, a common problem in individual decision trees while maintaining prediction accuracy (Schoppa et al., Citation2020). This study, in line with (Avand et al. Citation2021; Aldiansyah and Wardani Citation2023; Bhattarai et al. Citation2024), shows RF is better for flood susceptibility mapping. Besides RF, the performances of other models are also high; however, the spatial distribution of the flood susceptibility is different. The results from the RF, SVM, and ANN models align with historical flood observations from the Knowledge for Development (K4D), data from the Colorado Flood Observatory (DFO), and damage assessment using Sentinel-1 data. However, the areas shown as very high and highly susceptible in the northern part of NNRB are not well classified by LSTM. While all models are deemed suitable based on evaluation parameters, field observations and comparisons with historical data indicate that RF, ANN, and SVM outperform LSTM. The RF model, in particular, provides the most reliable results.
5.3. Flood susceptibility interpretation
The prediction from all models depicts that the southern part of the NNRB is highly susceptible to flooding. clearly shows the southern area of the basin below, and nearby Nam Ngum Reservoir 1, i.e. the central part of Lao PDR is a flood-prone zone. The areas near the Nam Ngum and Mekong Rivers are highly vulnerable to flooding due to topography and geographical location (Hansana et al. Citation2023). The reasons behind this area’s vulnerability to flooding are its flat terrain and the high velocity of the Nam Ngum River after flowing from high elevation to flat low elevation area. The quantification of the flood-susceptible area in NNRB shows the importance of flood management. More than one-third (38%) of the basin lies in very highly susceptible areas, and more than half (53%) of the total area lies in high and very highly susceptible areas ( and ).
Most of the low-elevation, low-slope areas near rivers are agricultural and built-up areas. Due to the availability of water for agriculture and livelihood, as well as the availability of fertile soil deposited from floods, people prefer these areas to live in even though the areas are highly vulnerable to flooding. For the sustainability of the infrastructure development, evaluating the resilience of the NNRB region to recurring natural disasters like floods is imperative. These events endanger lives and property, causing both short-term and long-term impacts on the economy and agriculture sectors. To mitigate these impacts, integrating satellite observations and open-sourced databases in flood management can offer an economical and efficient solution. As accuracy and time are vital factors in flood management (Tehrany, Pradhan, et al. Citation2015; Tehrany, Pradhan, Mansor, et al. 2015), testing different models and evaluating their performance is essential. Though improvements are being made for the enhancement of flood management, leveraging machine learning techniques is very limited or almost has not started for flood susceptibility mapping in the river basins of Lao PDR (Phrakonkham et al. Citation2019; Du et al. Citation2020; Hansana et al. Citation2023). Therefore, assessing machine learning approaches paves a path to simple and low-cost yet robust and reliable flood susceptibility mapping in river basins where data is scarce, and establishing traditional hydrological and hydraulic models proves challenging (Saber et al. Citation2022).
Our study has identified critical factors influencing flood occurrences in NNRB. This data is essential for developing precise flood forecasting models, implementing advanced flood warning systems, and guiding infrastructure and urban planning projects. According to the results, policymakers could concisely reconsider disaster risk reduction and flood management strategies. Land-use planners could determine the settlement zones, dams, and other structures in highly susceptible areas. Furthermore, the results could be utilized to inform the residents about evacuation actions, flood prevention, and preparedness.
6. Conclusion
Flood susceptibility maps are crucial in floodplain management relating to disasters, and integrating various models offers critical insights for flood risk management. This study used four machine-learning models (SVM, RF, ANN, and LSTM) to predict flood susceptibility in NNRB, an area annually affected by typhoons and heavy rainfall. The models were trained and tested using eleven flood conditioning variables and 390 locations. The RF model outperformed the others, indicating that 36% to 53% of NNRB, particularly the downstream southern region, is highly vulnerable to flooding. Despite constructing numerous reservoirs for hydropower and flood protection, downstream areas continue to flood yearly (Kimmany et al. Citation2020), challenging flood management (Vilandone Keophila Citation2018; Keophila et al. Citation2019). Effective floodplain management is needed to protect lives and property. The study’s results offer valuable insights for flood risk assessment and developing effective flood control plans. As floods threaten infrastructure, agriculture, and the economy worldwide, these machine-learning insights using remote sensing data can aid local authorities, planners, policymakers, and stakeholders in disaster management and climate change mitigation for sustainable development.
Acknowledgements
The authors are thankful to the editors and potential reviewers.
Disclosure statement
No potential conflict of interest was reported by the author(s).
Data availability statement
The data supporting this study’s findings are available on request from the authors.
Correction Statement
This article has been corrected with minor changes. These changes do not impact the academic content of the article.
References
- Adams G, Blakers RS, Someth P. 2018. Rapid initial assessment of the state of water resources in Lao PDR -Support the Lao National Water Strategy. Canberra.
- Ahmed IA, Talukdar S, Shahfahad, Parvez A, Rihan M, Baig MRI, Rahman A. 2022. Flood susceptibility modeling in the urban watershed of Guwahati using improved metaheuristic-based ensemble machine learning algorithms. Geocarto Int. 37(26):12238–12266. doi: 10.1080/10106049.2022.2066200.
- Al-Abadi AM. 2018. Mapping flood susceptibility in an arid region of southern Iraq using ensemble machine learning classifiers: a comparative study. Arab J Geosci. 11(9):218. doi: 10.1007/s12517-018-3584-5.
- Al-Aizari AR, Al-Masnay YA, Aydda A, Zhang J, Ullah K, Islam A, Habib T, Kaku DU, Nizeyimana JC, Al-Shaibah B, et al. 2022. Assessment analysis of flood susceptibility in tropical desert area: a case study of Yemen. Remote Sens. 14(16):4050. doi: 10.3390/rs14164050.
- Aldiansyah S, Wardani F. 2023. Evaluation of flood susceptibility prediction based on a resampling method using machine learning. J Water Clim Change. 14(3):937–961. doi: 10.2166/wcc.2023.494.
- Alin A. 2010. Multicollinearity. WIREs Comput Stats. 2(3):370–374. doi: 10.1002/wics.84.
- Al-Kindi KM, Alabri Z. 2024. Investigating the role of the key conditioning factors in flood susceptibility mapping through machine learning approaches. Earth Syst Environ. 8(1):63–81. doi: 10.1007/s41748-023-00369-7.
- Amiri A, Soltani K, Ebtehaj I, Bonakdari H. 2024. A novel machine learning tool for current and future flood susceptibility mapping by integrating remote sensing and geographic information systems. J Hydrol. 632:130936. doi: 10.1016/j.jhydrol.2024.130936.
- Andaryani S, Nourani V, Haghighi AT, Keesstra S. 2021. Integration of hard and soft supervised machine learning for flood susceptibility mapping. J Environ Manage. 291:112731. doi: 10.1016/j.jenvman.2021.112731.
- Arabameri A, Rezaei K, Cerdà A, Conoscenti C, Kalantari Z. 2019. A comparison of statistical methods and multi-criteria decision making to map flood hazard susceptibility in northern Iran. Sci Total Environ. 660:443–458. doi: 10.1016/j.scitotenv.2019.01.021.
- Arabameri A, Seyed Danesh A, Santosh M, Cerda A, Chandra Pal S, Ghorbanzadeh O, Roy P, Chowdhuri I. 2022. Flood susceptibility mapping using meta-heuristic algorithms. Geomat Nat Hazards Risk. 13(1):949–974. doi: 10.1080/19475705.2022.2060138.
- Arora A, Arabameri A, Pandey M, Siddiqui MA, Shukla UK, Bui DT, Mishra VN, Bhardwaj A. 2021. Optimization of state-of-the-art fuzzy-metaheuristic ANFIS-based machine learning models for flood susceptibility prediction mapping in the Middle Ganga Plain, India. Sci Total Environ. 750:141565. doi: 10.1016/j.scitotenv.2020.141565.
- Askar S, Zeraat Peyma S, Yousef MM, Prodanova NA, Muda I, Elsahabi M, Hatamiafkoueieh J. 2022. Flood susceptibility mapping using remote sensing and integration of decision table classifier and metaheuristic algorithms. Water Switz. 14(19):3062. doi: 10.3390/w14193062.
- Avand M, Kuriqi A, Khazaei M, Ghorbanzadeh O. 2022. DEM resolution effects on machine learning performance for flood probability mapping. J Hydro-Environ Res. 40:1–16. doi: 10.1016/j.jher.2021.10.002.
- Avand M, Moradi H, Lasboyee MR. 2021. Using machine learning models, remote sensing, and GIS to investigate the effects of changing climates and land uses on flood probability. J Hydrol. 595:125663. doi: 10.1016/j.jhydrol.2020.125663.
- Baig MA, Xiong D, Rahman M, Islam MM, Elbeltagi A, Yigez B, Rai DK, Tayab M, Dewan A. 2022. How do multiple kernel functions in machine learning algorithms improve precision in flood probability mapping? Nat Hazards. 113(3):1543–1562. doi: 10.1007/s11069-022-05357-0.
- Bartlett R, Baker J, Lacombe G, Douangsavanh S, Jeuland M. 2012. Analyzing economic tradeoffs of water use in the Nam Ngum River Basin, Lao PDR. Working Paper EE 12–10. Nicholas Institute for Environmental Policy Solutions, Duke University. 38p. SSRN J. doi: 10.2139/ssrn.2469222.
- Bera S, Das A, Mazumder T. 2022. Evaluation of machine learning, information theory and multi-criteria decision analysis methods for flood susceptibility mapping under varying spatial scale of analyses. Remote Sens Appl Soc Environ. 25:100686. doi: 10.1016/j.rsase.2021.100686.
- Bhattarai Y, Duwal S, Sharma S, Talchabhadel R. 2024. Leveraging machine learning and open-source spatial datasets to enhance flood susceptibility mapping in transboundary river basin. Int J Digit Earth. 17(1):2313857. doi: 10.1080/17538947.2024.2313857.
- Broekhuizen H, Groothuis-Oudshoorn CGM, Van Til JA, Hummel JM, IJzerman MJ. 2015. A review and classification of approaches for dealing with uncertainty in multi-criteria decision analysis for healthcare decisions. Pharmacoeconomics. 33(5):445–455. doi: 10.1007/s40273-014-0251-x.
- Buitinck L, Louppe G, Blondel M, Pedregosa F, Mueller A, Grisel O, Niculae V, Prettenhofer P, Gramfort A, Grobler J, et al. 2013. API design for machine learning software: experiences from the scikit-learn project. 1–15.
- Chapi K, Singh VP, Shirzadi A, Shahabi H, Bui DT, Pham BT, Khosravi K. 2017. A novel hybrid artificial intelligence approach for flood susceptibility assessment. Environ Model Softw. 95:229–245. doi: 10.1016/j.envsoft.2017.06.012.
- Chen C-Y, Yu F-C. 2011. Morphometric analysis of debris flows and their source areas using GIS. Geomorphology. 129(3–4):387–397. doi: 10.1016/j.geomorph.2011.03.002.
- Chen S, Huang W, Chen Y, Feng M. 2021. An adaptive thresholding approach toward rapid flood coverage extraction from Sentinel-1 SAR Imagery. Remote Sens. 13(23):4899. doi: 10.3390/rs13234899.
- Choubin B, Moradi E, Golshan M, Adamowski J, Sajedi-Hosseini F, Mosavi A. 2019. An ensemble prediction of flood susceptibility using multivariate discriminant analysis, classification and regression trees, and support vector machines. Sci Total Environ. 651(Pt 2):2087–2096. doi: 10.1016/j.scitotenv.2018.10.064.
- Cirella GT, Iyalomhe FO. 2018. Flooding conceptual review: sustainability-focalized best practices in Nigeria. Appl Sci. 8(9):1558. doi: 10.3390/app8091558.
- Costache R, Popa MC, Tien Bui D, Diaconu DC, Ciubotaru N, Minea G, Pham QB. 2020. Spatial predicting of flood potential areas using novel hybridizations of fuzzy decision-making, bivariate statistics, and machine learning. J Hydrol. 585:124808. doi: 10.1016/j.jhydrol.2020.124808.
- Costache R, Tien Bui D. 2019. Spatial prediction of flood potential using new ensembles of bivariate statistics and artificial intelligence: a case study at the Putna river catchment of Romania. Sci Total Environ. 691:1098–1118. doi: 10.1016/j.scitotenv.2019.07.197.
- Dabija A, Kluczek M, Zagajewski B, Raczko E, Kycko M, Al-Sulttani AH, Tardà A, Pineda L, Corbera J. 2021. Comparison of support vector machines and random forests for Corine land cover mapping. Remote Sens. 13(4):777. doi: 10.3390/rs13040777.
- Davis J, Goadrich M. 2006. The relationship between precision-recall and ROC curves. In: Proc 23rd Int Conf Mach Learn – ICML 06 [Internet]. Pittsburgh (PA): ACM Press; p. 233–240. doi: 10.1145/1143844.1143874.
- Dhungana S, Shrestha S, Van TP, Kc S, Das Gupta A, Nguyen TPL. 2023. Evaluation of gridded precipitation products in the selected sub-basins of Lower Mekong River Basin. Theor Appl Climatol. 151(1–2):293–310. doi: 10.1007/s00704-022-04268-1.
- Di Baldassarre G, Montanari A, Lins H, Koutsoyiannis D, Brandimarte L, Blöschl G. 2010. Flood fatalities in Africa: from diagnosis to mitigation. Geophys Res Lett. 37(22): L22402. doi: 10.1029/2010GL045467.
- Dodangeh E, Choubin B, Eigdir AN, Nabipour N, Panahi M, Shamshirband S, Mosavi A. 2020. Integrated machine learning methods with resampling algorithms for flood susceptibility prediction. Sci Total Environ. 705:135983. doi: 10.1016/j.scitotenv.2019.135983.
- Du J, Fan Z, Pu J. 2020. Comparative study on flash flood hazard assessment for Nam Ou River Basin, Lao PDR. Nat Hazards. 102(3):1393–1417. doi: 10.1007/s11069-020-03972-3.
- Duwal S, Liu D, Pradhan PM. 2023. Flood susceptibility modeling of the Karnali river basin of Nepal using different machine learning approaches. Geomat Nat Hazards Risk. 14(1):2217321 doi: 10.1080/19475705.2023.2217321.
- Elkhrachy I, Pham QB, Costache R, Mohajane M, Rahman KU, Shahabi H, Linh NTT, Anh DT. 2021. Sentinel‐1 remote sensing data and Hydrologic Engineering Centres River Analysis System two‐dimensional integration for flash flood detection and modelling in New Cairo City. J Flood Risk Manage. 14(2):e12692. doi: 10.1111/jfr3.12692.
- Fang Z, Wang Y, Peng L, Hong H. 2021. Predicting flood susceptibility using LSTM neural networks. J Hydrol. 594:125734–125734. doi: 10.1016/j.jhydrol.2020.125734.
- Felix AY, Sasipraba T. 2019. Flood detection using gradient boost machine learning approach. In: 2019 Int Conf Comput Intell Knowl Econ ICCIKE [Internet]. Dubai: IEEE; p. 779–783. doi: 10.1109/ICCIKE47802.2019.9004419.
- FitzGerald G, Du W, Jamal A, Clark M, Hou X-Y. 2010. Flood fatalities in contemporary Australia (1997–2008). Emerg Med Australas. 22(2):180–186. doi: 10.1111/j.1742-6723.2010.01284.x.
- Florinsky IV. 2017. An illustrated introduction to general geomorphometry. Prog Phys Geogr Earth Environ. 41(6):723–752. doi: 10.1177/0309133317733667.
- Ghorbanzadeh O, Blaschke T, Gholamnia K, Meena S, Tiede D, Aryal J. 2019. Evaluation of different machine learning methods and deep-learning convolutional neural networks for landslide detection. Remote Sens. 11(2):196. doi: 10.3390/rs11020196.
- Government of Lao PDR, Asian Development Bank. 2022. Lao Peoples Democr Repub – Gov Asian Dev Bank [Internet]. [accessed 2023 Nov 17]. https://www.preventionweb.net/publication/national-strategy-disaster-risk-reduction-nsdrr-2021-2030-lao-pdr.
- Hamidi E, Peter BG, Munoz DF, Moftakhari H, Moradkhani H. 2023. Fast flood extent monitoring with SAR change detection using Google Earth Engine. IEEE Trans Geosci Remote Sens. 61:1–19. doi: 10.1109/TGRS.2023.3240097.
- Hanley JA. 1989. Receiver operating characteristic (ROC) methodology: the state of the art. Crit Rev Diagn Imaging. 29(3):307–335.
- Hansana P, Guo X, Zhang S, Kang X, Li S. 2023. Flood analysis using multi-scale remote sensing observations in Laos. Remote Sens. 15(12):3166. doi: 10.3390/rs15123166.
- Hasanuzzaman M, Islam A, Bera B, Shit PK. 2022. A comparison of performance measures of three machine learning algorithms for flood susceptibility mapping of river Silabati (tropical river, India). Phys Chem Earth Parts ABC. 127:103198. doi: 10.1016/j.pce.2022.103198.
- Ighile EH, Shirakawa H, Tanikawa H. 2022. Application of GIS and machine learning to predict flood areas in Nigeria. Sustainability. 14(9):5039. doi: 10.3390/su14095039.
- Imamura Y. 2022. Development of a method for assessing country-based flood risk at the global scale. Int J Disaster Risk Sci. 13(1):87–99. doi: 10.1007/s13753-021-00388-w.
- Janizadeh S, Avand M, Jaafari A, Van Phong T, Bayat M, Ahmadisharaf E, Prakash I, Pham BT, Lee S. 2019. Prediction success of machine learning methods for flash flood susceptibility mapping in the Tafresh watershed, Iran. Sustain Switz. 11(19):5426. doi: 10.3390/su11195426.
- Keophila V, Promwungkwa A, Ngamsanroaj K. 2019. Effectiveness of cascades reservoir for flood control operation and electricity production in Nam Ngum River. J Phys Conf Ser. 1175:012276. doi: 10.1088/1742-6596/1175/1/012276.
- Khalil U, Khan NM. 2017. Floodplain mapping for Indus River: Chashma –Taunsa Reach.
- Khosravi K, Nohani E, Maroufinia E, Pourghasemi HR. 2016. A GIS-based flood susceptibility assessment and its mapping in Iran: a comparison between frequency ratio and weights-of-evidence bivariate statistical models with multi-criteria decision-making technique. Nat Hazards. 83(2):947–987. doi: 10.1007/s11069-016-2357-2.
- Khosravi K, Pham BT, Chapi K, Shirzadi A, Shahabi H, Revhaug I, Prakash I, Tien Bui D. 2018. A comparative assessment of decision trees algorithms for flash flood susceptibility modeling at Haraz watershed, northern Iran. Sci Total Environ. 627:744–755. doi: 10.1016/j.scitotenv.2018.01.266.
- Khosravi K, Shahabi H, Pham BT, Adamowski J, Shirzadi A, Pradhan B, Dou J, Ly HB, Gróf G, Ho HL, et al. 2019. A comparative assessment of flood susceptibility modeling using multi-criteria decision-making analysis and machine learning methods. J Hydrol. 573:311–323. (March): doi: 10.1016/j.jhydrol.2019.03.073.
- Kimmany B, Ruangrassamee P, Visessri S. 2020. Optimal multi-reservoir operation for hydropower production in the Nam Ngum River Basin. Eng J. 24(5):1–13. doi: 10.4186/ej.2020.24.5.1.
- Kulithalai SSP, Kundapura S. 2023. Spatial mapping of flood susceptibility using decision tree–based machine learning models for the Vembanad Lake System in Kerala, India. J Water Resour Plann Manage. 149(10):04023052. doi: 10.1061/JWRMD5.WRENG-5858.
- Kumar R, Acharya P. 2016. Flood hazard and risk assessment of 2014 floods in Kashmir Valley: a space-based multisensor approach. Nat Hazards. 84(1):437–464. doi: 10.1007/s11069-016-2428-4.
- Kundzewicz ZW, Kanae S, Seneviratne SI, Handmer J, Nicholls N, Peduzzi P, Mechler R, Bouwer LM, Arnell N, Mach K, et al. 2014. Le risque d’inondation et les perspectives de changement climatique mondial et régional. Hydrol Sci J. 59(1):1–28. doi: 10.1080/02626667.2013.857411.
- Li K, Wu S, Dai E, Xu Z. 2012. Flood loss analysis and quantitative risk assessment in China. Nat Hazards. 63(2):737–760. doi: 10.1007/s11069-012-0180-y.
- Liu J, Wang J, Xiong J, Cheng W, Li Y, Cao Y, He Y, Duan Y, He W, Yang G. 2022. Assessment of flood susceptibility mapping using support vector machine, logistic regression and their ensemble techniques in the Belt and Road region. Geocarto Int. 37(25):9817–9846. doi: 10.1080/10106049.2022.2025918.
- Liu J, Xiong J, Chen Y, Sun H, Zhao X, Tu F, Gu Y. 2023. A new avenue to improve the performance of integrated modeling for flash flood susceptibility assessment: applying cluster algorithms. Ecol Indic. 146:109785. doi: 10.1016/j.ecolind.2022.109785.
- Liu X, Sahli H, Meng Y, Huang Q, Lin L. 2017. Flood inundation mapping from optical satellite images using spatiotemporal context learning and modest AdaBoost. Remote Sens. 9(6):617. doi: 10.3390/rs9060617.
- Ma M, Zhao G, He B, Li Q, Dong H, Wang S, Wang Z. 2021. XGBoost-based method for flash flood risk assessment. J Hydrol. 598:126382. doi: 10.1016/j.jhydrol.2021.126382.
- Maharjan M, Timilsina S, Ayer S, Singh B, Manandhar B, Sedhain A. 2024. Flood susceptibility assessment using machine learning approach in the Mohana-Khutiya River of Nepal. Nat Hazards Res. 4(1):32-45. doi: 10.1016/j.nhres.2024.01.001.
- Martinis S, Plank S, Ćwik K. 2018. The use of Sentinel-1 time-series data to improve flood monitoring in arid areas. Remote Sens. 10(4):583. doi: 10.3390/rs10040583.
- Meema T, Tachikawa Y, Ichikawa Y, Yorozu K. 2021. Uncertainty assessment of water resources and long-term hydropower generation using a large ensemble of future climate projections for the Nam Ngum River in the Mekong Basin. J Hydrol Reg Stud. 36:100856. doi: 10.1016/j.ejrh.2021.100856.
- Mehravar S, Razavi-Termeh SV, Moghimi A, Ranjgar B, Foroughnia F, Amani M. 2023. Flood susceptibility mapping using multi-temporal SAR imagery and novel integration of nature-inspired algorithms into support vector regression. J Hydrol. 617:129100. doi: 10.1016/j.jhydrol.2023.129100.
- Miles J. 2014. Tolerance and variance inflation factor. In: Wiley StatsRef Stat Ref Online [Internet]. New York: John Wiley & Sons, Ltd. doi: 10.1002/9781118445112.stat06593.
- Mirzaei S, Vafakhah M, Pradhan B, Alavi SJ. 2021. Flood susceptibility assessment using extreme gradient boosting (EGB), Iran. Earth Sci Inform. 14(1):51–67. doi: 10.1007/s12145-020-00530-0.
- Mojaddadi H, Pradhan B, Nampak H, Ahmad N, Ghazali AHb 2017. Ensemble machine-learning-based geospatial approach for flood risk assessment using multi-sensor remote-sensing data and GIS. Geomat Nat Hazards Risk. 8(2):1080–1102. doi: 10.1080/19475705.2017.1294113.
- Morrison A, Westbrook C j, Noble B f 2018. A review of the flood risk management governance and resilience literature. J Flood Risk Manage. 11(3):291–304. doi: 10.1111/jfr3.12315.
- Nachappa TG, Piralilou ST, Gholamnia K, Ghorbanzadeh O, Rahmati O, Blaschke T, Gudiyangada Nachappa T, Tavakkoli Piralilou S, Gholamnia K, Ghorbanzadeh O, et al. 2020. Flood susceptibility mapping with machine learning, multi-criteria decision analysis and ensemble using Dempster Shafer Theory. J Hydrol. 590:125275. doi: 10.1016/j.jhydrol.2020.125275.
- Nagler T, Rott H, Hetzenecker M, Wuite J, Potin P. 2015. The Sentinel-1 mission: new opportunities for ice sheet observations. Remote Sens. 7(7):9371–9389. doi: 10.3390/rs70709371.
- Natarajan L, Usha T, Gowrappan M, Palpanabhan Kasthuri B, Moorthy P, Chokkalingam L. 2021. Flood susceptibility analysis in Chennai Corporation using frequency ratio model. J Indian Soc Remote Sens. 49(7):1533–1543. doi: 10.1007/s12524-021-01331-8.
- Nguyen HD. 2022. Flood susceptibility assessment using hybrid machine learning and remote sensing in Quang Tri province, Vietnam. Trans GIS. 26(7):2776–2801. doi: 10.1111/tgis.12980.
- Ozdemir A, Altural T. 2013. A comparative study of frequency ratio, weights of evidence and logistic regression methods for landslide susceptibility mapping: sultan Mountains, SW Turkey. J Asian Earth Sci. 64:180–197. doi: 10.1016/j.jseaes.2012.12.014.
- Phrakonkham S, Kazama S, Komori D, Sopha S. 2019. Distributed hydrological model for assessing flood hazards in Laos. J Water Resour Prot. 11(08):937–958. doi: 10.4236/jwarp.2019.118056.
- Poudyal CP, Chang C, Oh H-J, Lee S. 2010. Landslide susceptibility maps comparing frequency ratio and artificial neural networks: a case study from the Nepal Himalaya. Environ Earth Sci. 61(5):1049–1064. doi: 10.1007/s12665-009-0426-5.
- Pourghasemi HR, Kariminejad N, Amiri M, Edalat M, Zarafshar M, Blaschke T, Cerda A. 2020. Assessing and mapping multi-hazard risk susceptibility using a machine learning technique. Sci Rep. 10(1):3203. doi: 10.1038/s41598-020-60191-3.
- Priscillia S, Schillaci C, Lipani A. 2021. Flood susceptibility assessment using artificial neural networks in Indonesia. Artif Intell Geosci. 2:215–222. doi: 10.1016/j.aiig.2022.03.002.
- Rahmati O, Pourghasemi HR, Zeinivand H. 2016. Flood susceptibility mapping using frequency ratio and weights-of-evidence models in the Golastan Province, Iran. Geocarto Int. 31(1):42–70. doi: 10.1080/10106049.2015.1041559.
- Ramesh V, Iqbal SS. 2022. Urban flood susceptibility zonation mapping using evidential belief function, frequency ratio and fuzzy gamma operator models in GIS: a case study of Greater Mumbai, Maharashtra, India. Geocarto Int. 37(2):581–606. doi: 10.1080/10106049.2020.1730448.
- Rappaport EN. 2014. Fatalities in the United States from Atlantic tropical cyclones: new data and interpretation. Bull Am Meteorol Soc. 95(3):341–346. doi: 10.1175/BAMS-D-12-00074.1.
- Razavi-Termeh SV, Sadeghi-Niaraki A, Choi S-M. 2023. A new approach based on biology-inspired metaheuristic algorithms in combination with random forest to enhance the flood susceptibility mapping. J Environ Manage. 345:118790. doi: 10.1016/j.jenvman.2023.118790.
- Razavi-Termeh SV, Seo M, Sadeghi-Niaraki A, Choi S-M. 2023. Flash flood detection and susceptibility mapping in the Monsoon period by integration of optical and radar satellite imagery using an improvement of a sequential ensemble algorithm. Weather Clim Extrem. 41:100595. doi: 10.1016/j.wace.2023.100595.
- Saber M, Boulmaiz T, Guermoui M, Abdrabo KI, Kantoush SA, Sumi T, Boutaghane H, Hori T, Binh DV, Nguyen BQ, et al. 2023. Enhancing flood risk assessment through integration of ensemble learning approaches and physical-based hydrological modeling. Geomat Nat Hazards Risk. 14(1):2203798. doi: 10.1080/19475705.2023.2203798.
- Saber M, Boulmaiz T, Guermoui M, Abdrabo KI, Kantoush SA, Sumi T, Boutaghane H, Nohara D, Mabrouk E. 2022. Examining LightGBM and CatBoost models for wadi flash flood susceptibility prediction. Geocarto Int. 37(25):7462–7487. doi: 10.1080/10106049.2021.1974959.
- Saha TK, Pal S, Talukdar S, Debanshi S, Khatun R, Singha P, Mandal I. 2021. How far spatial resolution affects the ensemble machine learning based flood susceptibility prediction in data sparse region. J Environ Manage. 297:113344. doi: 10.1016/j.jenvman.2021.113344.
- Saravanan S, Abijith D, Reddy NM, Kss P, Janardhanam N, Sathiyamurthi S, Sivakumar V. 2023. Flood susceptibility mapping using machine learning boosting algorithms techniques in Idukki district of Kerala India. Urban Clim. 49:101503. doi: 10.1016/j.uclim.2023.101503.
- Schoppa L,Vogel T,Zöller G,Kreibich H. 2020. Probabilistic flood loss models for companies. Water Resour Res. 56, e2020WR027649.
- Sepp H, Jürgen S. 1997. Long short-term meomry. Neural Comput. 9(8):1735–1780.
- Shafizadeh-Moghadam H, Valavi R, Shahabi H, Chapi K, Shirzadi A. 2018. Novel forecasting approaches using combination of machine learning and statistical models for flood susceptibility mapping. J Environ Manage. 217:1–11. doi: 10.1016/j.jenvman.2018.03.089.
- Shahabi H, Shirzadi A, Ghaderi K, Omidvar E, Al-Ansari N, Clague JJ, Geertsema M, Khosravi K, Amini A, Bahrami S, et al. 2020. Flood detection and susceptibility mapping using Sentinel-1 remote sensing data and a machine learning approach: hybrid intelligence of bagging ensemble based on K-Nearest Neighbor classifier. Remote Sens. 12(2):266. doi: 10.3390/rs12020266.
- Sharir K, Roslee R. 2022. Flood susceptibility assessment (FSA) using GIS-based frequency ratio (FR) model in Kota Belud, Sabah, Malaysia. Int J Des Nat Ecodynamics. 17(2):203–208. doi: 10.18280/ijdne.170206.
- Sørensen R, Zinko U, Seibert J. 2006. On the calculation of the topographic wetness index: evaluation of different methods based on field observations. Hydrol Earth Syst Sci. 10(1):101–112. doi: 10.5194/hess-10-101-2006.
- Talukdar S, Ghose B, Shahfahad, Salam R, Mahato S, Pham QB, Linh NTT, Costache R, Avand M. 2020. Flood susceptibility modeling in Teesta River basin, Bangladesh using novel ensembles of bagging algorithms. Stoch Environ Res Risk Assess. 34(12):2277–2300. doi: 10.1007/s00477-020-01862-5.
- Tang X, Li J, Liu M, Liu W, Hong H. 2020. Flood susceptibility assessment based on a novel random Naïve Bayes method: a comparison between different factor discretization methods. Catena. 190:104536. doi: 10.1016/j.catena.2020.104536.
- Tehrany MS, Jones S, Shabani F. 2019. Identifying the essential flood conditioning factors for flood prone area mapping using machine learning techniques. Catena. 175:174–192. doi: 10.1016/j.catena.2018.12.011.
- Tehrany MS, Kumar L, Shabani F. 2019. A novel GIS-based ensemble technique for flood susceptibility mapping using evidential belief function and support vector machine: brisbane, Australia. PeerJ. 7(10):e7653. doi: 10.7717/peerj.7653.
- Tehrany MS, Pradhan B, Jebur MN. 2014. Flood susceptibility mapping using a novel ensemble weights-of-evidence and support vector machine models in GIS. J Hydrol. 512:332–343. doi: 10.1016/j.jhydrol.2014.03.008.
- Tehrany MS, Pradhan B, Jebur MN. 2015. Flood susceptibility analysis and its verification using a novel ensemble support vector machine and frequency ratio method. Stoch Environ Res Risk Assess. 29(4):1149–1165. doi: 10.1007/s00477-015-1021-9.
- Tehrany MS, Pradhan B, Mansor S, Ahmad N. 2015. Flood susceptibility assessment using GIS-based support vector machine model with different kernel types. Catena. 125:91–101. doi: 10.1016/j.catena.2014.10.017.
- Tien Bui D, Khosravi K, Li S, Shahabi H, Panahi M, Singh V, Chapi K, Shirzadi A, Panahi S, Chen W, et al. 2018. New hybrids of ANFIS with several optimization algorithms for flood susceptibility modeling. Water. 10(9):1210. doi: 10.3390/w10091210.
- Towfiqul Islam ARM, Talukdar S, Mahato S, Kundu S, Eibek KU, Pham QB, Kuriqi A, Linh NTT. 2021. Flood susceptibility modelling using advanced ensemble machine learning models. Geosci Front. 12(3):101075. doi: 10.1016/j.gsf.2020.09.006.
- Tripathy P. 2019. Neural network for satellite data classification using tensorfow in python. 1–12.
- Twele A, Cao W, Plank S, Martinis S. 2016. Sentinel-1-based flood mapping: a fully automated processing chain. Int J Remote Sens. 37(13):2990–3004. doi: 10.1080/01431161.2016.1192304.
- UN, World Bank, GFDRR, EU. 2018. UN, World Bank, GFDRR & EU. UNDP [Internet]. [accessed 2023 Nov 29]. https://www.undp.org/laopdr/publications/post-disaster-needs-assessment-2018-floods-lao-pdr.
- UNDRR. 2019. Disaster risk reduction in Lao PDR: status report 2019 [Internet]. Bangkok: United Nations Office for Disaster Risk Reduction (UNDRR), Regional Office for Asia and the Pacific. https://reliefweb.int/attachments/11ee7862-c016-37c0-81e0-06504dad05f5/68230_3laopdrdrmstatusreport.pdf.
- Vilandone Keophila 2018. Multi-objective optimization for flood control operation and electricity production of Nam Ngum 1 and 2 hydropower plants. J Thai Interdiscip Res. 13:58. doi: 10.14456/JTIR.2018.52.
- Wang Y, Fang Z, Hong H, Peng L. 2020. Flood susceptibility mapping using convolutional neural network frameworks. J Hydrol. 582:124482. doi: 10.1016/j.jhydrol.2019.124482.
- Wang Y, Hong H, Chen W, Li S, Panahi M, Khosravi K, Shirzadi A, Shahabi H, Panahi S, Costache R. 2019. Flood susceptibility mapping in Dingnan County (China) using adaptive neuro-fuzzy inference system with biogeography based optimization and imperialistic competitive algorithm. J Environ Manage. 247:712–729. doi: 10.1016/j.jenvman.2019.06.102.
- Wei X, Cai S, Ni P, Zhan W. 2020. Impacts of climate change and human activities on the water discharge and sediment load of the Pearl River, southern China. Sci Rep. 10(1):16743. doi: 10.1038/s41598-020-73939-8.
- Wubalem A, Tesfaw G, Dawit Z, Getahun B, Mekuria T, Jothimani M. 2021. Comparison of statistical and analytical hierarchy process methods on flood susceptibility mapping: in a case study of the Lake Tana sub-basin in northwestern Ethiopia. Open Geosci. 13(1):1668–1688. doi: 10.1515/geo-2020-0329.
- Yariyan P, Avand M, Abbaspour RA, Torabi Haghighi A, Costache R, Ghorbanzadeh O, Janizadeh S, Blaschke T. 2020. Flood susceptibility mapping using an improved analytic network process with statistical models. Geomat Nat Hazards Risk. 11(1):2282–2314. doi: 10.1080/19475705.2020.1836036.
- Youssef AM, Pradhan B, Sefry SA. 2016. Flash flood susceptibility assessment in Jeddah city (Kingdom of Saudi Arabia) using bivariate and multivariate statistical models. Environ Earth Sci. 75(1):12. doi: 10.1007/s12665-015-4830-8.
- Zeleňáková M, Fijko R, Labant S, Weiss E, Markovič G, Weiss R. 2019. Flood risk modelling of the Slatvinec stream in Kružlov village, Slovakia. J Clean Prod. 212:109–118. doi: 10.1016/j.jclepro.2018.12.008.
- Zhang C, Feng Y, Hu L, Tapete D, Pan L, Liang Z, Cigna F, Yue P. 2022. A domain adaptation neural network for change detection with heterogeneous optical and SAR remote sensing images. Int J Appl Earth Obs Geoinformation. 109:102769. doi: 10.1016/j.jag.2022.102769.