
 ?Mathematical formulae have been encoded as MathML and are displayed in this HTML version using MathJax in order to improve their display. Uncheck the box to turn MathJax off. This feature requires Javascript. Click on a formula to zoom.
Abstract
The paper integrates well-established methods from other spheres of flood risk assessment in a novel way to explore the currently poorly understood Safe Development Paradox (SDP) phenomenon in coastal settings. The study contributes to addressing this knowledge gap based on insights from contrasting UK case studies: Portsmouth, Weston-super-Mare, and Southport. Differential analysis of historic LiDAR Digital Surface Models (DSMs) was used to identify temporal changes in the urban landscape to create a DSM of Difference (DoD), representing elevation change between two locations over time. Geostatistical testing, specifically t-tests, were then used to infer statistical significance of changes in urban development. The findings reveal a consistent pattern: following completion or improvement of large-scale structural coastal flood defences, there is subsequent, and statistically significant, increases in urban development within/near flood-exposed areas across all three case studies, contrary to the limited flood-exposed development in neighbouring settlements, with no comparable defences constructed during the same period. On average, new urban development occurs approximately 2 years after the completion of coastal flood defence projects. The study emphasises the importance of context-specific and neighbourhood analyses, considering settlement size, economy, and extraneous factors influencing the nature of development to better understand the SDP’s long-term implications.
Introduction
Across the world, the number of urban residents has increased from 700 million, in 1950, to 4.35 billion at present. Meanwhile, sea level has risen, on average, 20 cm over the past 2 centuries, with the rate of change accelerating to 3.2 mm/yr in the early twenty first century (Siegert Citation2015). Meanwhile an estimated 687 million people live within the ≤ 5 m Low Elevation Coastal Zone globally (MacManus et al. Citation2021). The rapid growth of urbanisation, coupled with rising sea levels, results in tensions at the coastal zone, the interface between the two spheres (land and the sea), raising long-term sustainability challenges. Yet, population growth and flood-exposed development continues (Hallegatte et al. Citation2013), increasing the likelihood of catastrophic consequences.
For example, Hurricane Katrina cost US$200 billion in economic losses (King Citation2005), a disaster Burby (Citation2006) argues was wholly avoidable and predictable. Exacerbated by well-intentioned yet short-sighted decisions to make hazardous areas ‘safe’, a process the author calls ‘safe development’. The fundamental idea behind safe development is that land, exposed to natural hazard, can be made profitable by the construction of defences leading to ‘productive use’. Interventions geared towards risk reduction or adaptations, may in fact, inadvertently reinforce, redistribute, or create new sources of vulnerability (Magnan et al. Citation2016; Eriksen et al. Citation2021). In many areas coastal defences are built to protect people and assets against flooding, which in turn encourage further development in high-risk areas and inadvertently lead to increased exposure or vulnerability in the long term (e.g. Breen et al. Citation2022).
There is a common belief in flood risk management (FRM) programmes that the exposure of urban areas depends solely on socio-economic development and natural urban growth. Whereas had the expansion of urban growth been solely driven by demographic change, the spatial distribution would remain unaffected and not tend towards structural flood defences (Di Baldassarre et al. Citation2013b). Instead, growing populations and higher value assets tend to be located near to the newly constructed defence and in exposed areas. This dynamic perpetuated the need for continuous upgrading of the pre-existing defences, leading to great population and asset placement, and negating previous decreases in flood hazard with an increase in exposure, and potentially vulnerability (Tobin Citation1995; Burby Citation2006; Kates et al. Citation2006; Burton and Cutter Citation2008; Montz and Tobin Citation2008; Ludy and Kondolf Citation2012; Di Baldassarre et al. Citation2013a). This can ultimately lead to the lock-in effect of a cycle of continued and prohibitively expensive investments on maintenance and upgrades of defence. Whilst the defences may be built to a high-standard, such as the Dutch coastal policy of constructing flood defences with a 10,000 year return period, inevitably even the most improbable events do happen, and disaster can occur. Even those areas protected by flood protection measures are still exposed and potentially vulnerable: floods in New Orleans (2005), Thailand (2011), France (2011), and Germany (2021) (Fekete and Sandholz Citation2021) were characterised by a large number of breaches in flood defences.
It is therefore of ever-growing importance to expand the pool of case studies and knowledge of the SDP, to aid translation from research to policy and practice. The application of LiDAR (Light Detection and Ranging) presents a widely used method of fast and remote data collection, allowing for changes in the built environment in flood risk areas to be quickly identified. This allows for faster processing, risk identification, and detection of the hallmarks of the SDP: increasing exposed population and assets following a structural flood defence. Once the completion date of a structural project is known this method can be deployed using historic LiDAR data to compare development before the defence was upgraded/constructed to afterwards, identifying new buildings potentially linked to the structure. This paper presents a new method using readily available data, to assess the unintended consequences of structural coastal flood protection, using Portsmouth, Southport, and Weston-super-Mare as case studies. These findings will advance understanding of the SDP, and other coupled human-flood emergent phenomena.
Data and methods
The United Kingdom provides an ideal backdrop for an analysis of the unintended consequences of structural coastal flood protection due to the long history of coastal engineering (e.g. Palmer Citation2018) coupled with large amount of (largely open-access) geospatial data availability (e.g. Rumson et al. Citation2020). Geospatial data can facilitate analysis of comparative or historical changes in an urban environment, and will provide an essential component of SDP analysis.
Exploiting the time dimension of LiDAR differential analysis allowed for longitudinal analysis within this paper, showing changes in urban development, both before and after a structural coastal flood defences project. These changes in the height of buildings/urban landscape were statistically tested to identify significance. This analysis was employed as part of a case study approach, in order to assess urban development in tandem with local, national, and global economics, to unpick whether local FRM strategy had an unintended impact on urban layout, which facilitated cross-sectional comparative analyses. These combined analyses draw key insights by applying this approach to selected contrasting case study sites to better understand the SDP in coastal settings.
Study site selection
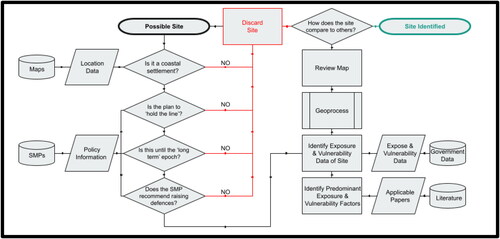
The study focused on coastal settlements that had seen a structural coastal flood risk management project (building new or upgrading existing flood defences) being completed, whilst neighbouring settlements did not across this same time period. To identify candidate case study sites, locations with the greatest flood exposure, defined as population and housing density, shops, local government buildings, essential transportation, telecommunications, and utility assets within the Flood Zone, FZ (0.1%AEP, Annual Exceedance Probability) and satisfy the above criteria were analysed. Furthermore, data on critical services and infrastructure, such as police, fire, and ambulance stations, hospitals, council buildings, supermarkets, and key transport hubs were identified from online sources (constabulary websites, county councils etc.). The comparative examination of these key elements on the maps combined with information on long-term Shoreline Management Plan (SMP) policy resulted in 3 candidate sites: providing a comprehensive overview to ensure a selection of representative case study sites (Rumson et al. Citation2020). illustrates the overarching approach for the site selection process.
Figure 1. The process of site selection.
Three contrasting case studies are identified: Southport, Weston-super-Mare, and Portsmouth, that fully satisfy the selection criteria (). Southport has the most significant amount of exposed infrastructure out of the three study sites, with a significant amount of the retail placed on the coastline, leaving food supply chains vulnerable (MacMahon et al. Citation2015). Weston-super-Mare had the largest area exposed of the sites, with the flat North Somerset Levels providing a large low-level hinterland for coastal flood water to proceed into. Furthermore, all essential services are in the exposed area, causing issues in the ability of critical sectors to provide services in the event of a flooding emergency. Portsmouth has a high population density in the exposed area, especially towards the southern tip of Portsea Island. Towards the north-east of the island, there is heavy industry placed in the FZ, threatening the local economy. Furthermore, Portsmouth is an island city and relies heavily on the Portsmouth Direct Line (railway) as well as the A2030 and A3/M275 road corridors for traffic in and out of the island. These access routes pass through flood zones, and are vulnerable to coastal flooding, endangering those on the heavily populated island. For the neighbourhood analysis, these primary locations were compared to other similar nearby settlements which did not have a structural coastal flood defence built over the period studied. These comparative locations provided a control for the study.
Differential analysis
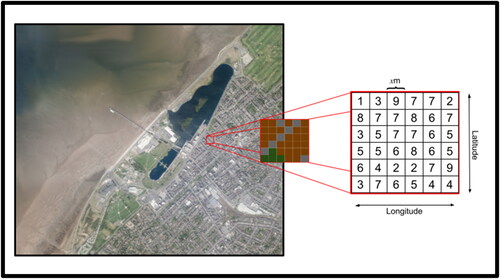
The study used historic LiDAR DSM raster datasets, obtained from the UK Environment Agency. These files had a resolution of 0.25, 1, or 2 m. Due to the nature of the study, analysing buildings, it is unlikely that such structures have a footprint less than 2 m2 (Heris et al. Citation2020) and therefore this combination of resolutions was considered sufficient. DSM files were selected from an equal number of years from before the local structural coastal flood defence was complete to afterwards, or the nearest year wherever possible. Rasters represent functionally large matrices of elevation data arranged in a grid with northings and eastings as row and column numbers, respectively (), and allow mathematical operations to be performed. Consequently, geospatial analysis is conducted to identify temporal changes in urban development of an area by subtracting two DSMs of the same location at different points in time, providing a DSM of Difference (DoD) (see EquationEquation 1(1)
(1) ).
(1)
(1)
Figure 2. Demonstration of the components of a geospatial raster. Elevation values are contained within the two-dimensional cell, size dependent on the resolution of the raster.
Where R1 is the oldest DSM and R2 is the most recent DSM. The DoD simulation procedure, estimating elevation change, has been described as DSM differencing or differential analysis, and is widely used in physical geography, e.g. assessing the evolution of drainage basins (Brasington and Smart Citation2003), detection and estimation of landslides (Tsutsui et al. Citation2007), and estimating the change in sediment budgets (Wheaton et al. Citation2009). While the simulation of DoDs to identify flood exposure and urban environment change is a novel approach, the use of DSMs has long been established in studying human settlements (e.g. Priestnall et al. Citation2000; Yan et al. Citation2015). Coupled with the large amount of research already using DSM differencing in physical geography, the analysis reported here also demonstrates knowledge transfer of the method to human geography.
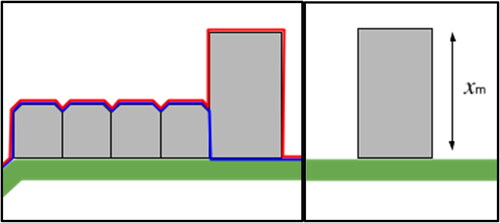
The simulated DoD of settlement shows direct change in the urban landscape across time, providing an accurate method of longitudinal urban analysis, with the accuracy of the model directly linked to the spatial resolution of the DSM input. A conceptual schematic of the modelling process is shown in . If the blue line represents an earlier DSM, say for example from 2010, and the red line represents a later DSM of the same location, for example 2020. Following EquationEquation 1(1)
(1) , urban change over the decade can be represented as shown in . Hence, the new high-rise building constructed between the DSMs will be the only difference, and theoretically all else will be zero. However, in reality, this is unlikely. Natural elements of the landscape can also change, resulting in an increasing effect the larger the period between the DSMs is, producing natural noise: trees grow, foliage develop, beach morphology, and even tides can affect the DoD. Nevertheless, natural noise and LiDAR artefacts can be reduced, or often eliminated due to their scale: with disregard to large tidal ranges, most natural growth/changes will be on the scale of centimetres (Sharma et al. Citation2010). Artificial structural changes would be primarily constructed for human habitation or use, providing a lower limit on identifying new development. This study assumes that a lower limit for identifying human-made construction to be 3 m (Erener et al. Citation2020) (for excluding the effect of natural growth and changes from the analysis).
Figure 3. Two DSMs overlaid: the blue line (older DSM) and the red line (newer DSM) (left panel); the resulting DoD (Xm) from the above differential analysis, using EquationEquation 1(1)
(1) (right panel).
Geostatistical testing
Due to the large size of the DSMs, containing thousands of observations, the central limit theorem and the law of large numbers apply, enabling parametric inferential statistical analyses (Mascha and Vetter Citation2018). However, to minimise the computational demand associated with the length or direction of some coastlines, a threshold limit is considered for the sampling. Iterative optimisation revealed that a 500 m by 500 m square was best for all resolutions, and enabled compatibility with smaller resolutions whilst also ensuring the stability of the program.
Samples were collected randomly using a transect along the urban coastline from DSMs that were captured an equal amount of time preceding the construction of the defence to afterwards, based on data availability. Maintaining time period consistency when conducting the neighbourhood analysis was essential for comparability and minimisation of external influences.
The sampled DSMs were then put through a t-test, where each pixel of the raster was compared to the exact same point at the chosen later point in time, where LR1 represents the selected pixel of R1, LR2 the selected pixel of R2 (EquationEquation 2(2a)
(2a) ). The raster t-test (EquationEquation 3
(3)
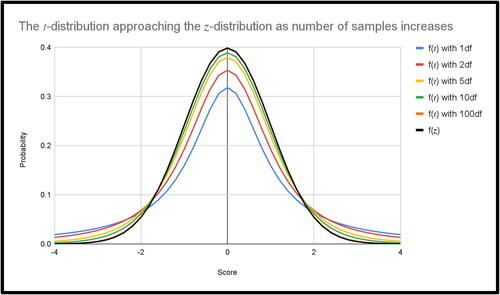
(3) ) then produced a t-statistic which was compared to the significance level (α = 0.05). Whilst a z-test should be used for large samples (n > 30) (Chang et al. Citation2006), at the time this was computationally not possible using R, and therefore t-test was used. However, at the large sample sizes provided by raster matrices, t-scores tend toward z-score (EquationEquation 4
(4)
(4) , ).
(2a)
(2a)
(2b)
(2b)
(3)
(3)
(4)
(4)
Figure 4. The t-distribution approaching the normal distribution as (n ➝ ∞), where the degree of freedom, df, is n-1.
Results
This section presents the key results and insights on the SDP based on the findings from the three contrasting coastal case study sites. The maps show the spatial footprint of the urban landscape change dynamics while the tables summarise the statistical analyses results.
Portsmouth
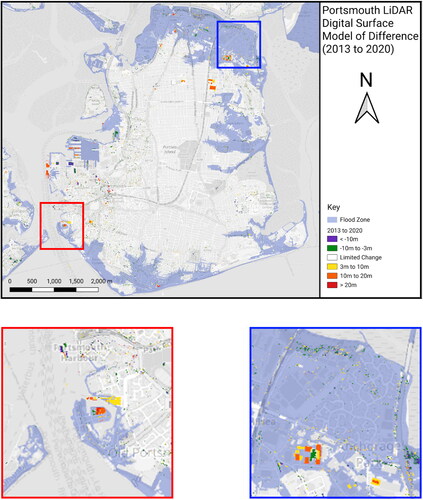
The Old Portsmouth and The North Portsea Coastal Scheme covers 10 km of the coastline of Portsmouth (), most of the area is low-lying and the structural coastal flood defences that existed there before the scheme were reaching the end of their operational life. Using LiDAR vertical change as a proxy for the construction of new buildings identified some urban development near to the first coastal defence upgrades in Portsmouth (): a new medium-density residential development. Elsewhere during this period, there was Admiralty Tower to the north of the new defence, but out of the Flood Zone, and the new industrial estate in the north-east of the island (). During the second wave of coastal flood defence schemes, mostly dominating the northern and eastern side of Portsea Island, more new buildings were constructed (). There were new industrial estates built in the Flood Zone in the northeast of the island, in areas near to NPCS Phase 1 (). The estate is entirely within the FZ and opened in 2018, two years after the flood defence scheme for that area of the island was constructed. This industrial estate, the largest industrial development in the city, brings 0.026 km2 of brownfield land back into use. The first phase of the North Portsea Coastal Scheme was designed to reduce the risk of flooding from the sea to 4,200 homes, 500 businesses and critical infrastructure over the next 100 years. The construction and upgrading of coastal flood defence structures can induce development within exposed areas greater than would otherwise be the case if the scheme was not conducted (Haer et al. Citation2020). Whereas Phase 2 and Phase 3 saw little development within the FZ boundary, both run alongside primarily outdoor recreation areas, limiting the ability to develop in these areas. The upcoming Phase 4, Phase 5, and Southsea scheme will give greater insights once they have been completed.
Figure 5. Map of the structural flood protection schemes development across Portsea Island from 2000 to 2020. This map does not include the currently in development Southsea scheme.
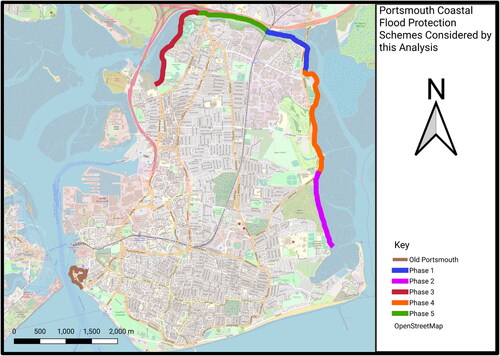
Figure 6. Portsmouth 2005 and 2013 LiDAR DSM comparison. Southwest Portsmouth extract is inset (OpenStreetMap).
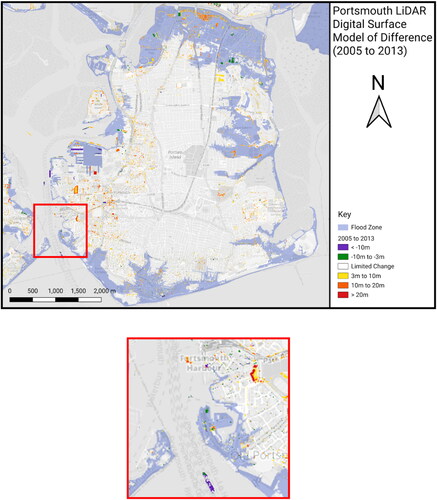
Figure 7. Portsmouth 2013 and 2020 LiDAR DSM comparison. Southwest and northwest Portsmouth extracts are inset (OpenStreetMap).
In southwest Portsmouth, a large new commercial centre was built on the seafront at Old Portsmouth () constructed 10 years after the original flood protection scheme was constructed. Thereafter, other new medium-scale development was constructed in the area, completed in 2019 as part of the upgrades to the WightLink ferry terminal. All within the Flood Zone.
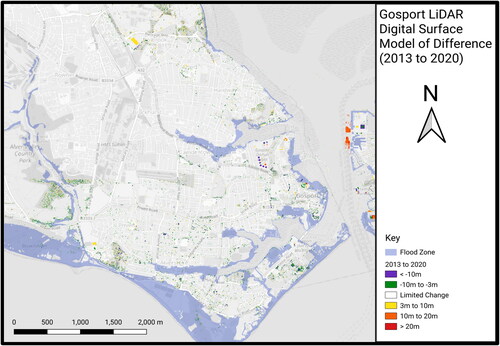
Similarly, the construction of new buildings also occurred in Gosport, and whilst a lower density development than those in Portsmouth, there were still numerous new buildings (), leading to the both having statistically significant results from the geostatistical testing for this period. Although The t-score was lower in Gosport compared to Portsmouth (), being 0.053 and 0.329, respectively. These data reflect the changes that occurred in both locations, high-density development occurred in Portsmouth, and low-density in Gosport, however, this is more a reflection of the locations themselves: Portsmouth is already a city with a larger population, constrained by Portsea Island, whereas Gosport is relatively less populated.
Figure 8. Gosport 2005 and 2013 LiDAR DSM comparison (OpenStreetMap).
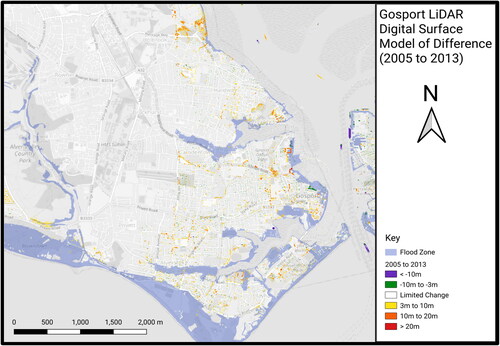
Table 1. The results of the portsmouth raster t-test comparing the 2002 raster to the 2013 raster, and the 2013 raster to the 2022 raster (3dp).
Whereas, in Gosport little development occurred outside of the Defence Munitions Gosport base (). Changes within military bases should not be considered as they are extraneous to factors affecting the civilian population. Across this period there was limited new development or urban growth in Gosport, represented by the failure of the 2013-2022 Gosport raster t-test to be statistically significant. Despite similar economic conditions affecting both areas, new development occurred mostly in Portsmouth, in flood exposed areas, near to newly constructed or upgraded structural flood defences, as identified by the LiDAR differential analysis ─ this is a direct indication of the SDP.
Figure 9. Gosport 2013 and 2020 LiDAR DSM comparison (OpenStreetMap).
Weston-super-Mare
Upgrades to the structural coastal flood defence at Weston-super-Mare were completed in 2010. Past coastal flooding events have extended beyond the frontage properties into the town centre and up to one mile from the seafront. The scheme aimed to protect 3,830 residential and 637 commercial properties from flooding and improve the quality of the promenade for businesses, residents and visitors, to provide a major boost to the tourism trade and economic prosperity of the area. Meanwhile, the LiDAR DoD, produced by the differential analysis, suggests that a great amount of new development occurred over this period (). Starting from the west and heading eastwards, the map shows new development on the pier, a new 5-10 m tall building, most likely the 2010 pier reconstruction following the fire in 2008. Continuing eastwards to the bulk of the new urban development where many tall buildings were constructed, and a couple of buildings were demolished, reflected in the map (). Buildings to the south of the development were completed by 2014, whereas proceeding north the buildings were complete by 2018. Construction for all projects in this core started after the coastal flood defence upgrades were complete. Proceeding further east, there are two new residential estates constructed between 2012 and 2015. All of these new developments in Weston-super-Mare are located within the FZ. However, in contrast, there was little development in the nearby town of Clevedon () and in Burnham-on-Sea there was the construction of a small housing estate 2 km from the coastline (). Weston-super-Mare had statistically significant change of 0.622 (3 dp, ≤0.05 p-Value), compared to −0.052 (0.065 p-Value) for Burnham-on-Sea and 0.005 (0.143 p-Value) for Clevedon (). With such low t-scores for both, Burnham-on-Sea and Clevedon, and a p-Value greater than the 0.05 𝛼-level, only Weston-super-Mare had statistically significant change from before its coastal flood defence was upgraded compared to afterwards.
Figure 10. Weston-super-Mare 2003 and 2022 LiDAR DSM comparison. Northwest Weston-super-Mare is inset (OpenStreetMap).
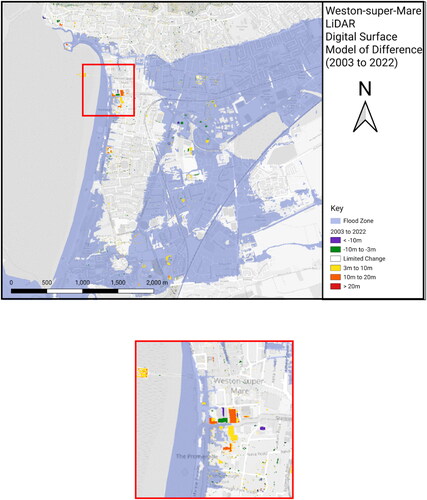
Figure 11. Clevedon LiDAR 2003 to 2022 DSM comparison (OpenStreetMap).
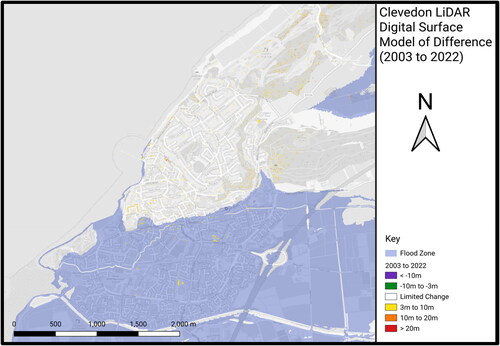
Figure 12. Burnham-on-Sea LiDAR 2003 to 2022 DSM comparison (OpenStreetMap).
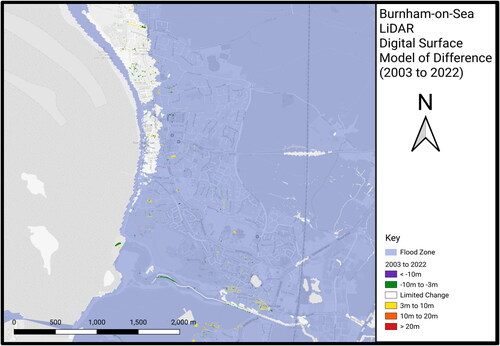
Table 2. The results of the Weston-super-Mare raster t-test comparing the 2007 raster to the 2014 raster, and likewise for the Burnham-on-Sea and Clevedon rasters (3dp).
Southport
New urban development following a structural coastal flood defence scheme was also apparent in Southport, whereby following the construction of the structural coastal flood defence in 2002 was followed by a large increase in building construction in the area adjacent, all within the FZ (). This new development, Ocean Plaza, adjacent to the newly constructed structural coastal flood defence (), was completed in 2002, with extensions to the site in 2004, linking the new retail park to the town centre. In contrast, Crosby () saw little coastal development, and none in the FZ. Likewise, for Blackpool, which over the 1999 to 2022 period saw urban growth around the railway station in the centre and a new stadium built towards the south, but none occurring in the FZ (). The construction of the seawall began in 1997, taking 5 years, whilst the planning application for the Ocean Plaza retail park was received in 2000. Despite the inherent flood risk to the area, the retail park was constructed, as the LiDAR analysis demonstrates. This growth in Southport is also demonstrable statistically, which had statistically significant change in urban development of 2.548 (3 dp, ≤0.05 p-Value), compared to 0.043 (0.872 p-Value) in Blackpool across the same time period (). The large urban growth in Blackpool () around the railway station was built as part of the Talbot Gateway project, approved in 2010 and then again in 2016, and is a large regeneration project, hence would not be picked up by the geostatistical analysis of Blackpool. In Crosby, between 2002 and 2008, the t-test produced a score of −0.137 (0.211 p-Value) (). However, similar to Burnham-on-Sea, it is unlikely that Crosby encountered negative growth: growth in the town was so limited that the lower bound of the t-score pushed into the negative.
Figure 13. Southport 1999 and 2022 LiDAR DSM comparison. Central-west Southport is inset (OpenStreetMap).
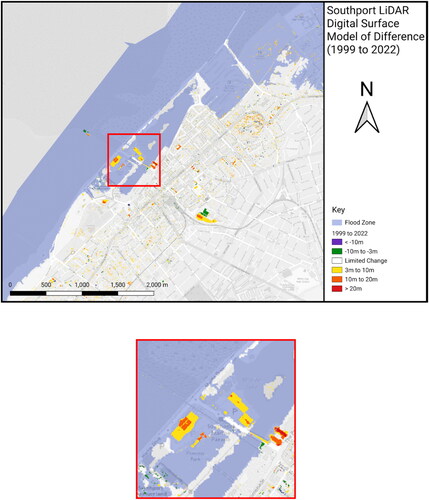
Figure 14. Crosby LiDAR 2002 to 2022 DSM comparison (OpenStreetMap).
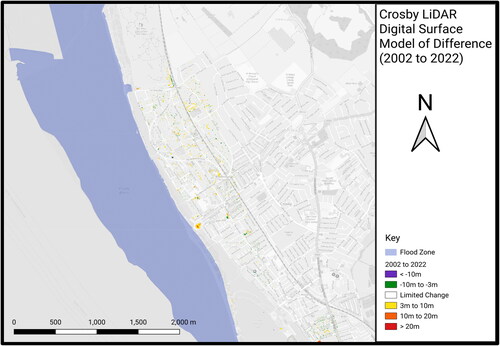
Figure 15. Blackpool LiDAR 1999 to 2022 DSM comparison (OpenStreetMap).
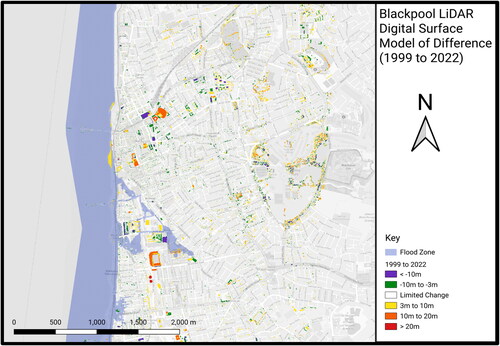
Table 3. The results of the Southport raster t-test comparing the 2007 raster to the 2014 raster, and likewise for the Blackpool and Crosby rasters (3dp).
Case study synthesis
All three primary study sites experienced statistically significant growth at the coastline (). Moreover, these new developments were adjacent to newly constructed structural coastal flood defences. Whereas, this was not the case in 4 of the 5 comparative studies: Clevedon and Burnham-on-Sea did not see the same growth as Weston-super-Mare, Blackpool and Crosby did not see the same growth as Southport, and Gosport did not see the same growth as Portsmouth in the 2013 to 2020 comparison. The exception to this, however, is Gosport in the 2005 to 2013 output which saw statistically significant growth, albeit with a t-score a sixth of that of Portsmouth, reflecting low, but significant, urban growth in the area ─ a regeneration of the Royal Clarence Yard, a project ongoing since the 1990s.
Table 4. Summary table of the results from the raster t-tests in primary locations. These locations had a structural coastal flood defence constructed halfway between the rasters mentioned (3dp).
Southport had the greatest t-score of the three case studies (), reflecting the large-scale growth that occurred on the coastline from the Ocean Plaza development. Whereas, of the three primary sites, Portsmouth (2005 to 2013) had the lowest t-score, reflecting the smaller scale medium density growth at the site during this time. However, it is clear from the data that structural coastal flood defence projects have an impact on urban development and that this is determinable using statistical analyses.
Discussion
As a phenomena, the coupled human-flood feedback of the SDP (also levee effect or safety dilemma) is relatively understudied, especially in coastal settings. Since its inception in 1945 (White Citation1945), research has been limited over the twentieth century, before increasing over the past two decades (e.g. Haer et al. Citation2020; Breen et al. Citation2022). The interlinks of policy and decision-making, and its potential lock-in effects, played out in the lead up to and aftermath of Hurricane Katrina and the subsequent damages to New Orleans, leading to the emergence of the terminology Safe Development Paradox, SDP (Burby Citation2006).
Despite the increases in research output, coastal research of the topic is limited, accounting for only 17% of all papers researching this emergent phenomena (Breen et al. Citation2022). The method presented here, used to identify development linked to the upgrade of existing or construction of a new coastal flood defence, can help accelerate case study identification with the effect of having great impact on the existing sparse literature. LiDAR is frequently used in the coastal research community such as for mapping shoreline changes (Lin et al. Citation2019); identifying nearshore submerged and emergent ecosystems, coastal morphodynamics, and hazards created by SLR and storms (Brock and Purkis Citation2009); and determining vegetation height (Schmid et al. Citation2011). Furthermore, the use of LiDAR has even been discussed within papers researching these coupled human-flood feedbacks, albeit a limited amount in the discussion of how LiDAR can be used to estimate elevation compared to local sea level (Gesch Citation2009; Armstrong and Lazarus Citation2019; Jiao et al. Citation2022). Moreover, the use of LiDAR has had application in the identification and delineation of new urban construction: there are papers that reference the use of LiDAR to aid three-dimensional modelling and the extraction of property dimensions, and how changes in LiDAR can be used to update city maps with new development (Chen and Lin Citation2010; Zhou et al. Citation2020). Yet these have never previously been combined as a method for the identification of potential coupled human-flood feedbacks between coastal flood defence upgrade or construction and associated increases in urban development. This paper addresses that gap focusing on the selected UK case studies of Portsmouth, Weston-super-Mare, and Southport, representing contrasting settlement sizes with different economies. The quantity of the freely available geospatial data within the UK provides an ideal test bed, however, future research should endeavour to increase the internationality of this research and further global reach of SDP research, especially within the Global South (Breen et al. Citation2022).
The case study results reported in this paper also highlight the challenges in (re)developing a coastline: often these locations have either been previously developed, limiting scope in the size and density of such structures, and/or are being constrained by the sea itself. Moreover, the (re)development of these coastal brownfield sites are unlikely to withstand the front-loaded costs of regeneration, especially in weak economies (Leger et al. Citation2016). Coastal regeneration and (re)development schemes often face viability issues due to their peripheral locations and narrow local economies, frequently relying on a single industry and facing interdependency challenges with other sectors and/or regions. This is compounded by the economic circumstances of the study sites in the years following the Great Recession, which created greater pressure on greenfield land in coastal areas, rather than brownfield (Leger et al. Citation2016). The analysis also highlighted that the new exposed urban development in Portsmouth occurred 5 years after the completion of the initial structural coastal flood defence in 2005. The second tranche of development was built from 2017 to 2019, 3 years after the North Portsea Island Coastal Scheme Phase 1. In Weston-super-Mare, the LiDAR analysis revealed that new buildings were constructed across the 2014 to 2018 period, all within the FZ. These were built 4 to 8 years following the coastal flood defence upgrades. Then, in Southport, the analysis revealed that the retail estate was completed later in the same year as the structural coastal flood defence scheme, and then continued two years after until 2004. These are represented in the timeline below (). Phase 2 and Phase 3 of the North Portsea Coastal Scheme are not included due to a lack of definitive exposed development. Whilst some development also occurred in non flood-prone areas, medium to large scale development consistently was constructed in exposed areas hydrologically connected to the new structural coastal flood defence in all three primary sites. This consistency was not replicated in the comparative sites.
Figure 16. Relative timeline of structural coastal flood defence construction or upgrading (dashed) and nearby exposed urban development (solid) since the start of the scheme. Portsmouth arrows are colour-coordinated to those used to schemes with associated development in .
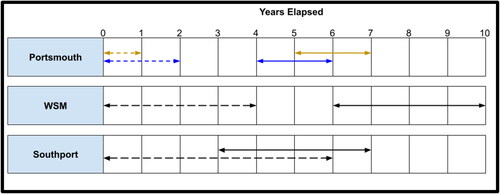
The timeline () suggests that the largest gap between the completion of a defence to the start of associated urban development was 5 years, at Old Portsmouth. The second iteration of exposed development from Phase 1 took place 2 years after the completion of the defence. The average time from the completion of the defence to the start of construction of the exposed buildings was approximately 2 years.
Conclusion and outlook
As the coastal population continues to increase and as sea levels rise, challenges at the interface between these two spheres will become more commonplace: more people need more housing, more assets, more infrastructure, leading to an increasing amount in flood-prone areas and therefore inevitably requiring a greater standard of protection. The SDP is a product of this, an infrastructural lock-in of coupled human-flood interactions induced by structural flood protection. Whilst research concerning this issue is growing, there is a skewed focus towards fluvial flooding, with limited understanding of the issue in a coastal context. Therefore, a method of identifying new urban development within flood risk areas and adjacent to these structural coastal defence structures would facilitate the research of new comparative case studies and increase the global coverage of study sites and draw generalisable lessons about the SDP in coastal areas. LiDAR has been used in adjacent scientific fields for decades now, the technology is proven and is employed widely, but its use in flood-exposed urban development identification is novel. It presents a quick and easily replicable method for the identification of the emergence of these potential lock-ins.
This paper used Portsmouth, Weston-super-Mare, and Southport as case studies, comparing them to nearby settlements to draw key insights and to better understand the issues of SDP in coastal areas. Geostatistics were used in the three case studies, a differential analysis comparing two rasters of the same location across time to identify changes between the images, and a raster t-test to determine whether these changes were statistically significant. In all three locations, the construction or upgrading of structural coastal flood defence is followed by subsequent, and statistically significant, urban development, an indication of the presence of the SDP. All major new development in each case study was located within, or just outside of the FZ: despite the inherent flood risk, construction occurs in these exposed areas regardless. On average, this development occurs approximately 2 years from the completion of the flood defence project, and the start of building construction.
Case studies were diverse, representing different settlement sizes and economies, to give an insight and testing the operability of the method across varying urban magnitudes. Portsmouth is an established city with a sizable population and independent and multilayer economy, Weston-super-Mare and Southport are smaller towns, Weston-super-Mare independent, and Southport economically tied to Liverpool. The size of a settlement had an impact on the density and type of development, Portsmouth had residential high-rises and large-scale industrial estates constructed in the FZ and adjacent areas. Weston-super-Mare had a mixture of high-density residential and medium-density service construction, with a new hotel, car park, restaurant, and retail centre built. Southport growth was primarily focused at the new retail centre, with low-density large-scale development. Whilst case studies share the commonalities of post-defence exposed urban development, the distinct characteristics of each location contribute to the variations in how this development occurs. These nuances highlight the complexity of the SDP issue and the need for context-specific analyses in understanding the interplay between structural coastal flood defence and subsequent urban growth. Studying new locations, especially globally, can help to expand the information base and gain better insights into these phenomena. Facilitating high-resolution LiDAR data collection, in assessing the coupled human-flood interactions induced by structural coastal flood protection, can aid in the pursuit of solutions and the development of policy that can aim to prevent these potential infrastructure lock-ins as greater protection incites greater development which necessitates further higher protection, resulting in the locked-in cycle, i.e. the SDP, highlighting the need for further research.
Disclosure statement
The authors declare no conflict of interest.
Additional information
Funding
References
- Armstrong S, Lazarus E. 2019. Reconstructing patterns of coastal risk in space and time along the US Atlantic coast, 1970-2016. Nat Hazards Earth Syst Sci. 19(11):2497–2511. doi:10.5194/nhess-19-2497-2019.
- Brasington J, Smart R. 2003. Close range digital photogrammetric analysis of experimental drainage basin evolution. Earth Surf Processes Landf. 28(3):231–247. doi:10.1002/esp.480.
- Breen MJ, Kebede AS, König CS. 2022. The safe development paradox in flood risk management: a critical review. Sustainability. 14(24):16955. doi:10.3390/su142416955.
- Brock P, Purkis J. 2009. The emerging role of lidar remote sensing in coastal research and resource management. J Coast Res. 10053:1–5. doi:10.2112/SI53-001.1.
- Burby R. 2006. Hurricane Katrina and the paradoxes of government disaster policy: bringing about wise governmental decisions for hazardous areas. Ann Am Acad Polit Soc Sci. 604(1):171–191. doi:10.1177/0002716205284676.
- Burton C, Cutter S. 2008. Levee failures and social vulnerability in the Sacramento-San Joaquin Delta Area, California. Nat Hazards Rev. 9(3):136–149. doi:10.1061/(ASCE)1527-6988(2008)9:3(136).
- Chang H, Huang K, Wu C. 2006. Determination of sample size in using central limit theorem for Weibull distribution. Int J Inf Manage Sci. 17(3):31–46.
- Chen L, Lin L. 2010. Detection of building changes from aerial images and light detection and ranging (LIDAR) data. J Appl Remote Sens. 4(1):041870. doi:10.1117/1.3525560.
- Di Baldassarre G, Kooy M, Kemerink J, Brandimarte L. 2013b. Towards understanding the dynamic behaviour of floodplains as human-water systems. Hydrol Earth Syst Sci. 17(8):3235–3244. doi:10.5194/hess-17-3235-2013.
- Di Baldassarre G, Viglione A, Carr G, Kuil L, Salinas J, Blöschl G. 2013a. Socio-hydrology: conceptualising human-flood interactions. Hydrol Earth Syst Sci. 17(8):3295–3303. doi:10.5194/hess-17-3295-2013.
- Erener A, Sarp G, Karaca M. 2020. An approach to urban building height and floor estimation by using LiDAR data. Arab J Geosci. 13(19):1005. doi:10.1007/s12517-020-06006-1.
- Eriksen S, Schipper L, Scoville-Simonds M, Vincent K, Adam H, Brooks N, Harding B, Khatri D, Lenaerts L, Liverman D, et al. 2021. Adaptation interventions and their effect on vulnerability in developing countries: help, hindrance or irrelevance? World Dev. 141:105383. doi:10.1016/j.worlddev.2020.105383.
- Fekete A, Sandholz S. 2021. Here comes the flood, but not failure? Lessons to learn after the heavy rain and pluvial floods in Germany 2021. Water. 13(21):3016. doi:10.3390/w13213016.
- Gesch D. 2009. Analysis of lidar elevation data for improved identification and delineation of lands vulnerable to sea-level rise. J Coast Res. 10053:49–58. doi:10.2112/SI53-006.1.
- Haer T, Husby T, Botzen W, Aerts J. 2020. The safe development paradox: an agent-based model for flood risk under climate change in the European Union. Global Environ Change. 60:102009. doi:10.1016/j.gloenvcha.2019.102009.
- Hallegatte S, Green C, Nicholls R, Corfee-Morlot J. 2013. Future flood losses in major coastal cities. Nature Clim Change. 3(9):802–806. doi:10.1038/nclimate1979.
- Heris M, Foks N, Bagstad K, Troy A, Ancona Z. 2020. A rasterized building footprint dataset for the United States. Sci Data. 7(1):207. doi:10.1038/s41597-020-0542-3.
- Jiao S, Li W, Wen J. 2022. Spatiotemporal changes of manufacturing firms in the flood-prone Yangtze Delta. Environmental Hazards. 21(4):334–360. doi:10.1080/17477891.2021.1988502.
- Kates R, Colten C, Laska S, Leatherman S. 2006. Reconstruction of New Orleans after Hurricane Katrina: a research perspective. Proc Natl Acad Sci USA. 103(40):14653–14660. doi:10.1073/pnas.0605726103.
- King R. 2005. Hurricane Katrina: insurance losses and national capacities for financing disaster risk. Government and Finance Division.
- Leger C, Balch C, Essex S. 2016. Understanding the planning challenges of Brownfield development in coastal urban areas of England. Plann Pract Res. 31(2):119–131. doi:10.1080/02697459.2016.1146428.
- Lin Y, Cheng Y, Zhou T, Ravi R, Hasheminasab S, Flatt J, Troy C, Habib A. 2019. Evaluation of UAV LiDAR for mapping coastal environments. Remote Sens. 11(24):2893. doi:10.3390/rs11242893.
- Ludy J, Kondolf G. 2012. Flood risk perception in lands “protected” by 100-year levees. Nat Hazards. 61(2):829–842. doi:10.1007/s11069-011-0072-6.
- MacMahon A, Smith K, Lawrence G. 2015. Connecting resilience, food security and climate change: lessons from flooding in Queensland, Australia. J Environ Stud Sci. 5(3):378–391. doi:10.1007/s13412-015-0278-0.
- MacManus K, Balk D, Engin H, McGranahan G, Inman R. 2021. Estimating population and urban areas at risk of coastal hazards, 1990–2015: how data choices matter. Earth Syst Sci Data. 13(12):5747–5801. doi:10.5194/essd-13-5747-2021.
- Magnan A, Schipper E, Burkett M, Bharwani S, Burton I, Eriksen S, Gemenne F, Schaar J, Ziervogel G. 2016. Addressing the risk of maladaptation to climate change. WIREs Clim Change. 7(5):646–665. doi:10.1002/wcc.409.
- Mascha E, Vetter T. 2018. Significance, errors, power, and sample size: the blocking and tackling of statistics. Anesthia Analg. 126(2):691–698. doi:10.1213/ANE.0000000000002741.
- Montz B, Tobin G. 2008. Livin’ large with levees: lessons learned and lost. Nat Hazards Rev. 9(3):150–157. doi:10.1061/(ASCE)1527-6988(2008)9:3(150).
- Palmer R. 2018. History of coastal engineering in Great Britain. Hist Heritage Coast Eng. 6:214–274. doi:10.1061/9780784401965.006.
- Priestnall G, Jaafar J, Duncan A. 2000. Extracting urban features from LiDAR digital surface models. Comput Environ Urban Syst. 24(2):65–78. doi:10.1016/S0198-9715(99)00047-2.
- Rumson A, Garcia A, Hallet S. 2020. The role of data within coastal resilience assessments: an East Anglia, UK, case study. Ocean Coast Manage. 185:105004. doi:10.1016/j.ocecoaman.2019.105004.
- Schmid K, Hadley B, Wijekoon N. 2011. Vertical accuracy and use of topographic LIDAR data in coastal marshes. J Coast Res. 275(6A):116–132. doi:10.2112/JCOASTRES-D-10-00188.1.
- Sharma M, Paige G, Miller S. 2010. DEM development from ground-based LiDAR data: a method to remove non-surface objects. Remote Sens. 2(11):2629–2642. doi:10.3390/rs2112629.
- Siegert M. 2015. Sea level change. Grantham Institute.
- Tobin G. 1995. The Levee love affair: a stormy relationship? J Am Water Resour Assoc. 31:359–367. doi:10.1111/j.1752-1688.1995.tb04025.x.
- Tsutsui K, Rokugawa S, Nakagawa H, Miyazaki S, Cheng C, Shiraishi T, Yang S. 2007. Detection and volume estimation of large-scale landslides based on elevation-change analysis using DEMs extracted from high-resolution satellite stereo imagery. IEEE. 45(6):1681–1696. doi:10.1109/TGRS.2007.895209.
- Wheaton J, Brasington J, Darby S, Sear D. 2009. Accounting for uncertainty in DEMs from repeat topographic surveys: improved sediment budgets. Earth Surf Processes Landf. 35(2):136–156. doi:10.1002/esp.1886.
- White G. 1945. Human adjustment to floods. Chicago: University of Chicago.
- Yan W, Shaker A, El-Ashmawy N. 2015. Urban land cover classification using airborne LiDAR data: a review. Remote Sens Environ. 158:295–310. doi:10.1016/j.rse.2014.11.001.
- Zhou K, Lindenbergh R, Gorte B, Zlatanova S. 2020. LiDAR-guided dense matching for detecting changes and updating of buildings in Airborne LiDAR data. ISPRS J Photogramm Remote Sens. 162:200–213. doi:10.1016/j.isprsjprs.2020.02.005.