
 ?Mathematical formulae have been encoded as MathML and are displayed in this HTML version using MathJax in order to improve their display. Uncheck the box to turn MathJax off. This feature requires Javascript. Click on a formula to zoom.
Abstract
In this article, the failure mechanism of the tunnel under geohazard fault movement and non-uniform seismic load was studied. The study area considered was Atal Tunnel in Himachal Pradesh, India, in the North-West of the Himalayas. A normal fault of 10 m width was considered by varying the fault dip angles of 30°, 45°, 60°, 75°, and 90° along with Geological Strength Index (GSI) values of 20, 40, 60, and 80. The finite element models were analysed under fault movement and 4 ground motions. A fault movement of 0.5 m was applied at the bottom of the fault and hanging wall area. The results showed that fault with 60° dip angle produced more structural forces in tunnel lining under fault movement. The fault with 20 GSI rock mass exhibited higher structural forces in the tunnel lining, irrespective of dip angle. In the case of seismic load, a smaller dip angle generates more structural forces. The tunnel lining in the hanging wall experienced more tensile damage, especially in the direction of seismic wave propagation. The left and right sides of the lining in the footwall area underwent tension, whereas the tunnel crown and bottom experience compression under seismic load.
1. Introduction
Developing countries like India’s economic growth is significant. As per Asian Development Bank (ADB), the GDP growth is expected at 6.4% in 2023 and 6.7% in 2024 (World Bank Citation2023). The transportation sector contributes a considerable percentage of the national GDP in development. In Indian scenario, the construction of Atal Tunnel at Leh—Manali Highway is one of the significant achievements of the Border Roads Organization (BRO). As per National Highways and Infrastructure Development Corporation Limited, approximately 280 tunnels with a total length of roughly 890 km are projected to be completed by 2021–2022, and 137 tunnels with long gestation periods are expected to be finished by 2026 (National Highways and Infrastructure Development Corporation Citation2023). This elucidated that the demand for tunnel construction is exponentially increasing these days.
The dynamic interaction and the environmental conditions shall be taken into consideration when designing subsurface infrastructures such as subways, metro tunnels, and other buried facilities in large cities (Liu et al. Citation2021; Yu and Wang Citation2021). In olden days, a significant amount of numerical and experimental study had been conducted on surface settlements resulting from the development and presence of subsurface infrastructure/underground utilities (Chen et al. Citation2019; Citation2022; Shi et al. Citation2022). Various researches have considered the slip between the tunnel lining and surrounding soil. Many researchers studied the effect of tunnel lining due to full slip and no slip conditions and compared it with analytical solutions (Do et al. Citation2015; Sun and Dias Citation2019). Full slip refers to no friction between the lining and surrounding soil, and no slip indicates the absence of interaction between the soil and lining.
Investigation on the effect of fault movement in tunnel lining by varying the width of the fault and segmental length of the lining has been carried out. The results illustrated that increasing the fault width increases the compressive stresses in the lining (Wen et al. Citation2021). A numerical study has been performed by considering (a) continuous lining and (b) lining with fibre plastic concrete as flexible joints. The results showed that the structural forces in the tunnel lining were significantly reduced by using fibre plastic concrete as flexible joints when compared to lining without joints. The study also included 22 cm strike-slip displacement in the hanging wall by considering 100 years life span of the tunnel (as fault slippage occurs at a rate of 2.2 mm/year) (Zhao et al. Citation2019). A closed form solution was only used for tunnels embedded in a single soil layer; research was carried out to find the structural forces in the tunnel lining. The results demonstrated that tunnels embedded between two layers produced more bending moments. However, when the bottom layer is stiff, the lining experiences more axial force (Gomes et al. Citation2015).
Seismic microzonation of the Jammu Region in the Himalayas has been carried out by Ansari et al. (Citation2024) to assess the seismic risk of Udhampur Srinagar Baramulla Rail Link (USBRL) project. The report suggests that the microzonation map and risk assessment can be used for the earthquake-resistant design of sustainable infrastructure projects in the Jammu region (Ansari et al. Citation2024). The risk matrices developed in the study can be used by tunnel designers, engineers, and risk management authorities to understand the post-seismic functionality of infrastructures (Ansari et al. Citation2023a). Also, research was carried out to develop a multi-hazard damage prediction model using Artificial Neural Network for tunneling projects. The model showed good performance in both the training and testing phases, with high accuracy and sensitivity values (Ansari et al. Citation2023a). The Seismic Tunnel Damage Prediction (STDP) model has been developed to predict tunnel damages. The feedforward neural network (FNN) and ‘STD multiple graphs’ were used for damage indexing, damage pattern, and crack predictive specifications (Ansari et al. Citation2023b). Seismic vulnerability study of tunnels located in the Jammu and Kashmir region was carried out by Ansari et al. The reports clarified that Zone A (soft soil) is more seismically vulnerable than Zone B and Zone C (weathered rock mass) (Ansari et al. Citation2023a). Many research works were caried out by varying fault width and angle of fault, material qualities, and thickness of tunnel lining, spacing, and properties of flexible joints. However, Geological Strength Index (GSI) variation is yet to be considered in studies related to tunneling with fault movement.
The present study is significant as most active faults in the Himalayas are located near the boundary between the Indian and Eurasian tectonic plates. The study area is the Atal tunnel in Himachal Pradesh, North-West of the Himalayas. Many researchers in tunnel related studies considered Rock Quality Designation (RQD), Rock Mass Rating (RMR), and Q index for classifying the rock masses to study the structural forces and deformation in the tunnel lining. The main drawback of using the RMR and Q index rock classification systems is that they cannot be used for very poor-quality rock masses. Because these systems predict linear failure envelop instead of nonlinear curves for highly weathered rock mass (Renani and Cai Citation2022). Hoek and Brown introduced GSI as a replacement for the RMR system to overcome the shortcomings of the RMR classification system. Based on the authors understanding, very little work has been reported on tunnel lining to study the failure mechanism under fault movement, considering the variation of GSI values. Based on the shortcomings of previous research, this article aims to evaluate the effect of both the fault dip angle and GSI on tunnel lining. Fault dip angles of 30°, 45°, 60°, 75°, and 90° are used, along with GSI values of 20, 40, 60, and 80. Fault movement of 0.5 m and four different ground motions are used in this study to investigate the failure mechanism of tunnel lining.
2. Numerical modelling of tunnel with fault movement
2.1. Sensitivity analysis and boundary effect
A sensitivity analysis was carried out to evaluate the effect of soil block size on the numerical results based on trial and error method. The tunnel diameter adopted was 8 m, and for the first trial the soil lateral boundaries were kept more than 6D (6 times the diameter of the tunnel). A model of size 200 × 50 × 50 m (L × B × H) was created, and subsequently, the model size was increased until the deformation had no further changes. A fault displacement of 0.5 m was applied at the bottom of the fault and hanging wall area, and a ground motion was used at the bottom of the model in the X direction. For the fault movement phase, normally fixed boundary conditions were applied along the sides of the model, whereas the footwall was fixed at the bottom. In the case of the dynamic phase, free field boundary conditions were applied at the sides, and compliant base boundary conditions were used at the bottom of the soil block. Based on the displacement criteria, the optimum size of model was found to be 200 × 80 × 80 m.
A mesh convergence study was also conducted to determine the optimum size of the meshing. Very fine mesh produces a large number of elements and leads to more analysis time; it is essential to perform the mesh convergence study. Both the soil and the tunnel were discretized using the default in-built mesher. Based on the sensitivity analysis, the model was not affected by the degree of mesh refinement and the boundary conditions.
2.2. Validation through numerical modelling
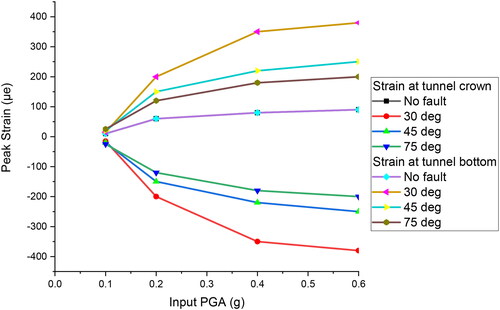
Validation has been carried out by considering previous research on shake table to study the dynamic response of tunnels with various fault dip angles (Zhu et al. Citation2021). Numerical models were created with the size specified in the research work and with dip angles of 30°, 45°, and 75°. Peak Ground Accelerations (PGA) of 0.1, 0.2, 0.4, and 0.6 g were used with sine waves of frequencies 5, 7.5, and 10 Hz. The peak strain and accelerations were monitored at various sections along the length of the tunnel. The shows the variation of peak strain for different dip angles and PGA at the tunnel crown and bottom at section C-C (centre of the tunnel along the length). These values agree with the experimental values obtained in shake table testing.
Figure 1. Validation—Peak strain variation for different dip angles.
2.3. Finite element numerical modelling
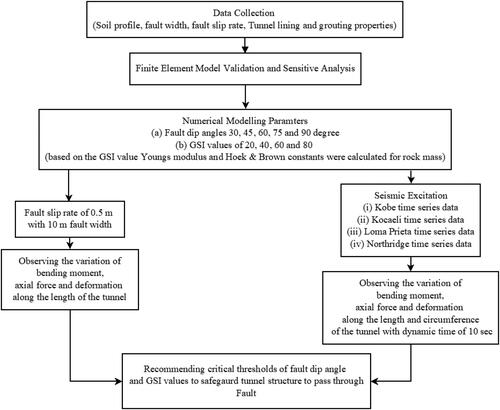
The numerical analyses were performed using the finite element programming tool PLAXIS 3D. In this study, 200 × 80 × 80 m (L × B × H) size of the soil block was used based on the sensitivity analysis with medium mesh refinement. The tunnel excavation was carried out in the X direction. The tunnel diameter of 8 m was adopted with a lining thickness of 0.4 m. During the fault movement phase, normally fixed boundary conditions were applied on the sides of the soil model. At the bottom of the footwall, a fixed boundary condition was used. In the dynamic phase, a free field boundary condition was used on the sides, and a compliant base boundary condition at the bottom of the soil block. The flowchart of the methodology adopted is shown in .
Figure 2. Flowchart for methodology adopted.
The rocks present in the Himalayas are young and ranged from highly weathered to moderately weathered. In this study, Atal tunnel in Himachal Pradesh is chosen as it was constructed in challenging terrain and also the tunnel crosses an active fault. Mohr-Coulomb constitutive model was used for rocks in the Footwall and Hanging wall. The Hoek-Brown model was used to model the fault area, primarily for very poor and highly weathered rocks and jointed rock mass (Hoek and Brown Citation2019). The tunnel lining segments were modelled as plate elements with elastic properties, and grouting was modelled as linear elastic. The properties of rocks in the footwall, hanging wall, and fault zone were adapted from the Atal tunnel (Singh et al. Citation2017). The grade of concrete used to construct tunnel lining is M40. The properties of materials used in this study are listed in .
Table 1. Properties of materials.
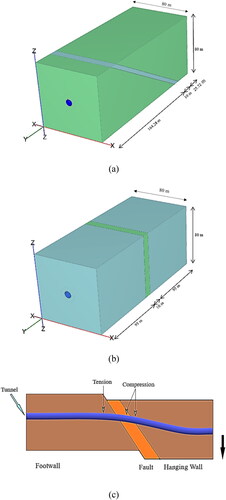
Five finite element models were created with different fault dip angles of 30°, 45°, 60°, 75°, and 90° and GSI values of 20, 40, 60, and 80. shows the numerical model for (a) 30° dip angle, (b) 90° dip angle, and (c) 2D representation of fault movement. A vertical downward displacement of 0.5 m was applied under the fault and hanging wall area to stimulate the fault movement. The effects on the tunnel lining were observed and discussed in detail. The entire Himalayas slips at an average rate of less than 5 mm/year (Bilham and Ambraseys Citation2005). Therefore, considering the life span of the tunnel as 100 years, a fault movement of 0.5 m (0.005 × 100) is adopted for this study.
Figure 3. Numerical model for (a) 30° dip angle, (b) 90° dip angle, and (c) 2D representation of fault movement.
The strength reduction factor is the ratio of the strength of selected soil corresponding to surrounding soil or friction between two different materials. A strength reduction factor (Rint) was set to be less than 1.0 to simulate the sliding effects. Surface-to-surface contact interaction has been assigned to the interface between the fault and the hanging wall. Similarly, the same interaction has been used in the interface between the fault area and the footwall. Thus, a surface was initially created between these interaction zones, and interfaces were activated. Therefore, a minimum strength reduction factor (Rint) value of 0.5 and Young’s modulus (E) value of 500 kN/m2 was defined.
Moreover, a negative interface was created for the tunnel lining to interact with the surrounding rock. A strength reduction factor (Rint) of 0.75 was considered, indicating the occurrence of partial slip during dynamic loading. Various researchers have mentioned that partial slips commonly occur between the tunnel lining and surrounding rock due to fault movement and earthquakes (Li and Chen Citation2018). According to the literature studies, it has been noticed that many analytical works have utilised both full slip and no-slip conditions. However, the interface shall generally be assigned between these two conditions (Li and Chen Citation2018). Numerous studies have reported that the value of Rint varies from 0.70 to 0.75 for the contact between the concrete and surrounding soil. It was found that the soil mass moved as a single mass without heaving (Lavasan et al. Citation2018).
As per Hoek-Brown Failure Criterion (Hoek and Brown Citation2019), the Uniaxial Compressive Strength (UCS) of rock mass (σc) is given by
(1)
(1)
Where σci is the uniaxial compressive strength of intact rock, ‘a’ is the rock mass material constant, which depends on the rock mass’s composition, structure, and surface condition of the rock mass, and ‘s’ is the degree of rock fragmentation. For intact rock (GSI = 100), the value of s = 1 and a = 0.5. For heavily jointed rock mass the value of s = 0 and a = 0.65. The exponent ‘a’ in the above EquationEquation (1)(1)
(1) is used to predict the shape of the failure envelope of the rock mass. The failure envelope changes from parabolic to a straight line when the constant ‘a’ increases from 0.5 to 1.0. Despite this, the latest version of Hoek and Brown limits the constant ‘a’ value from 0.5 to 0.6 (Hoek and Brown Citation2019). The value of ‘s’ and ‘a’ can be calculated as follows
(2)
(2)
(3)
(3)
The constants‘s’ and ‘a’ provides the opportunity for the researchers to adjust the friction, cohesive strength, and degree of nonlinearity of rock mass in the modified Hoek and Brown failure envelopes. A reduction in the values of constant ‘m’ reduces the frictional strength, and a smaller value of constant ‘s’ reduces the cohesive strength of the rock mass (Renani and Cai Citation2022).
Young’s Modulus of Rock Mass (Erm) is given by
(4)
(4)
where
D is the disturbance factor. The value of D is zero for tunneling carried out through Tunnel Boring Machine (TBM) and for high quality controlled blasting.
Ei is Young’s modulus of intact rock.
These values are calculated and tabulated in for Geological Strength Index values of 20, 40, 60, and 80.
Table 2. Hoek-Brown parameters.
2.3. Selection of ground motion for analysis
The ground motions of Kobe, Kocaeli, Loma Prieta, and Northridge were utilised for this study. All four ground motions were obtained from the Pacific Earthquake Engineering Research Center (PEER) ground motion database (PEER). The time history graphs of selected ground motions are shown in . As per the Uniform Building Code (UBC) Citation1994 (UBC Citation1994), the tunnel site is located in the Himalayas falls under Soil Type B based on the value of shear wave velocity. As the study aims to model and analyse the fault movement and seismic activity, two vital criteria were utilised to select the stations. Criteria 1 is the station that was situated near the rupture zone and criteria 2 is that the stations located on soil Type B. The stations located was within 60 km from the fault zone and on the soil with shear wave velocity between 760 m/s to 1500 m/s were selected to depict the original site condition. The deconvolution of seismic data was carried out using DEEPSOIL. The deconvoluted ground motions were then matched and applied at the base of the model. All four ground motions were matched with the targeted response spectra of Zone V (very severe intensity zone) and for Soil type I (rock or hard soils) as per Indian Standard Code 1893- 2016 (IS-1893-Part-1-(Citation2016) Citation2016) using the professional software SeismoMatch. The application was used to obtain the arias intensity of selected ground motions. shows the significant duration d5 - d95. This duration was used in this study to reduce the analysis time. The details of stations and relevant properties of selected ground motions are listed in .
Figure 4. (a) Time history graphs of selected ground motions and (b) displacement Vs time graph for selected ground motions up to 20 sec.
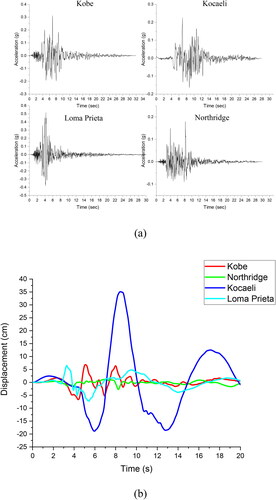
Figure 5. Arias intensity graphs of selected ground motions.
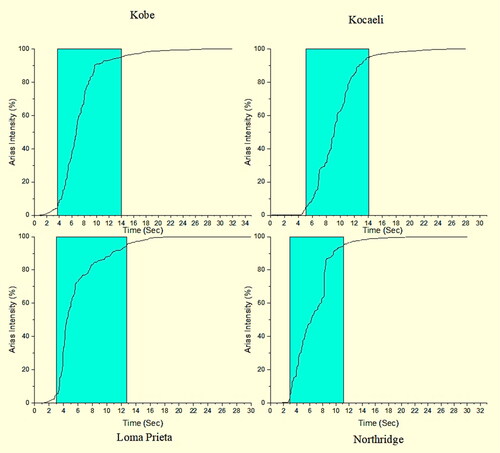
Table 3. Ground motion details.
3. Results and discussion
3.1. Fault movement
3.1.1. Bending moment variation in tunnel lining
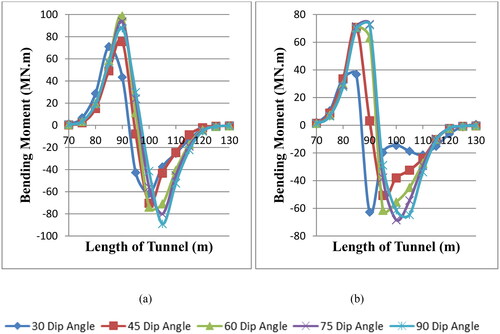
shows the distribution curve of bending moment variation along the length of the tunnel for different fault dip angles. It shows the influence of the GSI value on the bending moment in the tunnel lining is significant in the cases of smaller dip angles of 30°, 45°, and 60°. However, for larger dip angles, GSI has negligible influence on the bending moment in the lining. The peak values of bending moment in tension in the lining are reduced from 100 MN.m to 85 MN.m for increasing the dip angle from 60° to 90°. In the case of bending moment in compression, the value increases from 60 MN.m to 90 MN.m for dip angle from 30° to 90°. It shows that the 60° dip angle produces more tensile damage in the lining of the footwall, and the 90° dip angle produces more compressive damage in the lining of the hanging wall. At decreasing dip angles, the resistance caused by the development of frictional forces between the tunnel and surrounding rock increases. It creates more tension at the top of the tunnel.
Figure 6. Bending moment variation along the length of the tunnel for (a) 30° dip, (b) 60° dip, and (c) 90° dip at tunnel crown.
displays the localized bending moment distribution in the lining at the fault zone due to fault movement. The bending moment in the tunnel lining undergoes a significant change on either side of the fault zone; when moving away from the fault in both directions, the value stabilizes and decreases. In the vicinity of the fault zone, potential for water infiltration into the tunnel exists through the crown of the tunnel lining within the footwall region. As the lining experiences more tension, it creates tensile cracks, which may initially allow water movement. Since water around the lining percolates into the tunnel through cracks, and then the mud tries to enter the tunnel. The same problem also occurs at the crown of the lining in the hanging wall near the fault for higher dip angles, producing more compression cracks. The mud inrush can be prevented by providing the proper thickness of water sealants around the lining. In fault movement, arresting damage and controlling mud inrush is challenging. Therefore, the water sealant or polymer materials with high damping properties can effectively reduce the mud inrush into the tunnel. A comparable mechanism on various dip angles has been documented by Bao and Wei (Bao and Wei Citation2023)
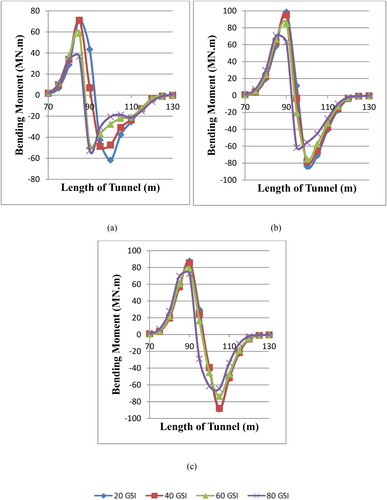
The distribution curve of bending moment variation along the length of the tunnel for different fault dip angles is shown in . The bending moment distribution curve shows zero bending moment apart from 70 to 120 m length. However, the bending moment is relatively less in these regions. It can be observed that the bending moment in the tunnel lining is least influenced by the dip angles, as reported by Bao and Wei (Citation2023). The peak value of bending moment in tension varies from 100 MN.m to 75 MN.m for increasing the GSI from 20 to 80. The peak value of bending moment in tension is smaller for 80 GSI when compared to other GSI values.
Figure 7. Bending moment variation along the length of the tunnel for (a) 20 GSI and (b) 80 GSI at tunnel crown.
From , the value of bending moment both in tension and compression reduces for an increase in the GSI value; due to arching action. During excavation for tunnel construction, the original stress distribution history of in situ soil is disturbed. Thus, new stress redistribution is induced over the soil mass surrounding the tunnel lining. This redistribution mechanism is called the arching effect. A reduction in vertical stress over the tunnel crown was observed and reported by Terzaghi (Terzaghi Citation2018) in trap door experiments and also by other researchers (Nantes Citation1994; Chen et al. Citation2011; Qarmout et al. Citation2022). Hoek and Brown (Hoek and Brown Citation2019) described 80 GSI as ‘Intact or Massive to Blocky—Well interlocked undisturbed rock mass consisting of cubical blocks formed by three intersecting discontinuity sets.’ Therefore, they can sustain themselves autonomously while excavating these rock masses. So, 80 GSI rock mass produces smaller structural forces in the tunnel lining compared to other values of GSI used in this research.
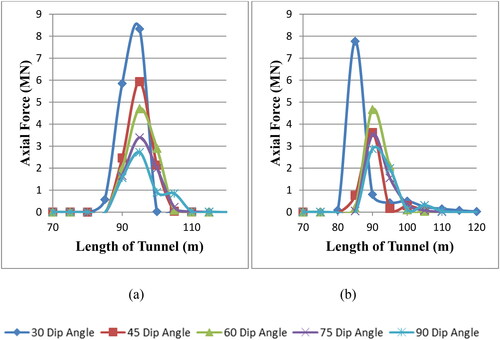
3.1.2. Axial force variation in tunnel lining
The distribution curve of axial force variation along the axial direction of the tunnel is shown in . The axial force for all fault dip angles is positive. It shows that the axial force in the tunnel lining is always in tension due to fault movement. The axial force distribution curve depicts smaller axial force apart from 70 to 120 m in length of tunnel. The axial force in the tunnel lining for 30° dip angle with 20 GSI rock mass in the fault zone is 8.5 MN as compared to 2.7 MN for 90° dip angle with 20 GSI. demonstrate that a greater axial force is generated in the lining at a dip angle of 30°. This axial force decreases as the dip angle and GSI value increase. For all the fault dip angles, 20 GSI rock mass produces peak axial force in the tunnel lining, followed by 40 GSI, 60 GSI, and 80 GSI. From , it is clear that the length of influence of axial force in the tunnel lining is more for 30° fault dip angle, and the influential length for 90° dip angle is much less. Tensile shear deformation occurs in the lining due to an increase in the dip angle up to 60 degrees. Tunnel lining experiences shear deformation if the dip angle exceeds 60 degrees. The rate of change of axial force in the fault zone is very high. Hence, it is essential to consider extra axial force generated in tension due to fault movement while designing the tunnel that passes through the fault.
Figure 8. Axial force variation along the length of the tunnel for (a) 30° dip, (b) 60° dip, and (c) 90° dip at tunnel crown.
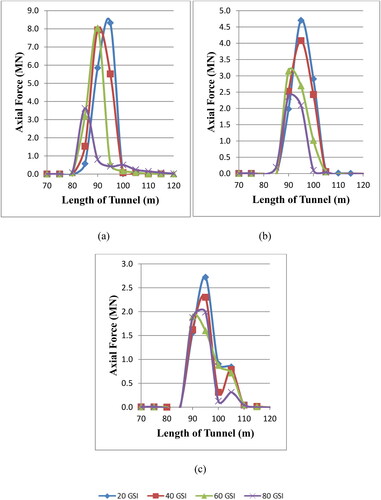
The distribution of axial force along the length of the tunnel for different GSI values is shown in . The axial force distribution curve is plotted from 70 to 120 m in length of the tunnel as tunnel lining experiences higher axial forces in that length. The axial force progresses to climb in minimal amounts with increased axial distance. The peak axial force occurs at the interface between the footwall and fault area, and subsequently the peak value decreases with an increase in axial distance. The magnitude of axial force decreases as the dip angle increases because the displacement of lining in the horizontal direction decreases with a higher dip angle. The peak value of axial force gradually decreases as the fault dip angle increases. shows that 30° fault dip angle produces peak axial force followed by 45°, 60°, 75°, and 90° for all the considered GSI variations. With an increase in fault dip angle, the rate of change of axial force in the tunnel lining in the fault zone is significantly reduced. The reduction in dip angle produces more axial force in the lining, hence affecting the safety of the tunnel. Thus, larger dip angles are preferred for the tunnel to cross through the fault zone. Bao and Wei reported the same distribution curve pattern (Bao and Wei Citation2023); they studied the effect of fault dip angles, dislocation, and fault width on the tunnel lining under fault movement.
Figure 9. Axial force variation along the length of the tunnel for (a) 20 GSI and (b) 80 GSI at tunnel crown.
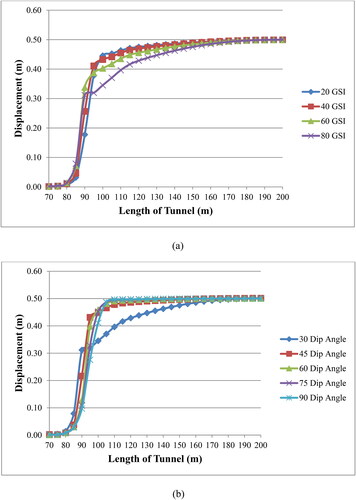
3.1.3. Deformation in tunnel lining along the axial direction
highlights the distribution curve of deformation in tunnel lining along the length of the tunnel. shows that the deformation of the lining in the hanging wall for 20 GSI and 40 GSI rock masses reaches a maximum value of 0.5 m at a distance of 150 m from the tunnel portal. In the case of 60 GSI and 80 GSI rock masses, the deformation in the lining reaches a maximum of 170 and 190 m, respectively. It shows that 80 GSI rock mass provides good resistance to the deformation of embedded tunnels against fault movement. shows that for 30° dip angle with 80 GSI, the deformation in the tunnel lining increases abruptly at the junction between the footwall and fault. Subsequently, the deformation increases slowly and reaches the peak value at 190 m from the tunnel portal. It shows that the highly disintegrated rock mass (20 and 40 GSI) in the fault zone produces peak deformation of 0.5 m in the tunnel lining over a more significant tunnel length. Therefore, unique seismic joints and isolation layers are recommended to take care of the fault movement to reduce the damage to the lining.
Figure 10. Deformation in tunnel lining for (a) 30° dip angle and (b) 80 GSI.
3.2. Seismic action
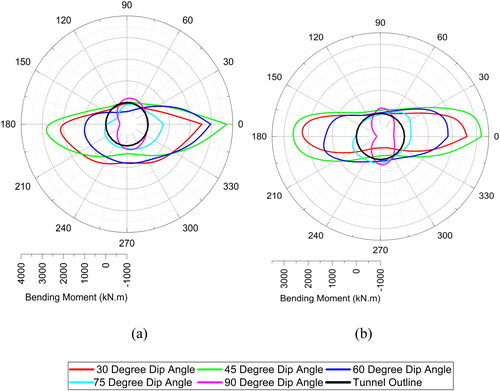
3.2.1. Bending moment variation in tunnel lining
shows the distribution of bending moment along the tunnel circumference at a distance of 95 m from the tunnel portal for different dip angles. The tunnel outline indicates that the bending moment is zero. The tunnel section at 95 m is considered the intersecting point of the footwall and fault zone. The bending moment at the crown and the bottom is smaller in comparison to the bending moment at the left and right sides of the tunnel lining. It can be seen from that for 30°, 45°, and 60° dip angles under seismic load, most parts of the tunnel lining are under tension. As the ground shakes to and fro in the horizontal direction (the seismic load is applied in the transverse direction to tunnel orientation), more structural forces are produced during the applied seismic load. As the tunnel is in the footwall area at 95 m length from the tunnel portal, it experiences tension under seismic load for the case of 75° and 90° dip angles. Irrespective of GSI values, in 75° and 90° dip angles, most of the tunnel lining experiences tension in the 95 m section. As this section is in the footwall area, the applied seismic load produces tension at the crown of the lining due to the smaller downward movement of the fault and hanging wall. However, in the case of other dip angles (30°, 45°, and 60° dip angles), the frictional/interface area between the footwall and fault is large enough to control the movement in the downward direction. shows 30°, 45°, and 60° dip angles produce more tensile bending moments. It also indicates that the fault zone with 20 GSI rock mass exhibits more tension (in the case of 30°, 45°, and 60° dip angles) as well as compression (in the case of 75° and 90° dip angles) in the tunnel lining followed by 40 GSI, 60 GSI, and 80 GSI. As 80 GSI materials are compact with minor discontinuities, they possess good interlocking properties, producing smaller structural forces in the tunnel lining.
Figure 11. Bending moment variation along the tunnel circumference for (a) 20 GSI and (b) 80 GSI at 95 m from tunnel portal.
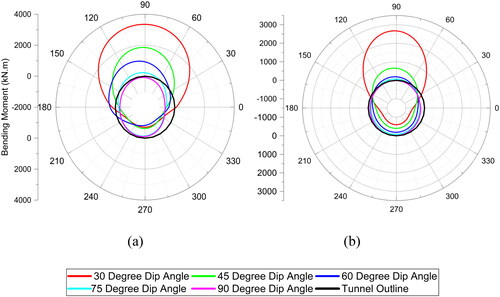
shows the variation of bending moment along the tunnel circumference for different GSI at 105 m from the tunnel portal. The tunnel section at 105 m is considered because it is the intersecting point of the fault zone and hanging wall. The distribution curve shows that the bending moment in and around the crown area (top semicircular area) of tunnel lining is under tension for 30° and 60° dip angles irrespective of GSI values. Also, the entire tunnel lining at 105 m section undergoes compression irrespective of GSI values for 90° dip angle under seismic load. This is because of the smaller fault movement triggered by the seismic activity. show that 30° dip angle produces more tension than 60° dip angle. The primary cause is the substantial development of frictional force due to the extensive contact between the fault and the hanging wall, which prevents any movement along the fault due to earthquakes. The 20 GSI rock mass in the fault zone produces more tension in the tunnel lining, as seen in . Hoek and Brown (Hoek and Brown Citation2019) describe 20 GSI as a ‘Poorly interlocked, heavily broken rock mass with mixture of angular and rounded rock pieces’. It shows the inability of 20 GSI rock mass to produce arching action. In the event of ground shaking such types of rock masses produces more stress over the underground structures. shows that the fault with 20 GSI produces more tension (for dip angles up to 60°) and compression (for 75° and 90° dip angles) in the tunnel lining. The 20 GSI rock mass is highly disintegrated and has lower interlocking properties compared to 40/60/80 GSI, thus producing more overburden on the top of the tunnel. A similar mechanism for different dip angles has been reported by Zhou (Zhou et al. Citation2022).
Figure 12. Bending moment variation along the tunnel circumference for (a) 20 GSI and (b) 80 GSI at 105 m from tunnel portal.
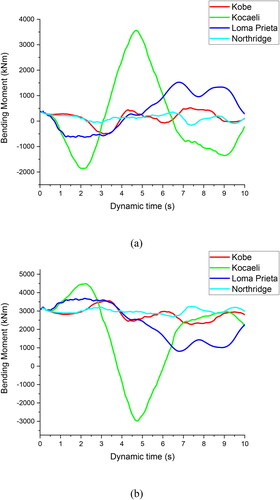
displays the change in bending moment over dynamic time at 95 and 105 m portions on the left side of the lining. This data corresponds to the most severe scenario, with a 30° fault dip angle and 20 GSI. The tunnel lining shows a similar response under all ground motion excitation except Kocaeli. indicates that Kocaeli excitation experiences 4 times higher displacement than Kobe and 6 times higher displacement than Loma Prieta and Northridge ground motions. The bending moment in the tunnel lining located at 95 m section is mostly compression up to 5 s, and after that, it causes tension in the lining, except Kocaeli. In the case of the lining at the 105 m section, tension is experienced throughout the seismic activity. Thus, it is evident that the lining experiences compressive damage in the footwall area and tensile damage in the hanging wall area. Under seismic activity, the bending moment in the lining in the footwall varies due to cyclic tension and compression stresses. A similar response is observed by Lin et al. (Li et al. Citation2021). As fault movement is activated by seismic activity, the structural forces in the lining at the 105 m section are more prominent than the structural forces in the lining at the footwall area.
Figure 13. Bending moment variation vs dynamic time at left side of tunnel at (a) 95 m and (b) 105 m from tunnel portal.
3.2.2. Axial force variation in tunnel lining
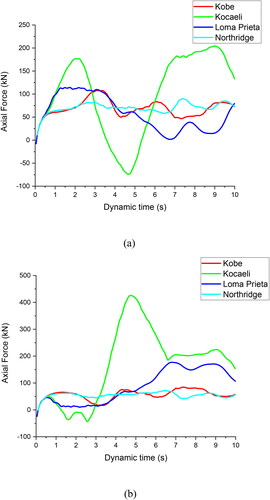
displays the change in axial force over time for the left side of the tunnel lining at lengths of 95 and 105 m. This data represents a fault dip angle of 30° GSI value of 20. The magnitude of axial force in the lining depends on horizontal movement caused by seismic activity. shows that the distribution is well in agreement with the displacement response shown in . The lining in the hanging wall area experiences more axial force than the lining in the footwall. Similar distribution curves are reported by Hassani and Basirat (Hassani and Basirat Citation2016), who conducted analytical and numerical work was carried out on the effect of tunnel lining under static earth pressure, seismic load, and combined effect. Lakirouhani and Saberi (Lakirouhani and Saberi Citation2022) stated that the dynamics analysis has more influence on shear force and bending moment. In contrast, the axial force has minimal effects by the dynamic analysis.
Figure 14. Axial force variation vs dynamic time at left side of tunnel at (a) 95 m and (b) 105 m from tunnel portal.
3.3. Design recommendations
Most of the design standards suggest avoiding tunnel crossing the fault zone. The selection of design techniques for tunnels traversing active faults is contingent upon the extent of displacement and its width. Tunnels can be built to consider fault movement by incorporating ductile joints to articulate the tunnel liner. The current numerical study evaluates the structural forces in the lining for different fault dip angles and GSI values. These structural forces can be used to calculate the capacity of tunnel lining. Subsequently, the sufficiency of lining thickness and reinforcement can be assumed. Based on this numerical analysis, it is possible to evaluate the extent of damage and utilise higher grade of concrete for the specific length, which can reduce the probability of a complete tunnel collapse.
4. Conclusion
The numerical study using a finite element program analyses the dynamic response of tunnel lining crossing fault with rock mass of different Geological Strength Index (GSI) and fault dip angles. The failure mechanism of tunnel lining under fault movement and seismic load is studied. The main conclusions drawn from the study are as follows:
Under fault movement, the peak bending moment in tension reduces to 15% for dip angles from 60° to 90°, and the peak bending moment in compression increases to 50% for dip angles from 30° to 90°. The peak bending moment in tension reduces to 25% for GSI values from 20 to 80. It shows that the flexural behaviour of the lining is significantly affected by fault dip angles up to 60°.
The peak axial force in the tunnel lining increases to 3.15 times for 30° dip angle with 20 GSI compared to 90° dip angle. Also, 20 GSI rock mass produces more axial force in the tunnel lining than other GSI values used in this study.
The tension cracks in the footwall area and compression cracks in the hanging wall at the crown of the lining near the fault zone area are prone to an inrush of a mixture of water and mud into the tunnel.
During the seismic activity, the peak bending moment at the left side of the lining at 95 m and 105 m section reduces to 11% and 13%, respectively, for increasing the GSI from 20 to 80. A more complex form of structural force variation is observed during seismic activity under selected ground motions.
The fault movement produces more structural damage in the tunnel lining than seismic load. Therefore, it is recommended to avoid building the tunnel in faults. In unavoidable situations, it is recommended to construct the tunnel to pass through the fault zone at a critical dip angle greater than 60° and the rock mass having a GSI value more than 60. If the mentioned criteria are not satisfied, proper seismic joints and isolation layers shall be employed to reduce the structural damage in the tunnel lining.
Disclosure statement
The authors declared no potential conflicts of interest with respect to the research, authorship, and publication of this article.
Data availability statement
The authors confirm that the data supporting the findings of this study are available within the article.
References
- Ansari A, Rao KS, Jain AK, Ansari A. 2023a. Formulation of multi-hazard damage prediction (MhDP) model for tunnelling projects in earthquake and landslide-prone regions: a novel approach with artificial neural networking (ANN). J Earth Syst Sci. 132(4) doi: 10.1007/s12040-023-02178-y.
- Ansari A, Rao KS, Jain AK, Ansari A. 2023b. Deep learning model for predicting tunnel damages and track serviceability under seismic environment. Model Earth Syst Environ. 9(1):1349–1368. doi: 10.1007/s40808-022-01556-7.
- Ansari A, Seshagiri Rao K, Jain AK. 2023. Seismic response and fragility evaluation of circular tunnels in the Himalayan region: implications for post-seismic performance of transportation infrastructure projects in Jammu and Kashmir. Tunn Undergr Sp Technol. 137(January):105118. doi: 10.1016/j.tust.2023.105118.
- Ansari A, Seshagiri Rao K, Jain AK. 2024. Seismic microzonation of the himalayan region considering site characterization: application toward seismic risk assessment for sustainable tunneling projects. Nat Hazards Rev. 25(1). doi: 10.1061/NHREFO.NHENG-1815.
- Ansari A, Seshagiri RK, Jain AK. 2023. Application of microzonation towards system-wide seismic risk assessment of railway network. Transp Infrastruct Geotech. 11(3):1119–1142. doi: 10.1007/s40515-023-00317-y.
- Bao L, Wei F. 2023. Study on the response of tunnel lining under fault dislocation. Sustain. 15(6):5150. doi: 10.3390/su15065150.
- Bilham R, Ambraseys N. 2005. Apparent Himalayan slip deficit from the summation of seismic moments for Himalayan earthquakes, 1500–2000. Curr Sci. 88(10):1658–1663.
- Chen RP, Tang LJ, Ling DS, Chen YM. 2011. Face stability analysis of shallow shield tunnels in dry sandy ground using the discrete element method. Comput Geotech. 38(2):187–195. doi: 10.1016/j.compgeo.2010.11.003.
- Chen S, Zhuang H, Quan D, Yuan J, Zhao K, Ruan B. 2019. Shaking table test on the seismic response of large-scale subway station in a loess site: a case study. Soil Dyn Earthq Eng. 123:173–184. doi: 10.1016/j.soildyn.2019.04.023.
- Chen X, Xiong Z, Zhuge Y, Chen Z. 2022. Shaking-table tests on seismic behavior of subway station intersecting the ground fissure. Soil Dyn Earthq Eng. 158:107272. doi: 10.1016/j.soildyn.2022.107272.
- Do NA, Dias D, Oreste P, Djeran-Maigre I. 2015. 2D numerical investigation of segmental tunnel lining under seismic loading. Soil Dyn Earthq Eng. 72:66–76. doi: 10.1016/j.soildyn.2015.01.015.
- Gomes RC, Gouveia F, Torcato D, Santos J. 2015. Seismic response of shallow circular tunnels in two-layered ground. Soil Dyn Earthq Eng. 75:37–43. doi: 10.1016/j.soildyn.2015.03.012.
- Hassani R, Basirat R. 2016. Application of hyperstatic reaction method for designing of tunnel permanent lining, Part I: 2D numerical modelling. Civ Eng J. 2(6):244–253. doi: 10.28991/cej-2016-00000030.
- Hoek E, Brown ET. 2019. The Hoek–Brown failure criterion and GSI—2018 edition. J Rock Mech Geotech Eng [Internet]. 11(3):445–463. doi: 10.1016/j.jrmge.2018.08.001.
- IS-1893-Part-1-(2016). 2016. Criteria for earthquake resistant design of structures, Part 1: general provisions and buildings. Bur Indian Stand New Delhi. 1893(December):1–44.
- Lakirouhani A, Saberi M. 2022. Evaluation of analytical solutions and two ‑ dimensional models in estimating the internal forces of tunnel lining against seismic loading, compared with three ‑ dimensional analysis. Arab J Geosci. 15(12). doi: 10.1007/s12517-022-10385-y.
- Lavasan AA, Zhao C, Barciaga T, Schaufler A, Steeb H, Schanz T. 2018. Numerical investigation of tunneling in saturated soil: the role of construction and operation periods. Acta Geotech. 13(3):671–691. doi: 10.1007/s11440-017-0595-4.
- Li L, Guo X, Zou Z, Zhu Z, Guo Z, Xiao W, Guo D. 2021. Study on dynamic response characteristics and damage mechanism of tunnel lining at entrance of shallow bias tunnel. Shock Vib. 2021:1–15. doi: 10.1155/2021/8930560.
- Li W, Chen Q. 2018. Seismic performance and failure mechanism of a subway station based on nonlinear finite element analysis. KSCE J Civ Eng. 22(2):765–776. doi: 10.1007/s12205-017-1840-y.
- Liu G, Zhang Y, Ren J, Xiao M. 2021. Seismic response analysis of tunnel through fault considering dynamic interaction between rock mass and fault. Energies. 14(20):6700. doi: 10.3390/en14206700.
- Nantes ECD. 1994. Shallow tunnels in cohesionless depth and type of soil or to make sure of the repeatability of tests. On the other hand, there are various experimental techniques by which this problem can be approached using small-scale models (Cort6 1989). For under. 120(7):1148–1165.
- National Highways & Infrastructure Development Corporation. 2023. National highways & infrastructure development corporation. https://nhidcl.com/wp-content/uploads/2023/08/All-Projects.pdf.
- PEER. No Title. 2000. Pacific Earthq Eng Res Cent (PEER) PEER strong motion database Berkeley Univ California; [Internet]. https://ngawest2.berkeley.edu/.
- Qarmout M, König D, Wichtmann T. 2022. A review of seven tunnel face stability models. CivilEng. 3(1):116–134. doi: 10.3390/civileng3010008.
- Renani HR, Cai M. 2022. Forty-Year Review of the Hoek–Brown Failure Criterion for Jointed Rock Masses. (December 2021). doi: 10.1007/s00603-021-02661-2.
- Shi L, He J, Huang Z, Sun H, Yuan Z. 2022. Numerical investigations on influences of tunnel differential settlement on saturated poroelastic ground vibrations and lining forces induced by metro train. Soil Dyn Earthq Eng. 156:107202. doi: 10.1016/j.soildyn.2022.107202.
- Singh T, Jain A, Rao KS. 2017. Physico-mechanical Behaviour of metamorphic rocks in Rohtang Tunnel, Himachal Pradesh, India. Procedia Eng. 191:419–425. doi: 10.1016/j.proeng.2017.05.199.
- Sun Q, Dias D. 2019. Seismic behavior of circular tunnels: influence of the initial stress state. Soil Dyn Earthq Eng. 126:105808. doi: 10.1016/j.soildyn.2019.105808.
- Terzaghi. 2018. Stress distribution in dry and in saturated sand above a yielding trap-door. Int Soc Soil Mech Geotech Eng. 536–537.
- UBC. 1994. UBC 1994, International conference of Building officials, Whittier, California.
- Wen YM, Xin CL, Shen YS, Huang ZM, Gao B. 2021. The seismic response mechanisms of segmental lining structures applied in fault-crossing mountain tunnel: the numerical investigation and experimental validation. Soil Dyn Earthq Eng. 151:107001. doi: 10.1016/j.soildyn.2021.107001.
- World Bank. 2023. India GDP. GDP Growth Annu [Internet]. http://data.worldbank.org/indicator/NY.GDP.MKTP.KD.ZG.
- Yu J, Wang ZZ. 2021. The dynamic interaction of the soil-tunnel-building system under seismic waves. Soil Dyn Earthq Eng. 144:106686. doi: 10.1016/j.soildyn.2021.106686.
- Zhao K, Chen W, Yang D, Zhao W, Wang S, Song W. 2019. Mechanical tests and engineering applicability of fibre plastic concrete used in tunnel design in active fault zones. Tunn Undergr Sp Technol. 88:200–208. doi: 10.1016/j.tust.2019.03.009.
- Zhou Y, Wang H, Song D, Sheng Q, Fu X, Ding H, Chai S, Yuan W. 2022. Dynamic response of lining structure in a long tunnel with different adverse geological structure zone subjected to non-uniform seismic load. doi: 10.3390/en15134599.
- Zhu D, Zhu Z, Zhang C, Xie X. 2021. Shaking table test on the tunnel dynamic response under different fault dip angles. Symmetry (Basel). 13(8):1375. doi: 10.3390/sym13081375.