
 ?Mathematical formulae have been encoded as MathML and are displayed in this HTML version using MathJax in order to improve their display. Uncheck the box to turn MathJax off. This feature requires Javascript. Click on a formula to zoom.
Abstract
In underground metal mining, ensuring the stability of pillars considered as a principal apprehension, given the likelihood of stress increase and relief leading to dynamic pillar failure. Through a detailed analysis examining stress concentration factor (SCF), deformation and yielding surrounding crown and rib pillars, this study explores the impact of various rock mass parameters. A detailed investigation utilizing non-linear 3D numerical models, governed by Mohr–Coulomb elastoplastic failure criteria, is conducted by manipulating seven variables: working depth (D), uniaxial compressive strength (σci), modulus of elasticity (Em), geological strength index (GSI), crown pillar thickness (TC), rib pillar thickness (TR), and stope width (WS). The findings suggest that increasing D from 230 m level to 290 m level exhibits a 6.62% decrease in major SCF, a substantial 26.37% decrease in minor SCF, and a noteworthy 119.9% increases in yield around crown pillars. Also, at lower depths, the rib pillar experiences a 243.31% increase in yield zone. Present study also exhibits possible failure of pillars in terms of factor of safety (FoS). This study offers crucial insight essential for optimizing pillar design and improving safety of the mine which further benefits industry financially by altering additional operational cost.
Introduction
In underground (u/g) hard rock mines, pillars serve a critical function in maintaining the structural integrity of the overlying strata and ensuring a safe, stable working environment for mining activities (Ghasemi et al. Citation2017). However, the formation of extensive stopes necessitates careful consideration of geotechnical stability due to stress concentration around natural pillars, particularly crucial for safety and productivity in large-scale u/g metal mining operations. The creation of vast open stopes through excavation leads to stress concentration around natural pillars, leading to significant convergence, lateral disintegration, and increased regime of yielding surrounding the corners of pillars and u/g structures (Zhang and Mitri Citation2008) potentially leading to the collapse of the stope surface (Urli and Esmaieli Citation2016). Crown pillar often suffers cracks or damage from the immense load of overlying strata and intense horizontal stresses. Thus, prioritizing geotechnical stability stands as a fundamental aspect for safeguarding and enhancing productivity particularly in sizable u/g mines. Rib pillars serve a critical purpose in open stope mining by improving the stability of an excavation zone. Their function is to mitigate rock mass displacement and confine its presence primarily along stope backs and walls. Moreover, these pillars enable greater adaptability executing ore extraction through several operational faces in partitioned stope blocks. The loss of load-bearing capacity in rib pillars linked with the loss of confinement. The outer rock layers provide essential confinement to the central core of the pillar. Initial signs of pillar deterioration include boundary fractures, releasing some of the original confinement. As load increases, the pillar’s lateral expansion grows, leading to potential slabbing and propagation of fractures into the pillar core, diminishing its strength (Potvin et al. Citation1989). Severe fracturing is typically necessary before block fallout and disintegration occur. These observations align with previous literature on room and pillar mining (Krauland and Soder Citation1987), highlighting similarities in response mechanisms between biaxially and uniaxially loaded pillars (Brady and Brown Citation2006).
Mining operations subjected to extensive depths; extensive u/g stopes concentrate stress, leading to significant deformation and yielding around pillar corners. This process induces stress relaxation in the surrounding areas, posing potential risks such as deterioration of the stope front (Urli and Esmaieli Citation2016). The stability of highly stressed rock masses relies on several factors, particularly the structural and mechanical attributes of the rocks. Pillar stability is notably influenced by factors such as depth of cover, excavation size, horizontal stresses, rock mass properties, backfilling, reinforcement, and the orientation of the orebody. These factors are extensively studied and documented by various researchers (Kvapil and Blake Citation1973; Tavakoli Citation1994; Edelbro Citation2003; Lu et al. Citation2008; Deb and Das Citation2011; Esterhuizen et al. Citation2011). (Chen and Mitri Citation2021) conducted a parametric study to analyse the influence of fault characteristics and ratio of horizontal stresses on crown pillar stability whereas (Saeidi et al. Citation2021) demonstrated the effect of failure under compression, tension and brittleness for the rib pillar using FLAC3D 7.0. While a thick crown pillar contributes to hanging wall support and overall stope stability, its thickness may pose challenges in terms of mineral conservation. Hence, optimizing pillar dimensions holds significant importance for metalliferous mines (Bakhtavar et al. Citation2011) as it affects the ore dilution around the mining stopes (Guggari et al. Citation2024). Determining the ideal thickness for a crown pillar is intricate and typically relies on applied knowledge along with array of empirical strategies (Tavakoli Citation1994; Mark Citation2016). The reliability of pillars within u/g mine relies on the structural integrity of adjacent rock and induced stresses, influenced by excavation shape, and pre-existed in-situ stresses, which are themselves shaped by the geological background of the rock formation (Martin et al. Citation2003). (Li et al. Citation2021a; Citation2021b) considered Geological Strength Index (GSI) as factor of influence for the stability combining it with uniaxial compressive strength (σci) and pillar width and suggested the influence of all three parameters on the pillar stability. (Heidarzadeh et al. Citation2020) varied geo-mechanical attributes of rock mass for assessing the effect of these parameters on the pillar stability using numerical techniques associated with deterministic model. Thus, prioritizing geotechnical integrity is crucial, especially in managing pillar integrity and optimizing their dimensions to enhance safety and operational efficiency. The assessment of u/g structure stability stands as a fundamental aspect within the domain of u/g mining. Evaluation approaches often use analytical, empirical, and numerical methodologies. However, it is acknowledged that analytical assessments, constrained by basic geometric considerations, might lack the comprehensive scope required to analyse complex geo-mining scenarios (Brady and Lorig Citation1988).
A parametric study by Guggari et al. (Citation2023) was conducted to address the design of a crown pillar for u/g deposits, considering factors such as characteristics of the rock mass, excavation span and depth. This study considered the depth of working (D), uniaxial compressive strength (σci), pillar thickness (T), geological strength index (GSI), and modulus of elasticity (Em) as major parameters for the 2 dimensional (2D) numerical analysis. Its objective was to comprehend the pillar dynamics within the region of stress relief resulting from sub-level open stope excavation. 2D finite element (FE) numerical model was prepared to analyse the effect of stresses, deformation and yielding on the gold bearing u/g metal mine. The major drawback of the study is that nonhomogeneous rock mass analysed using 2D numerical analysis underpredicts deformation as the weak zones present in the rock mass structure has prominent effect on the deformation when subjected to the 3D analysis (Dhawan et al. Citation2002).
To overcome the limitation of the above study a detailed study is conducted considering additional geo-mechanical parameters to access the influence over the u/g structure, 3D finite element models were created using Ansys Workbench version 19.0. These models were selected for their ease of setup and relatively short computational times, enabling evaluation of sensitivity and refinement (Norén-Cosgriff et al. Citation2020). Nonlinear materials following Mohr–Coulomb (MC) failure criteria (Xu et al. Citation2006; Citation2015) were utilized, chosen due to its compatibility with modelling rock response, accounting for rock brittleness and vulnerability along inherent fault lines. This criterion establishes a failure envelope in the domain of stress via two key indicators -cohesion (c) and internal friction angle (ϕ). Beyond this envelope, failure happens adjacent to a plane oriented aligned with the friction angle. MC criteria aligns well with modelling rock response, particularly accounting associated with the recurring fracturing and collapse observed along pre-existing discontinuities within the rock (Labuz et al. Citation2012). The outcomes are evaluated in terms of the stress concentration factor (SCF), deformation, yielding zones, and the factor of safety (FoS). Each parameter’s influence on pillar stability is assessed by varying factors such as working depth (D), uniaxial compressive strength (σci), crown pillar thickness (TC), rib pillar thickness (TR), geological strength index (GSI), stope width (WS), and modulus of elasticity (Em).
Overview of case study mine
The general strike of the mine formation extends along N30°E-S30°W, characterized by steep dips of approximately 70° toward the northwest. At the 5000 latitudes of the Mine, there is an eastward shift in the strike, transitioning from N52°E-S52°W to N68°E-S68°W. Mineralization primarily occurs along the gradual contact of the Delhi System, with all ore lenses running parallel or sub-parallel to the host rocks. The surface geological map delineates several transverse faults, notably evident on the footwall side within the feldspathic quartzite horizon. These faults exhibit a clear displacement of thin magnetite bands and dip at around 70° towards the north, occasionally towards the south. Although these transverse faults are mapped, they minimally impact the continuity of ore lenses. Any minor displacements observed do not significantly alter the width of the mineralized zone intersected. Consequently, the ore zones maintain continuity in their strike after traversing these faults.
In the mine area, surface exposures are absent, necessitating an exploration of the wall rocks and host rocks solely through drill core analysis. The examination of borehole cores reveals that both the hanging wall and footwall rocks surrounding the mineralization exhibit solid and competent characteristics, serving as sturdy barriers due to their sub-vertical orientation. However, the mineralized ground displays lower competence due to the presence of joints, shears, and fractures. The physical and chemical attributes of the wall rocks align favourably with those conducive to u/g mining, as observed in neighbouring mine areas. Furthermore, negligible effects of weathering have been observed. The mine spans a latitude range from 5000 N to 6200 N. A decline with a gradient of 1 in 9 serves as the entry point for mineral extraction from the mine. The copper orebody, predominantly chalcopyrite, manifests in narrow lodes of varying widths within the mine. Operations occur at intervals of 60 meters (m) between adjacent main levels. Currently, pillar extraction activities are underway at 240 m level, 180 m level, and 120 m level, with ongoing development work planned for subsequent levels (60 m level and 0 m level). Mineral extraction primarily takes place from transverse and longitudinal stopes using the 'Blast Hole Open Stoping’ method.
Numerical modelling
Geotechnical characterization
Rock samples were gathered from different levels within the mine, ranging in volume from 300 m level to 60 m level, along with samples from the host rock below the mine. Testing included 49 core samples for uniaxial compressive strength (σci) and tri-axial compression, and another 49 for biaxial tensile strength. The core samples varied in length-to-diameter (L/D) ratios (2.5, 2, and 0.5, respectively) with a diameter of 54 mm. The orebody exhibited σci values between 109.96 and 118.87 MPa, Em from 29.60 GPa to 44.98 GPa, GSI ranging from 45 to 66.8, ϕ from 31.77° to 39.81°, and c between 1.04 and 3.38 MPa. These rock properties were considered for modelling, particularly in relation to variables like TC, TR, WS, D, σci, Em, and GSI. Variations are considered are in range of these values which are represented in .
Table 1. Key geotechnical factors dataset for numerical simulation.
The geo-mechanical attributes in intact rocks were converted into rock mass properties through the implementation of RSData ver.1.007 within Rocscience software. Utilizing the Hoek–Brown criterion, rock mass properties were determined to facilitate numerical simulations. A total of 144 3D FE excavation models were prepared, having all possible iterations, in addition to 18 in-situ models.
Finite element analysis
All 3D models created for the numerical analysis represent the actual dip and orebody thickness variation across working depths. D is 450 m from the surface and the level are mentioned by 240 m level, 180 m level, 120 m level and 60 m level and 0 m level. The level difference is 60 m with a draw-point dimension of 4 m width and 3.2 m of height. For numerical analysis the dimensions of WS, TC, and TR are varied along with the strength properties of rock mass. represents front view and isometric view of model geometry, respectively. A fine mesh of element size of 1.5 m is created near the excavation field and the element size was gradually increased with the growth rate of 1.2. represents the coarse meshing profile for the host rock whereas represents fine meshing for the orebody. For the mesh independency, mesh sensitivity analysis was performed () and represented in . The stress assessments were consistent with 54,74,165 nodes and 38,46,657 elements, reaching a limit where the element count becomes ineffective with respect to the result. A tetrahedral mesh is a four-node based method which uses two algorithms of patch conforming and patch independent method. This analysis incorporates a patch conforming method commencing from the geometry’s edges and faces, the meshing process gradually extends into its volume. The method generates a high-quality clean mesh which supports a better convergence of stress compared to the patch independent method that is more suitable for poor quality geometry.
Figure 1. (a) Front view of model geometry and (b) Isometric view of model geometry.
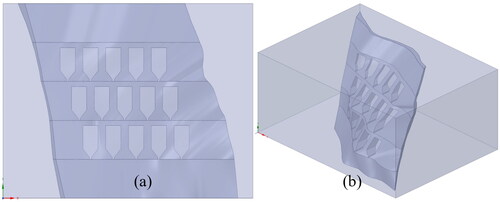
Figure 2. (a) Coarse meshing profile for the host rock and (b) Finer meshing scheme for the orebody.
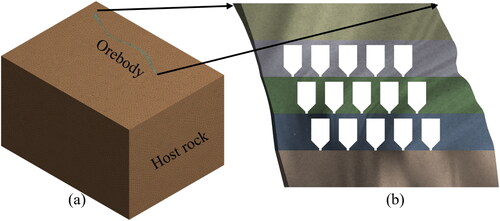
Figure 3. Mesh sensitivity analysis for independency of mesh count on results.
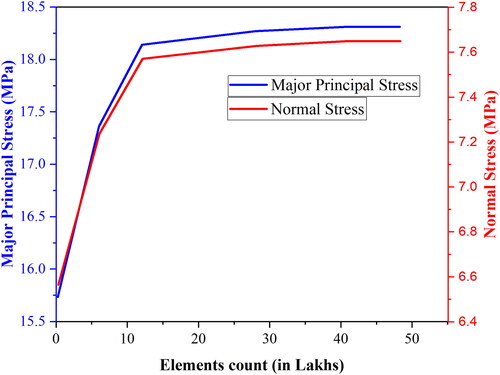
Table 2. Percentage difference of stress vs element count.
Horizontal gradient pressure (the maximum σH and the minimum σh) are applied over the two vertical faces of the 3D FE model with stresses varying with depth from 11.58 MPa to 21.48 MPa for σH () and from 8.29 MPa to 13.15 MPa for σh (), respectively. shows uniform pressure (σV) of 4.71 MPa is exerted onto the model’s uppermost face. Displacement is provided on the opposite faces of the geometry which is constrained in the respective direction whereas fixed support is provided in the bottom of the model geometry ().
Figure 4. (a) Maximum horizontal gradient pressure (σH), (b) Minimum horizontal gradient pressure (σh), (c) Vertical pressure (σV) applied on the model geometry, and (d) Loading and boundary condition on model geometry.
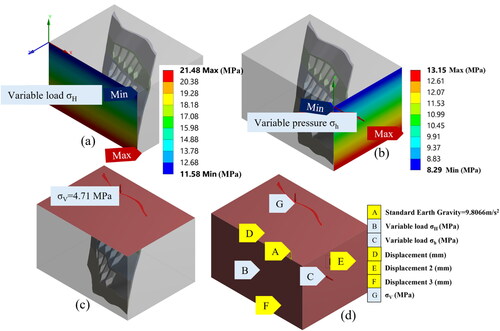
For the estimation of σH, σh, and σV the equation proposed by NGRI (National Geotechnical Research Institute) for the mine is given below:
(1)
(1)
(2)
(2)
(3)
(3)
where Z is the depth from the surface in metre (m).
FE models depict the post-stope state after ore recovery. Concurrently, in-situ models are generated to evaluate the impact of rock-mass stresses and deformation states. Calibration, following the methodology proposed by Shnorhokian et al. (Citation2014), is conducted to calibrate these models. This calibration follows a comparative analysis between the output of numerical models and in-situ observations documented at specific locations, outlined in , before any excavation occurs. The working depth of 230 m level below the surface within the country rock used for the calibration process. For analysing ground behaviour through finite element modelling, several key assumptions have been identified and are listed below.
Table 3. Comparison table: FE model outputs and in-situ observations.
Joint and bedding plane effects are accounted for within the GSI value for rock mass, rather than analysing the distinct impact of each plane separately.
The model excludes considerations for dynamic loading.
A zero value is adopted as the cutoff for tensile strength.
Results and discussion
Distribution of principal stresses around the crown and rib pillar
Prior to estimating the factor of safety (FoS) for the crown and rib pillars, it is imperative to ascertain the stress distribution resulting from stope extraction. An FoS below one signifies a risk of complete pillar failure. Given the transient nature of stopes, intended for subsequent sand stowing, a threshold value of 1.0 could be considered acceptable.
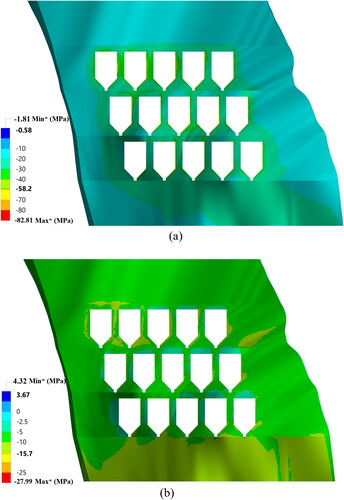
Individual discussions of each model’s outcomes are not within the paper’s focus. However, other input parameters remained consistent as TC = 8 m, TR = 10 m, WS = 30 m, D = 230 m, GSI = 55, σci = 100 MPa, and Em = 30 GPa while focusing on evaluating the impact of specific input parameters on stress profile. illustrates the distribution of the major principal stress (σ1), while showcases the distribution of minor principal stress (σ3) surrounding the model geometry. Regions characterized by low stress levels (σ3<0), denoting stress relaxation zones, were identified and confirmed in surrounding the stope.
Figure 5. (a) Major principal stress (σ1) distribution and (b) Minor principal stress (σ3) distribution.
SCF at a specific location is determined by comparing the stress induced by excavation to the in-situ stress at that location (Zhang et al. Citation2014). Whereas (Zhang and Mitri Citation2008) suggested that SCF is a ratio of post-mining major principal stresses to average of pre-miming principal stress value. It signifies alterations or redistribution in stresses concerning initial conditions. SCF near one indicates minimal change or redistribution of in-situ stress caused by excavation. Considering the SCF described above the expression for major and minor SCF (Kumar et al. Citation2016) is provided as follows
(4)
(4)
(5)
(5)
where κ1, κ3 is major SCF and minor SCF, respectively;
is the mining induced major and minor principal stress, respectively, whereas
is the average in-situ mining major and minor principal stress, respectively.
The SCF serves as a guide in identifying where and how extensive high-stress zones form post-excavation. Consistency in SCF values across the mining opening suggests greater stability for that opening (Obert et al. Citation1960). When lacking the ability for non-linear modelling, the SCF criterion serves as a valuable tool within linear elastic analysis, highlighting potential failure points.
Effect of D on κ1 and κ3
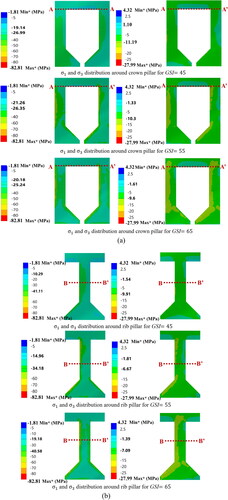
As the host rock is more competent compared to the orebody, the centre of the crown pillar exhibits the most prominent stress concentration and along the skin of the side wall of the rib pillar. and demonstrates the spread of σ1 and σ3 around the crown pillar and rib pillar for depths of 230 m level, 290 m level, and 350 m level, respectively.
Figure 6. (a) σ1 and σ3 Distribution with different working depth (D) around crown pillar and (a) σ1 and σ3 distribution with different working depth (D) around rib pillar.
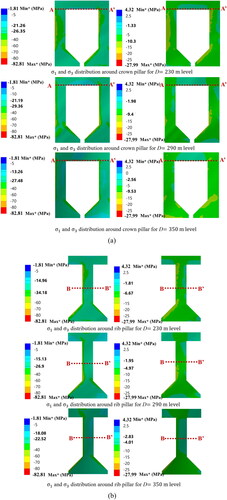
Table 4. κ1 and κ3 Values at different D.
For the crown pillar, κ1 values were obtained as 1.51, 1.41, and 1.29 at depths of 230 m level, 290 m level and 350 m level below surface level, respectively, exhibiting decreases of 6.62% and 8.51%. Correspondingly, κ3 values at these depths were 0.73, 0.57, and 0.53, demonstrating decreases of 21.92% and 7.02% specifically at the lower D values.
For the rib pillar, derived κ1 values at depths of 230 m level, 290 m level and 350 m level below the surface were 2.01, 1.48, and 1.17, respectively, indicating decreases of 26.37% and 20.95%. Simultaneously, the κ3 values for the rib pillar at these depths were 0.87, 0.52, and 0.38, resulting a decrease of 40.23%, which further reduced to 26.92% at the respective lower D values.
The critical κ1 threshold was identified at 2.21 for a specific iteration within the crown pillar, characterized by parameters: σci = 120 MPa, Em = 37.5 GPa, GSI = 65, TC = 10 m, TR = 10 m, and WS = 40 m, observed at a depth of 290 m level. Conversely, the rib pillar exhibited an optimal κ1 value of 2.31 under conditions: σci = 120 MPa, Em = 37.5 GPa, GSI = 45, TC = 8 m, TR = 10 m, and WS = 40 m, positioned at a depth of 230 m level. In terms of κ3, the crown pillar reached its maximum value at 1.12, achieved with parameters: σci = 100 MPa, Em = 37.5 GPa, GSI = 55, TC = 10 m, TR = 15 m, and WS = 30 m, for a D at 350 m level. Additionally, the value of κ3 amounted to 1.36 for σci = 100 MPa, Em = 30 GPa, GSI = 45, TC = 8 m, TR = 10 m, and WS = 4 m, at a depth of 230 m level.
Effect of σci on κ1 and κ3
and depicts σ1 and σ3 dispersion surrounding the crown and rib pillars concerning variations in σci values of 100 and 120 MPa. In the case of the crown pillar, the κ1 value remained constant at 1.51 for varying σci values, while the κ3 value also maintained consistency at 0.73 across the respective σci variations.
Figure 7. (a) σ1 and σ3 Distribution with σci variations around crown pillar and (b) σ1 and σ3 distribution with σci variations around rib pillar.
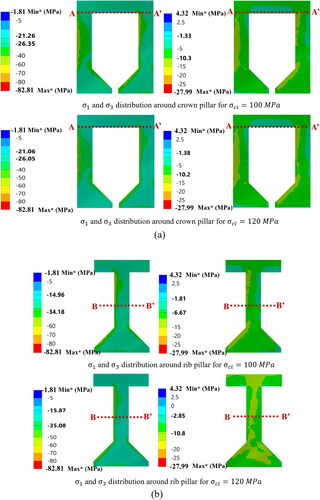
Table 5. κ1 and κ3 Values at different σci.
Conversely, for the rib pillar, the κ1 values were observed as 2.01 and 2.03 for σci values of 100 and 120 MPa, respectively. The κ3 values for the corresponding σci were measured at 0.87 and 0.83.
The crown pillar exhibits consistent κ1 and κ3 values, showing no variation. Similarly, in the rib pillar, the difference remains within 5%, signifying no substantial alteration with varying σci values of the orebody.
Effect of Em on κ1 and κ3
Em defines the rock mass’s resilience against the strain resulting from external forces, significantly influencing the material’s elasto-plastic behaviour. In the crown pillar (), κ1 values were measured at 1.51, 1.54, and 1.56 for Em values of 30, 37.5, and 45 GPa, respectively, while κ3 values for the crown pillar stood at 0.73, 0.75, and 0.73, respectively.
Figure 8. (a) σ1 and σ3 Distribution with Em variations around crown pillar and (b) σ1 and σ3 distribution with Em variations around rib pillar.
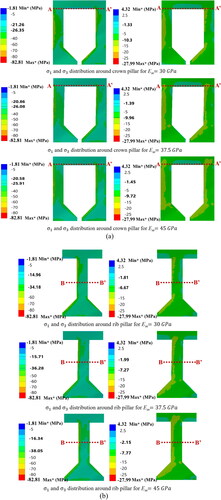
For the rib pillar (), κ1 values were observed as 2.01, 1.95, and 1.88, while corresponding κ3 values were recorded at 0.43, 0.44, and 0.46 for varying Em values.
Overall, an increase in elasticity exhibits decreased σ1 and σ3 values (). The change in κ1 and κ3 values within crown pillar (thicknesses of 8 and 10 m) and rib pillar (thicknesses of 10 and 15 m), respectively remains limited within 4% when the Em of the orebody varies from 30 to 45 GPa. However, the change in κ3 for the rib pillar shows a 17.24% increase when increasing Em from 30 to 37.5 GPa. From these findings, several conclusions emerge:
Table 6. κ1 and κ3 Values at different Em.
The alterations in κ1 and κ3 due to Em variations are more pronounced in the rib pillar compared to the crown pillar.
Higher magnitudes of κ1 and κ3 are observed around the centre of the crown pillar and along the edges of the rib pillar sidewall.
Effect of GSI on κ1 and κ3
GSI holds significance in determining the stability of u/g excavations. Variations in stress magnitude align with the variability in the orebody’s GSI, impacting the yielding zone significantly. In the context of the crown pillar (), κ1 values exhibit a progression from 1.43 to 1.58 as the GSI increases from 45 to 65. Similarly, κ3 values rise from 0.69 to 0.74 with the corresponding increase in GSI.
Figure 9. (a) σ1 and σ3 Distribution with GSI variations around crown pillar and (b) σ1 and σ3 distribution with GSI variations around rib pillar.
Conversely, for the rib pillar (), κ1 values fluctuate between 1.88 and 1.87 with GSI changes from 45 to 65, while κ3 values demonstrate a more pronounced shift from 1.08 to 0.74 under the same GSI variations (). Summarizing the findings:
Table 7. κ1 and κ3 Values at different GSI.
An alteration in GSI from 55 to 45 is associated with a 5.3% decrease in κ1 and a 5.48% reduction in κ3, particularly within the crown pillar. However, raising the GSI to 65 results in a 4.64% increase in κ3 without notable changes in κ1.
In the rib pillar, a decrease in GSI from 55 to 45 prompts a 6.47% drop in κ1 and a substantial 24.14% increase in κ3. However, shifting the GSI to 65 induces a 6.97% decrease in κ1 and a 14.94% decline in κ3.
Effect of TC on κ1 and κ3
The depiction of σ1 and σ3 distribution on crown and rib pillars in , respectively reflects the impact of TC. As the pillar thickness increases, there is a corresponding rise in the extent and scale of the principal stress on the crown pillar. For instance, at 8 and 10 m of pillar thickness, the κ1 values are 1.51 and 1.55, respectively. Meanwhile, the κ3 values stand at 0.73 and 0.64 for their respective thicknesses ().
Figure 10. (a) σ1 and σ3 Distribution with TC variations around crown pillar and (b) σ1 and σ3 distribution with TC variations around rib pillar.
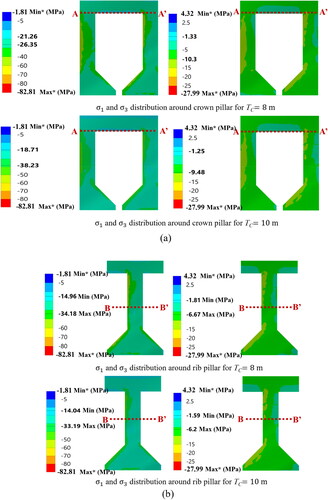
Table 8. κ1 and κ3 Values at different TC.
The observation indicates that thicker pillars coincide with an increase in the σ3 at the pillar’s corner, potentially leading to shear yielding. At depths of 230 m level, 290 m level and 350 m level, there is a progressive decrease in σ1, suggesting that thicker pillars might be suitable for these depths. Summarizing the findings:
Increasing TC from 8 m to 10 m results in a 12.33% decrease in the κ3 value.
For rib pillars, there is a decrease of 0.5% in κ1 and a 14.94% decrease in κ3 when comparing values of 2.01 and 2.0 for κ1, and 0.87 and 0.74 for κ3, respectively.
The impact of increasing TC from 8 m to 10 m on the κ1 value is not significant, with a change within 3%.
Effect of TR on κ1 and κ3:
provides insight into the influence of TR on the distribution of σ1 and σ3 around crown and rib pillars. The data as mentioned in illustrates that as pillar thickness expands, there’s a simultaneous increase in the magnitude and extent of κ1, accompanied by a decrease in minor stress values. Specifically, when TR is increased from 10 to 15 m, the resulting κ1 values of 1.51 and 1.52 indicate an insignificant 0.66% increment. In contrast, the respective κ3 values of 0.73 and 0.65 exhibits a significant decrease of 10.96%.
Figure 11. (a) σ1 and σ3 Distribution with TR variations around crown pillar and (b) σ1 and σ3 distribution with TR variations around rib pillar.
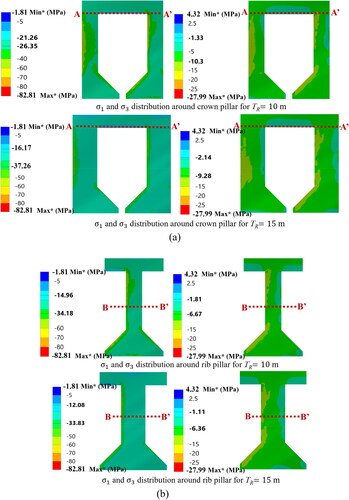
Table 9. κ1 and κ3 Values at different TR.
This investigation highlighted a distinct elevation in σ3 at the pillar corner with increasing thickness, suggesting potential implications for shear yielding. Within rib pillars of 10 and 15 m thickness, κ1 values decreased from 2.01 to 1.76, indicating a 12.44% decrease, while κ3 values shifted from 0.683 to 0.743, representing a 9.2% decrease. These findings underscore the intricate stress behaviours observed across various values of TR.
Effect of WS on κ1 and κ3
While assessing the impact of widening WS from 30 to 40 m on the crown pillar (), κ1 values were measured at 1.51 and 1.47, indicating a 2.65% decrease (). Similarly, the κ3 values recorded were 0.73 and 0.59, reflecting a decrease of 19.18% for the respective WS values. However, in the case of the rib pillar (), κ1 values were noted at 2.01 and 2.03 for the varied WS, whereas κ3 values stood at 0.87 and 0.80 for the respective WS values.
Figure 12. (a) σ1 and σ3 Distribution with WS variations around crown pillar and (b) σ1 and σ3 distribution with WS variations around rib pillar.
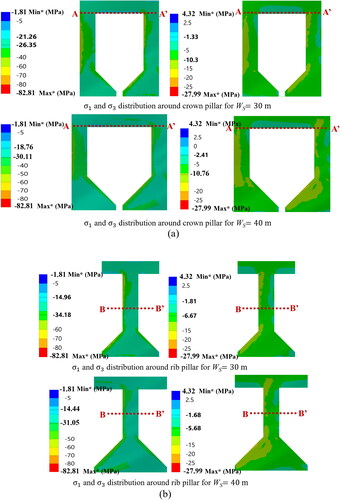
Table 10. κ1 and κ3 Values at different WS.
This analysis suggests that increasing the stope width from 30 to 40 m minimally impacts both κ1 and κ3 values for the rib pillar and κ1 value of the crown pillar, with changes remaining within 3%. However, the κ3 value of the crown pillar experiences a notable 19.18% decrease under these conditions.
Effect of various geo-mining properties on vertical deformation profile
Deformations exceeding specific thresholds within the crown pillar and hanging wall can instigate collapses. Examining deformation profiles along line A-A’ for the crown pillar and line B-B’ for rib pillars ( and , respectively) involved comprehensive analysis across different geo-mining conditions. To understand the impact of excavations on vertical deformation, comparisons between in-situ deformations and excavated models along these lines were conducted.
Figure 13. Vertical deformation of various geo-mining properties for crown pillar.
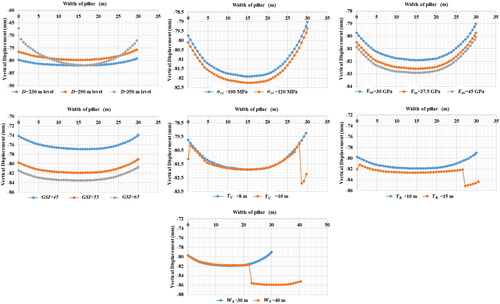
Figure 14. Vertical deformation of various geo-mining properties for rib pillar.
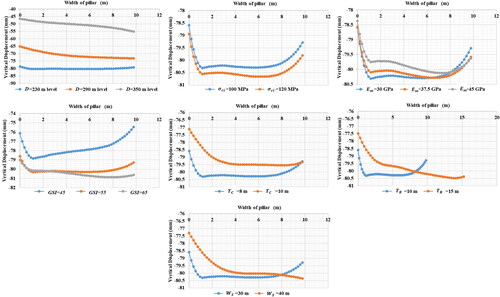
Numerical analysis demonstrates a 3.24% reduction in deformation () when D increases from 230 m level to 290 m level for the crown pillar, decreasing from 81.17 to 78.54 mm. Further deepening to 350 m level shows a marginal 0.36% reduction, reaching 78.21 mm. Conversely, the rib pillar consistently experiences decreasing deformation: from 80.08 mm at 230 m level to a 70.88 mm at 290 m level accounting a 0.36% decline, and a 28.67% reduction at 350 m level, reaching 50.56 mm. This emphasizes a substantial decrease in deformation for lower-level rib pillars, aligning with the 243.31% yield zone increase from 290 m level to 350 m level. From the analysis following outcomes can be summarized:
Table 11. Deformation values of different geo-mining properties on crown and rib pillar.
Varying σci from 100 MPa to 120 MPa has minimal impact on deformation profiles, with changes within 0.5% for both crown and rib pillars. Deformation ranges between 81.17 and 81.52 mm for the crown, and from 80.08 mm to 80.43 mm for the rib pillar.
Varying Em from 30 GPa to 37.5 and 37.5 GPa to 45 GPa results in 0.86% and 0.40% increased deformation for the crown. Conversely, the rib pillar shows marginal decreases of 0.05% and 0.26%, suggesting no substantial influence on vertical deformation with Em ranging from 30 GPa to 45 GPa.
Decreasing GSI from 55 to 45 in the crown pillar leads to a 7.11% deformation reduction (from 81.17 to 76.05 mm), while increasing GSI from 55 to 65 causes a 1.14% increase. However, overall deformation changes remain within 3% considering GSI variations.
Considering varying TC from 8 to 10 m and TR from 10 to 15 m shows no significant impact on deformation, with changes staying within 3%. A general apprehension is that as depth increases, vertical deformation in the cases of TC and TR also increases (Kahraman et al. Citation2003; Kumar et al. Citation2016). However, as illustrated in the model geometry, the dip angle increases with depth. According to Dintwe et al. (Citation2022), a notable increase in displacement occurs at lower dip angles, leading to a decrease in deformation as the dip angle increases. Additionally, considering the model geometry, the thickness of the orebody gradually increases with depth. From an excavation standpoint, the orebody thickness is at its maximum at 350 m level and minimum at 230 m level. During excavation, the void area created induces stress redistribution, further contributing to deformation. As the void area enlarges, deformation also increases. Nevertheless, due to the greater thickness of the orebody at lower depths, the dimensions of the crown pillar and rib pillar are significantly larger compared to those at 230 m level and 290 m level. Consequently, with the incremental size of the pillar dimensions, deformation decreases as the pillars offer better support compared to the previous levels. Due to these reasons vertical deformation for TC, and TR is insignificant.
While analysing the maximum vertical deformation trend of crown pillar for varying WS in , a gradual increase in the deformation profile occurs. When WS increases from 30 to 40 m, widening stope cause load redistribution, resulting in higher vertical stress concentrations in the roof and floor, which increases vertical deformation of the crown pillar. Additionally, the removal of a larger volume of material reduces confinement and increases stress relaxation, making the remaining rock mass more prone to deformation under the weight of the overlying strata (Brady and Brown Citation2006). The larger unsupported span in wider stopes leads to more pronounced bending and sagging of the roof and floor heaving, as the effectiveness of natural arching and pillar support diminishes (Hoek and Marinos Citation2000) resulting further increase in the vertical deformation in crown pillar.
Extent of yielding zone
The initiation of yielding or failure within a particular zone is indicated by the emergence of plastic strain. The utilization of the Mohr-Coulomb failure criterion aims to ascertain the initiation of yielding within the rock mass, elucidated as follows
(6)
(6)
where, ϕ = friction angle, c = cohesion
(7)
(7)
(8)
(8)
(9)
(9)
(10)
(10)
(11)
(11)
In this context, a value of 0 indicates no yield or failure, while any value other than 0 signifies potential failure occurring in the rib pillars, around the stope, or within the orebody. From and , both models show potential yielding in the roofs and sides of the stopes/pillars. This aligns with the σ1 and σ3 plots presented earlier. In scenarios with the minimum GSI, there’s a maximum plastic strain of 0.012 observed around the rib, crown pillars, and stopes.
Figure 15. (a) Maximum plastic strain for minimum GSI value (=45) and (b) Maximum plastic strain for average GSI value (=55).
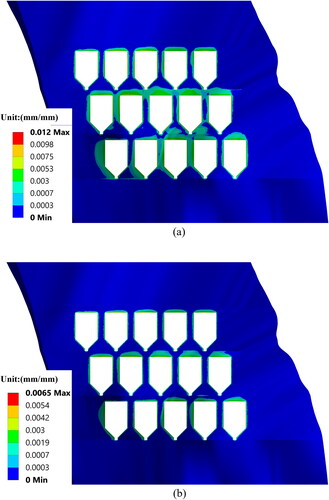
Table 12. Yield zone extent for the various geo-mining conditions.
In comparison, the average GSI model exhibits a strain of 0.0065. These results suggest a possible failure in the skins or sides of the pillars while maintaining the integrity of the core under current geo-mining conditions.
Yield zone based on D
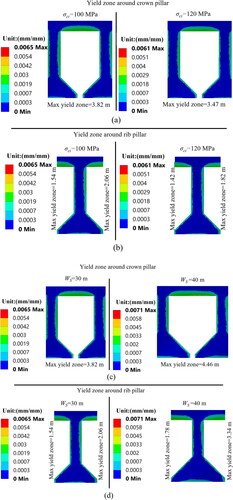
are used to ascertain the maximum extents of the yield zones at depths of 230 m level, 290 m level, and 350 m level for the crown pillar and rib pillar, respectively. In general, the extent of maximum yield zone increases with increases in D value. The results highlighted a distinct pattern: as the D increased from 230 m level to 290 m level, there was a significant rise in the maximum yield zone, expanding from 3.82 to 8.4 m, signifying a substantial 119.9% increase. Whereas shifting from 290 m level to 350 m level exhibits 35.85bmgv % difference in the yield zone. Notably, even under conditions of extremely low GSI, the yield zone continued to grow, representing a 62.51% increase.
Figure 16. (a) Yield zone along the crown pillar for different D (m level) and (b) Yield zone along the rib pillar for different D (m level).
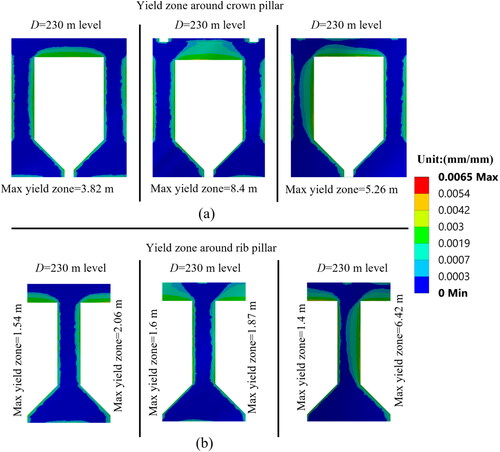
Additionally, D at 290 m level, the rib pillar demonstrated a 9.22% reduction in the plastic zone compared to its presence at 230 m level, decreasing from 2.06 to 1.87 m. This trend persisted with an additional 243.31% increase in the plastic zone as the D increased to 350 m level, showing a shift from 1.87 to 6.42 m.
Yield zone based on σci and WS
Analysis of reveals changes in plastic deformation for the crown pillar, shifting from 3.82 to 3.47 m when σci values vary between 100 and 120 MPa. This alteration reflects a percentage decrease of 9.16. Conversely, for the rib pillar (), the impact of increasing σci from 100 to 120 MPa results in a shift from 2.06 to 1.82 m, with a percentage decrease of 11.65%. The findings demonstrate that larger σci values coincide with a decrease in the dimensions and extent of the yield. Additionally, when increasing WS from 30 m to 40 m, both crown and rib pillars (, respectively) show an expansion in the plastic zone, with a percentage increase of 16.75 in case of the crown pillar whereas 62.14% increase in rib pillar.
Figure 17. (a) Yield zone along the crown pillar for different σci, (b) Yield zone along the rib pillar for different σci, (c) Yield zone along the crown pillar for different WS, and (d) Yield zone along the rib pillar for different WS.
With a pillar thickness of 8 m and a strength of 100 MPa at 350 m level depth, wider yield zones (243.31% rise) increase the likelihood of roof or rockfall incidents. Similar trends occur across different pillar thicknesses, showing variations in D, GSI, and Em values.
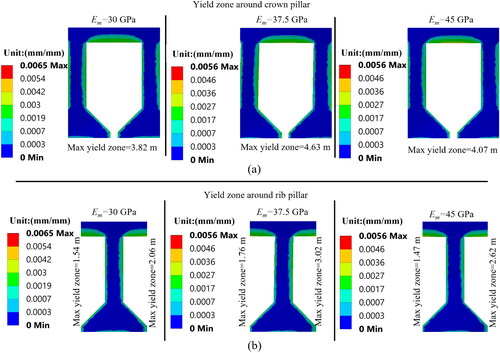
Yield zone based on Em
The findings suggest that incremental Em notably impact the yield zone of the crown pillar by 21.2% increase whereas 46.60% increase in case of the rib pillar when Em changes from 30 GPa to 37.5 GPa. (). However, increasing the Em value from 37.5 GPa to 45 GPa leads to a 12.1% decrease in the crown pillar and a 16.48% decrease in the rib pillar’s plastic zone.
Figure 18. (a) Yield zone along the crown pillar for different Em and (b) Yield zone along the rib pillar for different Em.
Yield zone based on GSI
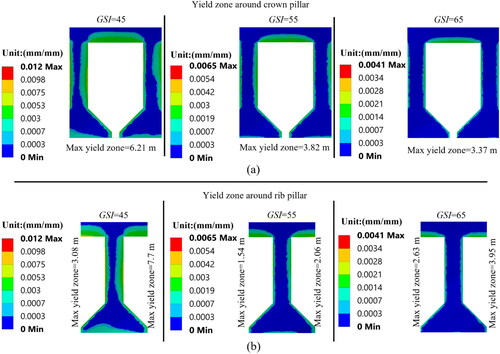
When examining the crown pillar (), a decrease in GSI from 55 to 45 yields a 62.57% increase in the crown pillar and a 273.79% increase in the rib pillar’s () plastic zone. In contrast, varying GSI from 55 to 65 shows different trends for yield zone. In case of the crown pillar, a decrease of 11.78% exhibits when GSI ranges from 55 to 65 and the rib pillar showcases a 91.75% increase in the plastic zone. The result suggests that minimum GSI leads to a 7.7 m yield zone which can further lead to failure of the sidewall.
Figure 19. (a) Yield zone along the crown pillar for different GSI and (b) Yield zone along the rib pillar for different GSI.
Yield zone based on TC and TR
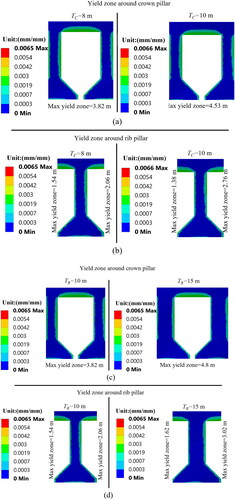
Varying TC between 8 and 10 m yields significant effects on the yield zone, with a percentage increase of 18.59 and 33.98 for the crown and the rib pillars, respectively (, respectively). Whereas, increasing the TR value from 10 m to 15 m induces 25.65% and 46.6% increase in the crown and the rib pillar plastic zone, respectively. The incremental TC and TR leads to the yield zone value increasing from 3.82 to 4.8 m for the crown pillar and from 2.06 to 3.02 m for the rib pillar, reflecting a significant rise in yield zone.
Figure 20. (a) Yield zone along the crown pillar for different TC, (b) Yield zone along the rib pillar for different TC, (c) Yield zone along the crown pillar for different TR, and (d) Yield zone along the rib pillar for different TR.
Pillar stability in terms of factor of safety (FoS)
FoS serves as a critical indicator of stability and safety margins within an u/g metal mine employing the long drill blast hole open stoping method. Understanding its effects across varying D, σci, Em, GSI, TC, TR, and WS is important to understand how these factors influence the overall stability and structural integrity of the mine. illustrates how selected attributes affect the stability of both the crown and rib pillar, quantified in FoS.
Table 13. FoS for various geo-mining conditions.
FoS analysis presents a comprehensive overview of the overarching stability levels across crown and rib pillars under diverse scenarios. The findings underscore the importance of maintaining optimal crown pillar thickness, stope width, and material properties to ensure adequate safety margins. Higher FoS values corresponds to configurations with thicker crown pillars and wider stopes, emphasizing their pivotal roles in increasing structural stability and mitigating potential risks associated with pillar failure. Collectively, these factors intricately shape the fa FoS, directly impacting the stability and safety margins of u/g metal mine employing the long drill blast hole open stoping method. Optimizing these parameters is paramount in enhancing the structural stability and safety of the mine, mitigating potential risks associated with structural failure or instability.
Comparative analysis of simulation result with stability graph approach
The Potvin Stability Graph Method (Potvin Citation1988), developed by Yves Potvin in the late 1980s, has emerged as a prominent technique in geotechnical engineering for evaluating the stability of u/g excavations within rock masses. This method offers a pragmatic framework for assessing excavation stability, particularly in contexts like mining and civil engineering projects where ensuring rock mass stability is critical. Central to the Potvin Stability Graph Method is its reliance on rock mass classification systems, such as the Rock Mass Rating (RMR) or the Q-system. These systems serve to delineate the geological and geo-mechanical attributes of rock masses, using factors such as rock strength, joint orientation, and overall rock quality. By incorporating data derived from these classification systems, engineers can effectively interpretate the overall stability of the rock mass. The graphical representation at the core of the Potvin Stability Graph Method correlates the excavation span, typically measured as the distance between rock supports, with the assigned rock mass rating. This graphical depiction elucidates the intricate relationship between excavation size and the stability of the encompassing rock mass. Notably, the graph typically comprises stability curves or lines, each indicative of varying levels of stability corresponding to distinct rock mass ratings.
Implementing the Potvin Stability Graph Method entails a systematic approach. Initially, engineers conduct a thorough assessment of geological conditions, employing a rock mass classification system to identify pertinent parameters. Subsequently, they locate the appropriate stability curve on the graph based on the assigned rock mass rating. By plotting the excavation span on the graph, engineers can ascertain whether the proposed excavation size falls within the stable region or necessitates additional support measures.
Assessing the reliability of the FE model required comparing it against Potvin’s Stability Graph Method (SGM). Potvin’s method utilizes key parameters such as Hydraulic Radius (HR) and Modified Stability Number (N'). HR is calculated through the ratio of surface area to perimeter, as defined in the EquationEq. (12)(12)
(12) .
(12)
(12)
Meanwhile, N′ combines Rock Quality Index (Q'), rock stress (A), defect orientation (B), and design surface (C) factors in the EquationEq. (13)(13)
(13) .
(13)
(13)
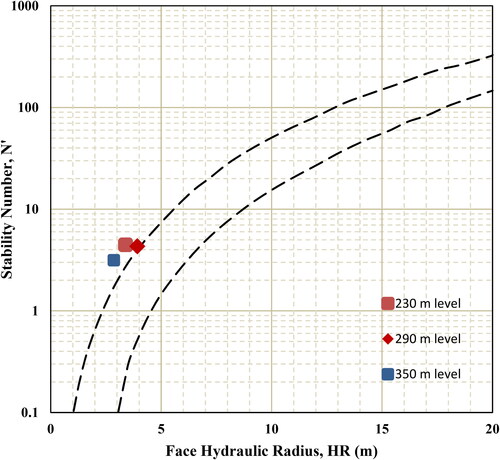
Past geotechnical studies within mining areas provided the Q, A, B, and C values associated with crown pillars and tabulated parameters for crown pillars (GSI = 45, σci=100 MPa, Em=45 GPa, TC=8 m, TR=10 m, and SW=30 m) were utilized to plot a stability graph (), indicating consistent stability across various depths.
Figure 21. Potvin stability graph for crown pillar stability.
Further stability analysis was conducted by determining the factor of safety (FoS) for crown pillars using FE models, as described in EquationEq. (14)(14)
(14) . The resultant FoS values, detailed in , consistently surpass 1 at all depths, signifying stability (Hoek et al. Citation2002). A comparative assessment between FE model outcomes and the SGM revealed similar results, validating the efficacy of the FE simulation findings.
(14)
(14)
where σci = uniaxial compressive strength of intact rock. σ1 and σ3 = effective principal stresses (major and minor, respectively) at failure; mb, s, and a are Hoek–Brown rock mass parameters.
Table 14. FE simulation analysis versus stability graph approach.
For validation of the study, a comparative analysis plot between empirical Potvin’s SGM and numerical simulation results for the crown pillar is presented in . The stability state of stopes analyzed using both SGM and numerical methods demonstrate similar results, thereby further validating the analysis.
Conclusions
In conclusion, the study provides a comprehensive analysis of the distribution of stresses around crown pillars in a mine utilizing the long drill blast hole open stoping method. The findings emphasize the significance of considering various parameters, including stress concentration factors, deformation patterns, yield behaviour, and factor of safety. The study reveals intricate insights into the stability dynamics of crown and rib pillars, shedding light on their behaviour under different conditions.
The research highlights that stress concentration is predominantly centred at the core of the crown pillar due to the robust nature of the adjacent rock mass and heightened horizontal stresses. As depth increases, the κ1 and κ3 values of the crown pillar decrease, attributed to the widened pillar and stress relief within the stope vicinity. Simultaneously, the tensile zone expands, especially under certain geological conditions. Rib pillars, on the other hand, encounter tensile yielding at deeper levels, influenced by factors such as rock mass properties and variations in thickness.
Deformation analysis indicates that while there is not a notable shift in the average deformation profile of the crown pillar, extreme values of certain parameters significantly influence the frequency and extent of deformation. The study identifies a consistent trend where an increase in GSI values from 45 to 55 leads to a significant rise in crown pillar deformation.
The examination of the crown pillar behaviour reveals notable trends, such as the substantial increase in the yield zone with varying depths and the pronounced influence of factors like σci, GSI and TR. The rib pillar exhibits a similar trend, with a notable rise in the yield zone under specific conditions.
The research concludes by emphasizing the viability of operating at lower depths despite an initial reduction in FoS. It suggests that improvements in the overall thickness of the orebody contribute to enhanced stope stability, making it feasible to operate even at greater depths. The scientific research provides valuable insights into the complex interplay of factors affecting the stability of crown and rib pillars in u/g mining. Furthermore, the study underscores the importance of specifications such as specific values governing the pillar dimensions for better utilization of optimization strategies to ensure safe mining operations.
Acknowledgments
The authors express gratitude to the mine management for supplying the essential data needed for this study. This study forms a part of the ongoing doctoral research of the first author. The support extended by the personnel from various departments at IIT(ISM), Dhanbad, is sincerely appreciated. It is important to note that the opinions expressed in this paper solely belong to the authors and do not necessarily reflect the views of their respective organizations.
Disclosure statement
The authors declare that they have no known competing financial interests or personal relationships that could have appeared to influence the work reported in this article.
Data availability statement
The datasets analysed during this study are available from the corresponding author upon reasonable request.
Additional information
Funding
References
- Bakhtavar E, Oraee K, Shahriar K, Ezzeddin B, Kazem O, Kourosh S, Engineering M. 2011. Determination of the Optimum Crown Pillar Thickness between Open Pit and Block Caving. In 29th International Conference on Ground Control in Mining: Dept. of Mining Engineering, College of Engineering and Mineral Resources, West Virginia University; p. 325–332. http://dspace.stir.ac.uk/handle/1893/3086.
- Brady BHG, Brown ET. 2006. Rock mechanics: for underground mining: Kluwer Academic Publishers. https://scholar.google.com/scholar?hl=en&as_sdt=0%2C5&q=Rock+mechanics%3A+for+underground+mining&btnG=.
- Brady B, Lorig L. 1988. Analysis of rock reinforcement using finite difference methods. Comput Geotech. 5(2):123–149. doi: 10.1016/0266-352X(88)90042-0.
- Chen T, Mitri HS. 2021. Strategies for surface crown pillar design using numerical modelling: a case study. Int J Rock Mech Min Sci. 138:104599. doi: 10.1016/j.ijrmms.2020.104599.
- Deb D, Das KC. 2011. Enriched finite element procedures for analyzing decoupled bolts installed in rock mass. Num Anal Meth Geomech. 35(15):1636–1655. doi: 10.1002/nag.970.
- Dhawan KR, Singh DN, Gupta ID. 2002. 2D and 3D finite element analysis of underground openings in an inhomogeneous rock mass. Int J Rock Mech Min Sci. 39(2):217–227. doi: 10.1016/S1365-1609(02)00020-5.
- Dintwe TKM, Sasaoka T, Shimada H, Hamanaka A, Moses DN, Peng M, Fanfei M, Liu S, Ssebadduka R, Onyango JA. 2022. Numerical simulation of crown pillar behaviour in transition from open pit to underground mining. Geotech Geol Eng. 40(4):2213–2229. doi: 10.1007/s10706-021-02022-4.
- Edelbro C. 2003. Rock mass strength: a review [Internet]:92–132. https://www.diva-portal.org/smash/record.jsf?pid=diva2:995907.
- Esterhuizen GS, Dolinar DR, Ellenberger JL, Prosser LJ. 2011. Pillar and roof span design guidelines for underground stone mines. Pittsburgh, PA. https://stacks.cdc.gov/view/cdc/23444.
- Ghasemi E, Kalhori H, Bagherpour R. 2017. Stability assessment of hard rock pillars using two intelligent classification techniques: a comparative study. Tunnelling Underground Space Technol. 68:32–37. doi: 10.1016/j.tust.2017.05.012.
- Guggari V, Kumar H, Budi G. 2023. Stability analysis of crown pillar under the zone of relaxation around sub-level open stopes using numerical modelling. Geomatics Nat Hazards Risk. 14(1). doi: 10.1080/19475705.2023.2234072.
- Guggari VB, Kumar H, Budi G. 2024. Numerical analysis for assessing the effects of crown pillar thickness on ore dilution around the sub-level open stopes. Ain Shams Eng J. 15(1):102301. doi: 10.1016/j.asej.2023.102301.
- Heidarzadeh S, Saeidi A, Rouleau A. 2020. Use of probabilistic numerical modeling to evaluate the effect of geomechanical parameter variability on the probability of open-stope failure: a case study of the Niobec mine, Quebec (Canada). Rock Mech Rock Eng. 53(3):1411–1431. doi: 10.1007/s00603-019-01985-4.
- Hoek E, Carranza-Torres C, Corkum B, others. 2002. Hoek-Brown failure criterion-2002 edition. Proceedings of NARMS-Tac. 1(1):267–273. https://www.rocscience.com/assets/resources/learning/hoek/Hoek-Brown-Failure-Criterion-2002.pdf.
- Hoek E, Marinos P. 2000. Predicting tunnel squeezing problems in weak heterogeneous rock masses. Tunnel Tunnel Intern. 32(11):45–51.
- Kahraman S, Bilgin N, Feridunoglu C. 2003. Dominant rock properties affecting the penetration rate of percussive drills. Int J Rock Mech Min Sci. 40(5):711–723. doi: 10.1016/S1365-1609(03)00063-7.
- Krauland N, Soder PE. 1987. Determining pillar strength-from pillar failure observation. E & MJ-Engng Min J [Internet]. 188(8):34–40. https://www.scopus.com/inward/record.url?eid=2-s2.0-0023400391&partnerID=10&rel=R3.0.0.
- Kumar H, Deb D, Chakravarty D. 2016. Numerical analysis of sill and crown pillar stability for multilevel cut and fill stopes in different geomining conditions. Geotech Geol Eng. 34(2):529–549. doi: 10.1007/s10706-015-9964-7.
- Kvapil R, Blake W. 1973. Geometry and stability determination of large dimension cut and fill rooms at Kamoto. In Proceedings of the Jublee Symposium on Mine Filling; p. 147–154.
- Labuz JF, Zang A, Section AZ, Hazard S, Field S, German G. 2012. Mohr–Coulomb failure criterion. The ISRM Suggested Methods for Rock Characterization, Testing and Monitoring. 2007-2014:227–231. doi: 10.1007/978-3-319-07713-0_19.
- Li C, Zhou J, Armaghani DJ, Cao W, Yagiz S. 2021a. Stochastic assessment of hard rock pillar stability based on the geological strength index system. Geomech Geophys Geo-Energ Geo-Resour. 7(2):47. doi: 10.1007/s40948-021-00243-8.
- Li C, Zhou J, Armaghani DJ, Li X. 2021b. Stability analysis of underground mine hard rock pillars via combination of finite difference methods, neural networks, and Monte Carlo simulation techniques. Underground Space (China). 6(4):379–395. doi: 10.1016/j.undsp.2020.05.005.
- Lu TK, Guo BH, Cheng LC, Wang J. 2008. Review and interpretation of intersection stability in deep underground based on numerical analysis. In Geotechnical aspects of underground construction in soft ground. Boca Raton: CRC Press; p. 815–820. https://api.taylorfrancis.com/content/chapters/edit/download?identifierName=doi&identifierValue=10.1201/9780203879986-123&type=chapterpdf.
- Mark C. 2016. Science of empirical design in mining ground control. Int J Min Sci Technol. 26(3):461–470. doi: 10.1016/j.ijmst.2016.02.015.
- Martin CD, Kaiser PK, Christiansson R. 2003. Stress, instability and design of underground excavations. Int J Rock Mech Min Sci. 40(7–8):1027–1047. doi: 10.1016/S1365-1609(03)00110-2.
- Norén-Cosgriff K, Ramstad N, Neby A, Madshus C. 2020. Building damage due to vibration from rock blasting. Soil Dyn Earthquake Eng. 138:106331. doi: 10.1016/j.soildyn.2020.106331.
- Obert L, Duvall WI, Merrill RH, others. 1960. Design of underground openings in competent rock. US Government Printing Office; https://digital.library.unt.edu/ark:/67531/metadc12741/.
- Potvin Y, Marty H, Potvin Y, Hudyma M, Miller HDS. 1989. Rib pillar design in open stope mining. In 76th Annual Meeting Canadian Pulp and Paper Association (CPPA/ACPPP). Montreal, Quebec. https://www.researchgate.net/publication/281574981.
- Potvin Y. 1988. Empirical open stope design in Canada. University of British Columbia; [Canada]. doi: 10.14288/1.0081130.
- Saeidi A, Heidarzadeh S, Lalancette S, Rouleau A. 2021. The effects of in situ stress uncertainties on the assessment of open stope stability: case study at the Niobec Mine, Quebec (Canada). Geomech Energy Environ. 25:100194. doi: 10.1016/j.gete.2020.100194.
- Shnorhokian S, Mitri HS, Thibodeau D. 2014. A methodology for calibrating numerical models with a heterogeneous rockmass. Int J Rock Mech Min Sci. 70:353–367. doi: 10.1016/j.ijrmms.2014.05.011.
- Tavakoli M. 1994. Underground metal mine crown pillar stability analysis. Wollongong, Australia: University of Wollongong. https://ro.uow.edu.au/theses/1280.
- Urli V, Esmaieli K. 2016. A stability-economic model for an open stope to prevent dilution using the ore-skin design. Int J Rock Mech Min Sci. 82:71–82. doi: 10.1016/j.ijrmms.2015.12.001.
- Xu T, Tang CA, Yang TH, Zhu WC, Liu J. 2006. Numerical investigation of coal and gas outbursts in underground collieries. Int J Rock Mech Min Sci. 43(6):905–919. doi: 10.1016/j.ijrmms.2006.01.001.
- Xu T, Yang T h, Chen C f, Liu H l, Yu Q l 2015. Mining induced strata movement and roof behavior in underground coal mine. Geomech Geophys Geo-Energ Geo-Resour. 1(3-4):79–89. doi: 10.1007/s40948-015-0010-2.
- Zhang M, Shimada H, Sasaoka T, Matsui K, Dou L. 2014. Evolution and effect of the stress concentration and rock failure in the deep multi-seam coal mining. Environ Earth Sci. 72(3):629–643. doi: 10.1007/s12665-013-2985-8.
- Zhang Y, Mitri HS. 2008. Elastoplastic stability analysis of mine haulage drift in the vicinity of mined stopes. Int J Rock Mech Min Sci. 45(4):574–593. doi: 10.1016/j.ijrmms.2007.07.020.