
Abstract
The objective was to determine the minimum drying time required for gummy confections to achieve adequate strength for subsequent handling. Four different fruit confections, containing starch and gelatin as gelling agents, were formed in starch powder molds and dried at 21°C and 35% RH for up to 24 h. Changes in jelly texture were monitored by using Textural Profile Analysis (TPA). Physical parameters related to rheological properties, such as moisture, soluble solids, water activity and pH were also measured. Hardness, gumminess and chewiness increased (P ≤ 0.05) from 12 to 16 h and then stabilized, while cohesiveness and springiness were not affected (P > 0.05) by drying time. The texture stabilized before the moisture content became constant. Modest correlation between data concerning texture, dehydration or pH was found. Texture changes were accurately predicted (R2 = 0.96) using polynomial regression equations. TPA was seen to be a useful tool for adjusting the drying time of gummy confections.
El objetivo fue determinar el tiempo mínimo de secado requerido para que los caramelos de goma logren alcanzar una resistencia adecuada para su posterior manipulación. Cuatro gomas de fruta diferentes, que contenían almidón y gelatina como agentes gelificantes, se formaron en moldes de almidón-polvo y se secaron a 21°C y 35% HR durante un tiempo de hasta 24 h. Los cambios en la textura de las gomas se monitorizaron mediante el análisis del perfil de textura “TPA”. También se midieron parámetros físicos relacionados con las propiedades reológicas, tales como la humedad, sólidos solubles, la actividad de agua y el pH. Los valores de dureza, gomosidad y masticabilidad aumentaron (P ≤ 0,05) de las 12 a las 16 h y después se estabilizaron, mientras que los valores de cohesividad y elasticidad no estuvieron afectados (P > 0,05) por el tiempo de secado. La textura se estabilizó antes de que el contenido en humedad permaneciera constante. Hubo una modesta correlación entre los datos de textura, secado y pH. Los cambios de textura pudieron ser estimados con precisión (R2 = 0,96) utilizando ecuaciones de regresión polinómica. TPA resultó una herramienta útil para ajustar el tiempo de secado de los caramelos de goma.
Introduction
Gummy jellies are obtained from concentrated sugar solutions, gelling agents and other ingredients (Burey, Bhandari, Rutgers, Halley, & Torley, Citation2009). The raw product is first gelatinized by cooking, mixed with acids, colorings and flavoring, and then the molten product is formed in molds of different sizes and/or shapes. The liquor can be prepared by traditional processes, in continuous cookers or in cooker extruders. The final product should achieve at least 75% total soluble solids to preclude mold growth. Depositing (starch or starchless molds), slabbing (flat or contoured) and extrusion can be used as shaping methods; among them, starch molding is particularly recommended in soft and adhesive products, such as gummy jellies, because this method facilitates drying and extraction from the molds (Best, Citation1999). Both cooking and forming can be easily completed in less than 90 min in a modern confectionery factory. After molding, gummy jellies are cooled and dried by air convection in tunnels or chambers to achieve a consistent solid matrix in the shortest possible time. The drying conditions used will depend on the drying system, jelly composition (i.e. with gelatin or not), type of product (crusted or not) and jelly size. For example, a working temperature from 18 to 35°C and RH ranging from 30 to 65% are often used for gummy jellies containing gelatin that are dried inside starch molds. Regardless of which drying method is more or less efficient, the time required for the texture of jellies to stabilize is a limiting step in the performance of continuous processing lines, since, depending on the ingredients used and processing applied, many hours may be needed to achieve adequate strength for subsequent handling, without the risk of deformation and/or breaking.
Gummy jellies are characterized by a firm structure with a softness and chewiness conferred by gelatin, starch or pectin-based gels (Burey et al., Citation2009). This structure is supported by an ungrained soft colloidal system containing gelling agents, sugars, water and other components (Warnecke, Citation1991), where water acts as a plasticizer to aid gel formation (BeMiller & Whistler, Citation2009). Starch increases the hardness of gelatin-based gummy confections (Marfil, Anhê, & Telis, Citation2012). The sugar co-solutes are not part of the polymer network, but can contribute to the formation and rheological behavior of confectionery gels (Morris, Citation1985), while the pH may affect jelly gelation depending on the isoelectric point of the gelatin used, among other factors (Edwards, Citation2000). Moisture plays a critical role during the manufacturing of sugar confections, and in an important factor governing texture (Ergun, Lietha, & Hartel, Citation2010). In general, the texture changes from soft to hard as the moisture content decreases.
Drying reduces moisture and increases the solids content, which may increase hardness and may also modify other textural properties (Vieira et al., Citation2008), while water diffusion has been modeled during the drying of starch-molded confections (Sudharsan, Ziegler, & Duda, Citation2004; Ziegler, MacMillan, & Balcom, Citation2003), although associated texture changes were not studied. Textural changes in jellies can be monitored through texture profile analysis “TPA” (Pons & Fiszman, Citation1996), in which different descriptors are evaluated in relation to deformation under an applied force and measured objectively in terms of the force applied, the distance the force is applied and the time of deformation. Unlike other instrumental tests used to measure the texture, TPA simulates the first two bites of the food mastication process, making the technique very suitable for studying the deformation of viscoelastic materials, such as gummy jellies. Gumminess and chewiness are TPA descriptors that are particularly applicable to gelled confections (Borwankar, Citation1992).
As stated, drying is a resource-intensive process, involving high wastage, and the shorter the time taken to carry this out, the better (Burey et al., Citation2009). The food industry is interested in optimizing processes to achieve maximum production capacity with minimal energy consumption (Sudharsan et al., Citation2004). One major industrial concern, apart from product quality, is processing time. Any drying schedule that can reduce the time to obtain the desired moisture content would reduce operating costs, increase product throughput and minimize quality degradation due to excessively long residence times in the dryer (Chou, Chua, Mujumdar, Hawlader, & Ho, Citation2000). However, extending the drying stage is a common industrial practice to prevent texture defects in gummy jellies. Typical confectionery gum drying times range from 24 to 72 h or more (Sudharsan et al., Citation2004; Ziegler et al., Citation2003). The objective was to determine the minimum drying time required to stabilize the texture of gummy jellies made with different fruit shapes and flavors.
Materials and methods
Gummy jelly manufacturing
Gummy jellies were manufactured following normal industrial procedures in a local factory. Three different batches (190 kg of product per batch) of four different fruit (strawberry, raspberry, orange and peach) jellies were made. details the ingredients used to elaborate the jellies and their proportions. The gelling agents used were acid-thinned corn starch (Cleargum® Mb 76, Roquette Laisa, Valencia, Spain) and type A pork gelatin (Juncá Gelatines, Girona, Spain). Gelatine strength was 240–260 Bloom degrees measured at 6.67 g gelatin per 100 g water and 10°C. The starch and gelatin water solutions were previously prepared in mixing tanks until complete dissolution. The starch was mixed with water at 26°C for 3 min, while gelatin was mixed with hot water at 80°C for 20 min. The major raw ingredients (sucrose, corn syrup, starch solution and gelatin solution) were homogenized in a storage tank and the raw mix was transferred to a continuous cooker at 130°C and 3 kg cm−2 pressure for 2 min for starch gelatinization. Just after cooking, the moisture content was adjusted by applying −0.6 kg cm−2 vacuum pressure to increase the solid soluble content of the hot liquor at 78 °Brix.
Table 1. Gummy jelly ingredients.
Tabla 1. Ingredientes de los caramelos de goma.
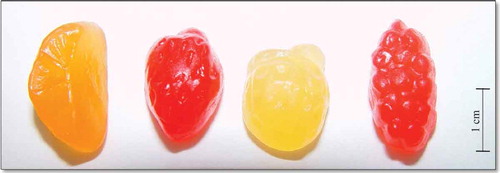
The heat-sensitive ingredients (acidifying, flavoring and coloring solutions) were separately mixed in emulsion tanks (one tank per fruit type) for 10 min at room temperature (about 30°C) and then transferred to a continuous tubular mixing system (at 80°C) to obtain the different fruit-flavored liquors (strawberry, raspberry, orange and peach). The liquors were deposited into the respective starch powder molds () in a continuous forming machine. The trays containing starch powder were previously conditioned at 30°C and 10% RH for up to 24 h. The quantity of liquor deposited in the mold was the same for all the fruit jellies. The trays containing the hot jellies were kept in a drying room with circulating air at 21°C and 35% RH for 12, 16, 20 or 24 h. Drying times lower than 12 h were not applied because the jellies remained too soft to be handled. After drying, the trays were inverted to remove the jellies from the molds and were then gently brushed to eliminate the rest of the starch powder. Finally, the jellies were polished with Carnauba wax using a rotatory drum to avoid a sticky surface to the jellies. The average weight of jelly units at the end of manufacturing process was 2.13 g (strawberry: 2.11; raspberry: 2.15; orange: 2.12; and peach 2.13). Once the jellies were manufactured, the absence (counts lower than 1 log CFU g−1) of molds and yeasts was checked. Molds and yeasts were counted on Rose-Bengal Agar (Oxoid, CM0549) with chloramphenicol (Oxoid, SR0078E) and incubated at 25°C for 5 days (ISO 21527-2, Citation2008).
Figure 1. Different fruit shapes for orange, strawberry, peach and raspberry gummy jellies.
Figura 1. Diferentes formatos frutales (naranja, fresa, melocotón y frambuesa) de los caramelos de goma.
Texture profile analysis
A Texture Profile Analysis “TPA” test was performed using a QTS-25 Texture Analyzer (Brookfield CNS Farnell, Borehamwood, Hertfordshire, England) equipped with a Texture-Pro program v. 2.1. The samples were compressed twice with a flat cylindrical probe (3 mm in diameter), which allowed the sample to be deformed without being penetrated. The testing conditions were: 24°C room temperature; two consecutive cycles of 50% compression; cross-head moved at a constant speed of 30 mm/min and a trigger point of 0.05 N. This speed is recommended to obtain values that are closely correlated with the sensory responses (Pons & Fiszman, Citation1996). The final deformation level was chosen following the recommendations of Pons and Fiszman (Citation1996) and Vieira et al. (Citation2008) for gel food systems. The TPA force–time curve was calculated as described by Bourne (Citation1968) and Mochizuki (Citation2001). shows the texture variables determined by TPA in the gummy jellies. Adhesiveness was not included in TPA because this undesirable characteristic was avoided by polishing the jellies with Carnauba wax. Size and the irregular shape of confectionery gels may affect their TPA values, it is important to prepare standardized samples (Teratsubo, Tanaka, & Saeki, Citation2002). For this reason, all the samples were carefully selected according to their geometry using a calibrator of 0.1 mm accuracy prior to the measurements.
Table 2. Descriptors used in the texture profile analysis of fruit gummy jellies.
Tabla 2. Descriptores empleados en análisis de perfil de textura de caramelos de goma.
Moisture, water activity, total soluble solids and pH
Moisture, water activity, total soluble solids and the pH of gummy jellies were also determined. The moisture content was determined by Karl Fischer titration using an automatic Titrino 702 SM equipped with a No. 6.0338.100 double Pt-wire electrode (Methrom Schweiz, Zofingen, Switzerland). A 0.1 g finely minced sample was dissolved in a working medium composed of 20 ml Hidranal® dry methanol and 20 ml formamide (Sigma-Aldrich, St. Louis, Missouri, USA). Formamide improves the solubility of polar substances in methanol and also accelerates the extraction of water from solids at high temperatures. The sample solution was heated at 50°C to favor sample dissolution and was then titrated to dryness with Hidranal® Composite (Sigma-Aldrich). All the samples were analyzed in triplicate. Water activity was determined using a water activity meter (TH200 Novasina Axair AG, Pfäffikon, Switzerland) with an accuracy of 0.001. The units of gummy jellies were cut in half crosswise and both halves were placed in the sample holder to perform the measurements. All measurements were made at 25°C and in triplicate. Three minutes were used as stabilization time before the measurements were made.
Total soluble solids (expressed as g of total soluble solids contained in 100 g or °Brix) were determined using a hand refractometer (Atago Co. Ltd. Minato-ku, Tokyo, Japan) with an accuracy of 0.01 °Brix. The working range was from 58 to 90 °Brix. A 2-mm-thick sliced sample was located in the visor for the measurements. All samples were performed in triplicate. The pH was measured using a micropH 2001 meter (Crison, Barcelona, Spain) equipped with a glass combined electrode Cat. No. 52–22 (Ingold Electrodes, Wilmington, USA). The samples were cut in thin slices, mixed with hot water (1:3, w:w) and constantly stirred until their complete dissolution. The hot solution was tempered at 25°C prior to measuring the pH. All measurements were performed in triplicate.
Statistical analysis
The model design was completely random and the drying time was considered as the fixed effect. The effects of drying time on the dependent variables were determined by one-way analysis of variance (ANOVA) at each drying time. Sample size was n = 36 (3 jelly units × 4 fruit shapes × 3 manufacturing batches). Thus, a representative sample containing four different geometrical properties was analyzed. The least squares means (LSM) and the significance of the treatment were calculated using type IV sum of squares. A Tukey’s test was used to compare the LSM means, which were considered to be statistically different when P ≤ 0.05. Linear correlations were determined as Pearson’s coefficients to explain the relationship between dependent variables. Statistical analysis was performed using the Statistix 8 package for Windows (Analytical Software, Tallahassee, Florida, USA). Non-linear regression was performed to predict changes in texture as a function of drying time using the Excel 2010 program (Microsoft Corporation, Redmond, WA, USA).
Results and discussion
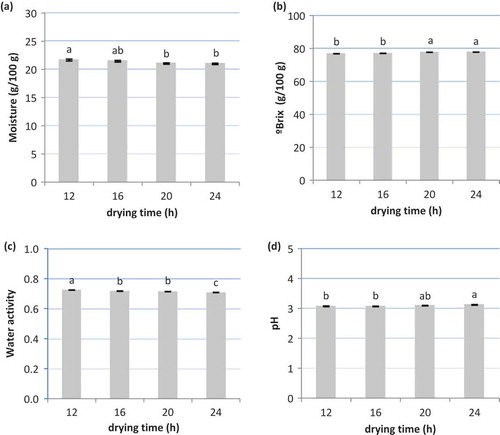
Physical parameters, such as moisture content, °Brix, water activity and pH, are often measured in confectionary factories to control the degree of hydration and the rheological properties of products at different manufacturing stages. The effect (P ≤ 0.05) of drying time on moisture content, total soluble solids, water activity and pH, of gummy jellies is shown in . The average moisture content decreased from 21.7 at 12 h to 21.0 at 20 h and then stabilized. In contrast, the average total soluble solids content increased from 76.9 °Brix at 12 h to 77.7 °Brix at 20 h and then also stabilized. Similarly, the average values of water activity remained constant at 0.72 from 12 to 16 h and then slightly fell to 0.71 from 20 h onwards. The evolution of moisture, soluble solids and water activity values confirmed that no relevant further dehydration occurred after 20 h of drying. However, average pH remained constant at 3.07 from 12 to 16 h and then increased to 3.10 and 3.12 at 20 and 24 h of drying, respectively.
Figure 2. Effects of drying time on (a) moisture content, (b) total soluble solids, (c) water activity and (d) pH of gummy jellies.Note: Means with different superscripts are different at P ≤ 0.05 (standard error of the mean in bars).
Figura 2. Efecto del tiempo de secado sobre el contenido en (a) humedad, (b) sólidos solubles totales, (c) actividad de agua y (d) pH de caramelos de goma.
The effects (P ≤ 0.05) of drying time on TPA values are shown in . Hardness increased from 0.79 (12 h) to 0.88 N (16 h) and then stabilized; gumminess increased from 0.50 (12 h) to 0.56 N (16 h) and then stabilized, while chewiness increased from 1.97 (12 h) to 2.20 N mm (16 h) before stabilizing. However, no changes were noticed in terms of drying time for the average values cohesiveness and springiness, which remained constant at around 0.63 and 3.94 mm, respectively. Moreover, the texture of gummy jellies stabilized at 16 h, meaning that the holding time of trays in the drying room could be shortened from 24 to 16 h to obtain jellies suitable for handling. Texture stabilized 4 h before the moisture content became constant. Pearson’s correlations between physical parameters and TPA properties are shown in . The highest R coefficients (R > 0.45; P ≤ 0.001) correspond to the total solids content vs hardness, gumminess or chewiness, while, for example, the moisture content did not correlate with any texture property. The total solids content also correlated with aw (R = 0.49; P ≤ 0.001) but not (P > 0.05) with the moisture content or pH. It has been reported that hardness increases as the solid content increases in gummy candies (Vieira et al., Citation2008). In our case, the modest R coefficients obtained suggest that texture changes in jellies during drying were not only modulated by dehydration phenomena. Gummy jelly is a moisture intermediate food rich in sugars and other hygroscopic components, which gives it a low aw, and makes it very difficult to dry. It would be necessary to apply higher temperatures and/or lower RH to increase its dehydration rate, but this could delay gel formation and increase the risk of surface crusting. Correlation data suggest that increases in hardness, gumminess and chewiness might be mainly due to the capacity of circulating air to stabilize the gel by cooling, since the moisture content hardly decreased from 21.7% (12 h) to 21.0% (24 h).
Figure 3. Effects of the drying time on (a) hardness, (b) gumminess, (c) chewiness, (d) cohesiveness and (e) springiness of gummy jellies.Note: Means with different superscripts are different at P ≤ 0.05 (standard error mean in bars).
Figura 3. Efecto del tiempo de secado sobre la (a) dureza, (b) gomosidad, (c) masticabilidad, (d) cohesividad y (e) elasticidad de los caramelos de goma.
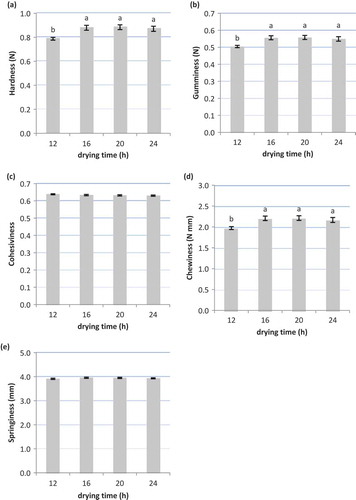
Table 3. Pearson’s correlations between moisture content, total soluble solids, water activity, pH vs texture properties.
Tabla 3. Correlaciones de Pearson entre el contenido en humedad, sólidos solubles totales, actividad de agua, pH vs propiedades de textura.
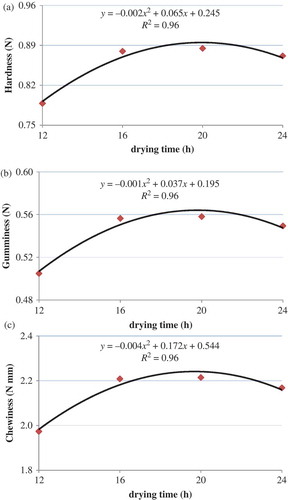
The texture properties that were affected by drying time were used for constructing prediction models. Variations in hardness, gumminess or chewiness were accurately predicted (R2 = 0.96) using polynomial regression equations (), which can also be used to monitor changes in jelly texture during drying. Hardness, gumminess and chewiness are texture descriptors particularly applicable to gelled confections (Borwankar, Citation1992). Hardness is directly proportional to the maximum force required for the jellies to be deformed in the first bite. Gumminess is the result of multiplying hardness × cohesiveness, while chewiness is the result of multiplying hardness × cohesiveness × springiness. In our case, jellies had a high moisture level during drying and their elasticity was not fully developed. Samples remained strongly deformed after the first bite, which decreased their cohesiveness and springiness, whose values strongly depend on mechanical behavior during the second bite. This may explain, on the one hand, why the changes in cohesiveness and springiness during drying were not relevant, and, on the other hand, why hardness, gumminess and chewiness provided similar information to that provided by a simple compression or penetration test. The jelly composition must also be taken into account. The effects of drying on cohesiveness and springiness might have been relevant in jellies with a higher content of gelatin or other gelling agents, because more elastic samples might have better recovered their shape after the first deformation made in the TPA.
Figure 4. Predictive models for (a) hardness, (b) gumminess and (c) chewiness values during drying.
Figura 4. Modelos de predicción para los valores de (a) dureza, (b) gomosidad y (c) masticabilidad durante el secado.
Increases in hardness, gumminess and chewiness through drying can be explained by both gelation and dehydration phenomena. The simultaneous actions of both gelling agents on the colloidal system containing sugars, water and other minor components result in the typical firm and chewy structure of gelled candies (Burey et al., Citation2009; Warnecke, Citation1991). Gelatin gels provide elasticity, while the addition of starch increases the gel strength and hardness of gelatin-based gummy confections (Marfil et al., Citation2012). Dehydration is another important factor in jelly texturizing. The dehydration rate of jellies is higher at the beginning of drying in the starch mold, when water activity is still high (Sudharsan et al., Citation2004; Ziegler et al., Citation2003). Water transfer from jellies to circulating air during drying gradually reduces their moisture content and increases the content of solids. Candy hardness values were dependent on the solids contents (Vieira et al., Citation2008). As has been seen, a significant degree of moisture loss continued after stabilization of the jelly texture. The soluble solids content was more closely correlated with textural changes in jellies than with residual moisture or water activity. In contrast, the pH remained quite stable during jelly drying. Gelatin-based gel strength increases at pH values lower than the isoelectric point of gelatin (Edwards, Citation2000). The isoelectric point of the pork gelatin used ranged from 6.0 to 9.5, and therefore, minor pH variations during drying could have affected the texture of the jellies with added citric and lactic acids. The pH hardly influences starch gelation in gummy confections (Russell & Oliver, Citation1989).
Drying time is a handicap for gummy jelly manufacturing and times ranging from 24 to 72 h or more are commonly applied to dry jellies (Sudharsan et al., Citation2004; Ziegler et al., Citation2003). Drying is an intensive process involving energy consumption (Erbay & Icier, Citation2010; Mujumdar, Citation1997). Moreover, uncontrolled changes in moisture content can lead to quality defects, such as excessive stickiness or hardness, lack of body, loss of chewiness, poor handling or crusting (Lees, Citation1981), which may decrease consumer acceptability (Ergun et al., Citation2010). TPA can be used as a quality control tool to adjust the drying time of gummy jellies. TPA (Lau, Tang, & Paulson, Citation2000; Marfil et al., Citation2012; Siegwein, Vodovotz, & Fisher, Citation2011; Vieira et al., Citation2008) and other instrumental tests, such as stress and strain at fracture (DeMars & Ziegler, Citation2001; Gupta, Sharma, & Sharma, Citation2007) and simple compression (Hayakawa, Kazami, Fujimoto, Kikuchi, & Kohyama, Citation2009), have been used to study different confections.
Little information on TPA in confectionary gels is available in the literature. The magnitudes of the parameters measured through TPA are dependent on testing geometries, so it is important to be consistent as regard sample size and shape when testing products (Burey et al., Citation2009). TPA could be routinely used in confectionery factories for introducing texture specifications so that gummy jellies can be handled without risk of deformation or breakage. Samples can be removed from the forming trays and measured in a few minutes using a texturemeter. The implementation of other instrumental measurements, such as dynamic rheological analysis, is difficult in factories due to the complexity and difficulty in reproducing the drying phenomena that occur in jellies inside starch beds. Sensory assessment could be applied for this purpose; however, texture evaluation by quantitative descriptive analysis requires that a sufficient number of trained panelists be available and data repeatability and standardization are difficult. In contrast, TPA provides objective criteria based on mechanical properties and permits the holding time of gummy jellies in drying rooms to be optimized.
Conclusions
The use of Texture Profile Analysis allows changes in texture during the drying step of gummy confections to be monitored. Texture stabilization precedes drying, so that adequate gel strength is reached before gummy confections completely dry. The required drying time could be overestimated if monitoring is based on moisture content, water activity or °Brix. In contrast, increases in hardness, gumminess and chewiness will allow the texture stabilization time to be known exactly, making it possible to reduce the time, energy and space required to manufacture the confections and resulting in a more productive process. Thus, TPA-based predictive equations can be considered useful for adjusting drying time, so that the resulting jellies can be handled without damage in confectionary factories. This is very important, since the drying step consumes most of the manufacturing time of gummy confections, limiting the productivity of industrial lines.
References
- BeMiller, J., & Whistler, R. (2009). Starch: Chemistry and technology. In J. BeMiller & R. Whistler (Eds.), Food science and technology: International series (3rd ed.). USA: Academic Press.
- Best. 1999. Gum and jellies. In E. B. Jackson (Ed.), Sugar confectionery manufacture. Maryland: Asphen.
- Borwankar, R. P. (1992). Food texture and rheology: A tutorial review. Journal of Food Engineering, 16(1–2), 1–16. doi:10.1016/0260-8774(92)90016-Y
- Bourne, M. C. (1968). Texture profile of ripening pears. Journal of Food Science, 33, 223–226. doi:10.1111/j.1365-2621.1968.tb01354.x
- Burey, P., Bhandari, B., Rutgers, R., Halley, P., & Torley, P. (2009). Confectionery gels: A review on formulation, rheological and structural aspects. International Journal of Food Properties, 12(1), 176–210. doi:10.1080/10942910802223404
- Chou, S. K., Chua, K. J., Mujumdar, A. S., Hawlader, M. N. A., & Ho, J. C. (2000). On the intermittent drying of an agricultural product. Food and Bioproducts Processing, Transactions of the Institution of Chemical Engineers part C, 78(4), 193–203. doi:10.1205/09603080051065296
- DeMars, L. L., & Ziegler, G. R. (2001). Texture and structure of gelatin/pectin-based gummy confections. Food Hydrocolloids, 15, 643–653. doi:10.1016/S0268-005X(01)00044-3
- Edwards, W. P. (2000). The science of sugar confectionery. Cambridge: The Royal Society of Chemistry Publishing.
- Erbay, Z., & Icier, F. (2010). A review of thin layer drying of foods: Theory, modeling, and experimental results. Critical Reviews in Food Science and Nutrition, 50, 441–464. doi:10.1080/10408390802437063
- Ergun, R., Lietha, R., & Hartel, R. W. (2010). Moisture and shelf life in sugar confections. Critical Reviews in Food Science and Nutrition, 50(2), 162–192. doi:10.1080/10408390802248833
- Gupta, R. K., Sharma, A., & Sharma, R. (2007). Textural profile analysis of sunflower-sesame kernel confection (chikki). Journal of Texture Studies, 38, 153–165. doi:10.1111/j.1745-4603.2007.00091.x
- Hayakawa, F., Kazami, Y., Fujimoto, S., Kikuchi, H., & Kohyama, K. (2009). Time-intensity analysis of sourness of commercially produced gummy jellies available in Japan. Food Science and Technology Research, 15(1), 75–82. doi:10.3136/fstr.15.75
- ISO 21527-2. (2008). International organization for standardization publications. Microbiology of food and animal feeding stuffs. Horizontal method for the enumeration of yeasts and moulds – Part 2: Colony count technique in products with water activity greater than 0.95. Retrieved from http://www.iso.org
- Lau, M. H., Tang, J., & Paulson, A. T. (2000). Texture profile and turbidity of gellan/gelatin mixed gels. Food Research International, 33, 665–671. doi:10.1016/S0963-9969(00)00111-3
- Lees, R. (1981). Faults, causes and remedies. In R. Lees (Ed.), The confectionery industry. Surbiton: Specialized Publications Ltd.
- Marfil, P. H. M., Anhê, A. C. B. M., & Telis, V. R. N. (2012). Texture and microstructure of gelatin/corn starch-based gummy confections. Food Biophysics, 7, 236–243. doi:10.1007/s11483-012-9262-3
- Mochizuki, Y. (2001). Texture profile analysis. In R. E. Wrolstad (Ed.), Current protocols in food analytical chemistry (pp. H2.3.1.–H2.3.7). New York, NY: John Wiley & Sons Inc.
- Morris, V. J. (1985). Food gels – Roles played by polysaccharides. In Chemistry and industry (Vol. 5, pp. 159–164). London: Elsevier.
- Mujumdar, A. S. (1997). Drying fundamentals. In C. G. J. Baker (Ed.), Industrial drying of foods (pp. 7–30). London: Chapman & Hall.
- Pons, M., & Fiszman, S. M. (1996). Instrumental texture profile analysis with particular reference to gelled systems. Journal of Texture Studies, 27, 597–624. doi:10.1111/j.1745-4603.1996.tb00996.x
- Russell, P. L., & Oliver, G. (1989). The effect of pH and NaCl content on starch-gel aging: A study by differential scanning calorimetry and rheology. Journal of Cereal Science, 10, 123–138. doi:10.1016/S0733-5210(89)80041-4
- Siegwein, A. M., Vodovotz, Y., & Fisher, E. L. (2011). Concentration of soy protein isolate affects starch-based confections’ texture, sensory and storage properties. Journal of Food Science, 76, E422–E428. doi:10.1111/j.1750-3841.2011.02241.x
- Sudharsan, M. B., Ziegler, G. R., & Duda, J. L. (2004). Modelling diffusion of moisture during stoving of starch-molded confections. Food and Bioproducts Processing, 82(1), 60–72. doi:10.1205/096030804322985335
- Teratsubo, M., Tanaka, Y., & Saeki, S. (2002). Measurement of stress and strain during tensile testing of gellan gum gels: Effect of deformation speed. Carbohydrate Polymers, 47(1), 1–5. doi:10.1016/S0144-8617(00)00338-6
- Vieira, M. A., Rovaris, A. A., Maraschin, M., Desimas, K. N., Pagliosa, C. M., Podestá, R. … Amante, E. R. (2008). Chemical characterization of candy made of Erva-Mate (Ilex paraguariensis A. St. Hil.) residue. Journal of Agricultural and Food Chemistry, 56, 4637–4642. doi:10.1021/jf8011085
- Warnecke, M. (1991). Gums and jelly products and formulations. In Proceedings of 45th P.M.C.A. production conference, April 22–24 (pp. 140–145). Pennsylvania: Hershey.
- Ziegler, G. R., MacMillan, B., & Balcom, B. J. (2003). Moisture migration in starch molding operations as observed by magnetic resonance imaging. Food Research International, 36, 331–340. doi:10.1016/S0963-9969(02)00224-7