
Abstract
The establishment of appropriate analytical methods to authenticate the geographic origin of poultry meat independent of paper record becomes especially important nowadays. In this study, data were analyzed in terms of both the contents of two stable isotopes (C and N) and 12 mineral elements of chicken samples from four provinces to trace their geographical origin. The results showed that classification of chicken was improved by combining both types of data, as compared to that using the mineral element data alone. The present study demonstrates that it is possible to indicate the poultry origin by applying stable isotope and multi-element analysis, which is an effective tool to trace the geographic origin of poultry.
Hoy en día es muy importante el establecimiento de métodos analíticos apropiados para autentificar el origen geográfico de la carne de ave de forma independiente a los estudios publicados. En este estudio, se analizaron los datos según el contenido de 2 isótopos estables (C y N) y 12 elementos minerales de muestras de pollo de 4 provincias para trazar su origen geográfico. Los resultados mostraron que la clasificación del pollo fue mejorada mediante la combinación de los dos tipos de datos, en comparación con la utilización única de elemento mineral. El presente estudio demuestra que es posible indicar el origen de las aves mediante la aplicación del análisis de isótopos estables y multielemento, el cual es una herramienta efectiva para trazar el origen geográfico de las aves.
Palabras clave:
Introduction
The geographical origin of meat strongly influences the consumer’s purchasing interest. The development of appropriate methods to identify the geographic origin of meat products is becoming highly important. Influenza viruses circulating in animals pose severe threats to human health. In China, H5N1, a highly pathogenic avian influenza virus, was first detected in Guangdong Province in 1996, and multiple variations of the avian influenza virus have been found thereafter. The establishment of appropriate analytical methods to authenticate the chicken geographic origin independent of paper record not only improves consumers’ safety, but also rapidly identifies the origin of chicken illness in food incidents.
Utilization of either stable isotope or multi-element analysis has the potential for tracing the geographical origin of food. Recently, there have been many reports on the application of stable isotope and multi-element analysis, followed by chemometrics, to identify the origin of agro-products, including oil (Angerosa et al., Citation1999; Richter, Spangenberg, Kreuzer, & Leiber, Citation2010), milk (Chesson, Podlesak, Thompson, Cerling, & Ehleringer, Citation2008; Chesson, Valenzuela, O’Grady, Cerling, & Ehleringer, Citation2010; Crittenden et al., Citation2007), wine (Dutra et al., Citation2011), tea (Pilgrim, Watlin, & Grice, Citation2010), and so on. In recent years, several studies have been reported on distinguishing the meat origins by various analytical tools (Franke, Gremaud, Hadorn, & Kreuzer, Citation2005; Osorio, Moloney, Schmidt, & Monahan, Citation2011a; Perini, Camin, Bontempo, Rossmann, & Piasentier, Citation2009; Sacco, Brescia, Buccolieri, & Jambrenghi, Citation2005). Characteristic fingerprints of elements may directly depend on the environment that the animals lived in and the locally grown feeds (Franke et al., Citation2005; Millet, Van den, De Smet, & Janssens, Citation2005; Osorio, Moloney, Schmidt, & Monahan, Citation2011b; Reykdal, Rabieh, Steingrimsdottir, & Gunnlaugsdottir, Citation2011). To date, most of the studies using the element analysis technique focused on the geographic traceability of beef, and little attention has been paid to that of poultry. Franke et al. (Citation2007) and Franke, Hadorn, et al. (Citation2008) determined the multiple trace element contents of poultry meat from different countries to identify their geographic origins, and from the results we see that the combination of both oxygen isotope and trace elements did not improve the classification of origin (Franke et al., Citation2007; Franke, Koslitz, et al., Citation2008).
The purpose of the present study was to investigate the potential of multi-element analysis in combination with stable isotope (13C and 15N) for the determination of the geographical origins of chicken samples from four provinces in China. This technique could be a potential method for tracing chicken origin in a wider range.
Material and method
Sample information
Forty chicken pectoral muscle samples collected at four locations in China were investigated, in which 10 chicken samples were collected from Haerbin city Heilongjiang province (referred to as HLJ) (45°N, 125°E) (northeast of China) in August 2013; 10 chicken samples were collected from Datong city Shanxi province (referred to as SX) (40°N, 113°E) (middle-west of China) in July 2013; 10 chicken samples were collected from Nanchang city Jiangxi province (referred to as JX) (28°N, 115°E) (southeast of China) in May 2013; and 10 chicken samples were collected from Xiamen city Fujian province (referred to as FJ) (24°N, 117°E) (south of China) in June 2013. All of the meat samples analyzed were collected from the left side of the pectoral muscles. Detailed geographical description for the locations is shown in .
Table 1. Region information of poultry samples.
Tabla 1. Región de información de las muestras de aves.
Sample pretreatment
Initially, about 50 g sample from chicken breast was lyophilized. Moisture content was determined in triplicate according to the reference (Li et al., Citation2015). The dried meat of 10 g was defatted by Soxhlet extraction using ether for 6h to obtain the protein; in the meantime, fat content was determined by the extraction system. After extraction, the defatted dry mass (DDM) of the chicken breast was ground in a pulverizer and stored at −20°C (Heaton, Kelly, Hoogewerff, & Woolfe, Citation2008; Zhao et al., Citation2013).
Sample analysis
As described in detail previously (Zhao et al., Citation2013), analysis of C and N stable isotopes in DDM was conducted by an isotope ratio mass spectrometer (IRMS). Briefly, the instrument is an elemental analyzer (Flash 2000) combined with IRMS (Delta V, Thermo) through Conflo III. The elements of carbon and nitrogen were converted into CO2 and NOx gas at 960°C. The carrier gas helium flow rate was set at 100 mL/min. Nitrogen and carbon isotope data were reported in δ-notation in a unit of per thousands (‰) relative to the accepted international standards; δ13C‰ was relative to Vienna Pee Dee Belimnite (VPDB) and δ15N‰ was relative to atmospheric AIR. The delta values were calculated as follows:
where δX is the isotope composition of the sample expressed in delta unit (‰, per thousands) relative to the reference material. Rsamp and Rref are the absolute isotope ratio of the sample and reference material, respectively. The reference working gas CO2 was calibrated with USGS24 (δ13CPDB = −16.049‰), and the reference working gas N2 was calibrated with IAEA IAEA600 (δ15Nair = 1‰). The analytical precision was 0.15‰ for both C and N.
Mineral elements were analyzed by inductively coupled plasma mass spectrometry (ICP-MS, X Series 2, Thermo Fisher, America). Standard matter of chicken (GBW10018) was supplied by the Institute of Geophysical and Geochemical Exploration of China and was used for calculating the recovery and accuracy. After the above-mentioned digestion process and ICP-MS analysis, the recovery and the relative standard deviation (RSD) of each element in the standard matter of chicken (GBW10018) were found to be higher than 90% and lower than 10% (measured in triplicate), respectively, indicating the whole analysis method was validated for elemental analysis. Analysis of each sample was performed in triplicate and quantified using external standards analysis (Zhao et al., Citation2013).
Statistical analysis
Statistical analysis of the data (two stable isotopes, 12 mineral elements, moisture, and fat contents) was performed using SPSS 22.0. The Kruskal–Wallis test was applied as a non-parametric comparison for significance analysis of all the parameters. Data of 40 samples with three repetitions from four locations were used. Principal component analysis (PCA) was used to describe the sample cluster from different origins. The purpose of discriminate analysis (DA) was to screen the key factors for distinguishing chicken samples from different origins and to develop a model of each location. DA examined the differences among four groups. Stepwise analysis was carried out because this procedure permitted the model to be established step by step, avoiding over-fitting of the data. Variable selection was based on Wilks’ lambda. A cross-validation procedure was applied to assess the model.
Results and discussion
Isotopic ratio in chicken samples from different regions
The analysis results of stable C and N isotopic ratio of chicken samples are shown in . The results showed that the values of C isotope ratio of chicken DDM were significantly different (Kruskal–Wallis test, P < 0.05) among the samples from various regions (). And the carbon isotope values were in an order of FJ province > HLJ province = SX province > JX province. The average δ15N values of chicken samples from different regions were also significantly different (Kruskal–Wallis test, P < 0.05). Compared to the carbon isotope ratios, the nitrogen isotope ratios of all chicken samples were in a wide range from 1.8‰ to 4.2‰. As shown in , the δ15N values ranged from 2.9‰ to 3.5‰ for HLJ chicken samples, from 3.5‰ to 4.2‰ for SX samples, from 1.8‰ to 2.5‰ for JX samples, and from 2.7‰ to 3.1‰ for FJ samples. Generally, both δ13C‰ and δ15N‰ were in a similar range to those reported previously by our research group (Sun, Wang, & Yang, Citation2008). The combination of C and N stable isotopes was able to distinguish the JX samples from others. However, the samples from the other three locations could not be well differentiated ().
Figure 1. δ13C (a) and δ15N (b) values in defatted poultry meat samples. (c) C and N diagram. Values are expressed by mean values ± SD. δ13C and δ15N values were significantly different among four groups according to the Kruskal–Wallis test, P < 0.05. □HLJ, *SX, ΔJX, +FJ. HLJ, Heilongjiang province; SX, Shanxi province; JX, Jiangxi province; FJ, Fujian province.
Figura Valores 1. δ13C (a) y δ15N (b) en muestras de aves desgrasadas. (c) Diagrama C y N. Los valores están expresados por valores promedio ± SD. Los valores δ13C y δ15N fueron significativamente diferentes entre los cuatro grupos según el Test Kruskal–Wallis, P < 0.05. □HLJ, *SX, ΔJX, +FJ. HLJ, provincia de Heilongjiang; SX, provincia de Shanxi; JX, provincia de Jiangxi; FJ, provincia de Fujian.
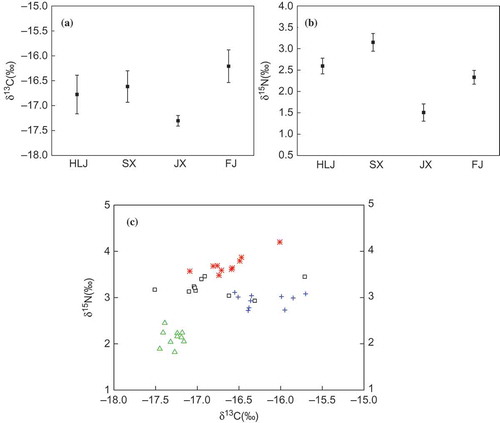
In China, the feeds for chicken are normally produced by local manufacturers, so that the composition of the feeds mainly depends on local crop production, resulting in a close relation between the element composition of chicken samples and their regional origin environment. The δ13C value in meat has been found to be closely related to the feeds composition, especially with the composition of C3 and C4 plant material (Bahar et al., Citation2005; Moreno-Rojas et al., Citation2008). In the present study, all δ13C values of the collected chicken samples ranged from −17.5‰ to −15.7‰, suggesting that the main component of feed was maize, a C4 plant (Knobbe et al., Citation2006; Yanagi et al., Citation2012). The δ13C values of JX chicken samples were lower than those of samples from other locations due to the higher content of rice in the feeds of JX chicken, since these samples were obtained from JX province, one of the largest production locations of rice in China.
The mean δ15N values of chicken samples from different regions exhibited significant difference. The crops used for the feeds are grown by applying chemical fertilizer, resulting in lower δ15N values from −3‰ to 3‰ in the plants that will be delivered to the animals by assimilation (Bahar et al., Citation2008; Kelly, Heaton, & Hoogewerff, Citation2005). In another aspect, the feeds containing pea and soybean utilize atmospheric nitrogen directly, leading to less positive values of δ15N (Heaton et al., Citation2008; Yanagi et al., Citation2012; Zhao et al., Citation2013). Both reasons mentioned above are responsible for the lowest value of δ15N appearing in JX chicken samples.
Multi-element in chicken samples from different regions
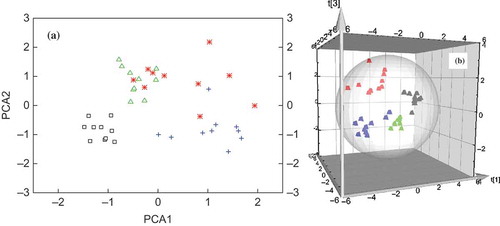
It was shown that the contents of 12 elements, including Na, Mg, K, Ca, Al, Ti, Fe, Cu, Zn, Se, Rb, and Ba, in the defatted chicken samples were different among various locations (). The results indicated that the sample from each region had a typical elemental composition. Among four locations, the HLJ samples had the highest content of Rb; the SX samples had the highest contents of both Al and Cu; the JX samples had the highest contents of Na, K, Fe, and Se; and the FJ samples had the highest contents of Ca, Ba, and Zn. As shown in , the chicken samples from four provinces can be partially differentiated by PCA of the mineral element, in which the HLJ chicken samples can be distinctly separated from the samples from the other three locations. However, it is difficult to distinguish the samples from SX, JX, and FJ by minerals signature.
Table 2. Mineral content (mg element/kg defatted dry meat, μg element/kg defatted dry meat), moisture content and fat content in poultry meat in the provinces of Heilongjiang (northeast), Shanxi (middle-west), Jiangxi (southeast), and Fujian (south) in China.A
Tabla 2. Contenido mineral (elemento mg/kg de carne desgrasada seca, elemento μg/kg de carne desgrasada seca), contenido de humedad y contenido en grasa en las aves en las provincias de Heilongjiang (noreste), Shanxi (medio-oeste), Jiangxi (sureste) y Fujian (sur) en China.A
Figure 2. Principal component analysis of the defatted poultry meat from four regions. (a) PCA of mineral elements; (b) PCA of the combination of minerals and stable isotopes (C and N). □HLJ, *SX, ΔJX, +FJ. HLJ, Heilongjiang province; SX, Shanxi province; JX, Jiangxi province; FJ, Fujian province.
Figura 2. Análisis del componente principal de carne de ave desgrasada de 4 regiones. (a) PCA de los elementos minerales; (b) PCA de la combinación de minerales e isótopos estables (C y N). □HLJ, *SX, ΔJX, +FJ. HLJ, provincia de Heilongjiang; SX, provincia de Shanxi; JX, provincia de Jiangxi; FJ, provincia de Fujian.
It was demonstrated by our results that the chicken samples from each location possessed an identified fingerprint of elemental content. Multiple elements including trace elements were also analyzed as potential parameters for distinguishing the origin of chicken samples since site-specific features can be provided (Franke et al., Citation2007; Furia, Naccarat, Sindona, Stabile, & Tagarelli, Citation2011; Pilgrim et al., Citation2010; Santato, Bertoldi, Perini, Camin, & Larcher, Citation2012). Meanwhile, the concentration of multiple elements is an indicator of the elemental composition of feed (Brunner, Katona, Stefánka, & Prohaska, Citation2010; Pisani, Protano, & Riccobono, Citation2008). Among these four locations, the soil samples from SX, JX, and FJ possessed the highest content of Cu, K, and Zn, respectively (Wei, Zhang, Chen, & Wu, Citation1991). The highest concentration of these three elements was each detected in the chicken samples from the corresponding locations. In addition, the concentrations of some elements such as Fe and Se were higher in the JX samples than in those from other regions due to the accumulative effects of chemical fertilizer since Nanchang was in a main rice production region, JX province. As a result, the accumulation of such elements in the plant can be translocated to the chicken through feeds. In the present study, the standard deviations of Se, K, and Al contents of FJ samples were higher than the others due to the lower sample number and possibly as a result of complex sample source.
Meat composition
The meat composition was determined on the basis of the moisture content and fat content. Group mean values of water and lipid content of meat samples ranged from 69.23% to 71.43% and from 8.55% to 13.05%, respectively (), which is in accordance with previous reports (Durek et al., Citation2014; Li et al., Citation2015). The values measured for water and lipid indicated that the geographical origin did have an influence on meat composition. However, difference could be ascertained to lipid.
Principle component analysis
To classify the chicken samples among these four regions, two stable isotopes and 12 elements were analyzed using PCA (). Around 74.9% of the total variability can be explained by the first four components. PC1, which explained 30.0% variability, was mainly composed of δ13C and Ca, and thus FJ samples could be distinguished from the others. The concentrations of Na, Fe, and Se dominated in PC2 and JX samples could thus be characterized. The factors of δ15N and Cu accounting for the highest weights in PC3 and SX samples can be recognized. Compared to mineral elements’ data alone, the combination of both methods significantly improves the classification of chicken samples of various geographical origins.
Discriminant analysis
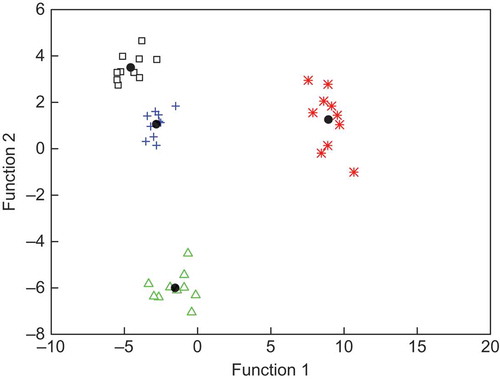
For developing the mathematics model to classify chicken samples from these four different regions, DA was carried out by the SPSS software based on two stable isotopes and 12 elements (), in which five parameters (δ13C‰, δ15N‰, K, Zn, and Rb) were further obtained for the discriminant model. Finally, a satisfactory classification result was obtained with an overall correct classification rate of 100% and a cross-validation rate of 100% ().
Table 3. Classification of poultry samples in different regions and percentage of observations correctly classified.
Tabla 3. Clasificación de las muestras de aves en regiones diferentes y porcentaje de observaciones clasificadas correctamente.
Figure 3. A cross-plot showing the first two discriminate functions obtained from the stepwise canonical discriminate analysis of the stable isotope and trace element data of poultry samples. □HLJ, *SX, ΔJX, +FJ, ●Group centroid. HLJ, Heilongjiang province; SX, Shanxi province; JX, Jiangxi province; FJ, Fujian province.
Figura 3. Diagrama de dispersión que muestra las dos primeras funciones discriminativas obtenidas del análisis discriminatorio progresivo canónico de los isótopos estables y datos de trazado de elementos de las muestras de aves. □HLJ, *SX, ΔJX, +FJ, ●Grupo centroide. HLJ, provincia de Heilongjiang; SX, provincia de Shanxi; JX, provincia de Jiangxi; FJ, provincia de Fujian.
There is little study on the traceability of chicken. In Japan, δ13C of poultry in muscle tissue samples did not differ from other parts of the body, but the values were clearly different among the samples from China, Japan, and America (Sakamoto et al., Citation2002). Franke et al. distinguished the country origins of poultry using δ18O. However, the combination of δ18O and mineral elements did not improve the accuracy of prediction. However, in the present study, the combination of stable isotopes (C and N) and mineral elements did improve the classification of the chicken samples from different locations. The studies suggested that the selection of elements was important, and decided whether the samples could be discriminated. Caron stable isotope has close relation to the feeds composition of C3 and C4 plant material. δ15N is an indicator of the chemical fertilizer and forage applied. The contents of mineral elements reflect the regional environment conditions, including soil, and mineral deposits. As a result, the combination of stable isotopes and mineral elements can improve the differentiation of chicken samples of various origins in theory. The present study has demonstrated that it is possible to determine the geographic origin of chicken by applying both isotope and multi-element analysis, which is an effective tool to trace the poultry’s geographic origin.
Disclosure statement
No potential conflict of interest was reported by the authors.
Additional information
Funding
Related Research Data
References
- Angerosa, F., Bréas, O., Contento, S., Guillou, C., Reniero, F., & Sada, E. (1999). Application of stable isotope ratio analysis to the characterization of the geographical origin of olive oils. Journal of Agricultural and Food Chemistry, 47, 1013–1017. doi:10.1021/jf9809129
- Bahar, B., Moloney, A. P., Monahan, F. J., Harrison, S. M., Zazzo, A., Scrimgeour, C. M., … Schmidt, O. (2008). Turnover of carbon, nitrogen, and sulfur in bovine longissimus dorsi and psoas major muscles: Implications for isotopic authentication of meat. Journal of Animal Science, 87, 905–913. doi:10.2527/jas.2008-1360
- Bahar, B., Monahan, F. J., Moloney, A. P., O’Kiely, P., Scrimgeour, C. M., & Schmidt, O. (2005). Alteration of the carbon and nitrogen stable isotope composition of beef by substitution of grass silage with maize silage. Rapid Communications in Mass Spectrometry, 19, 1937–1942. doi:10.1002/rcm.2007
- Brunner, M., Katona, R., Stefánka, Z., & Prohaska, T. (2010). Determination of the geographical origin of processed spice using multielement and isotopic pattern on the example of Szegedi paprika. European Food Research and Technology, 231, 623–634. doi:10.1007/s00217-010-1314-7
- Chesson, L. A., Podlesak, D. W., Thompson, A. H., Cerling, T. E., & Ehleringer, J. R. (2008). Variation of hydrogen, carbon, nitrogen, and oxygen stable isotope ratios in an American diet. Fast Food Meals. Journal of Agricultural and Food Chemistry, 56, 4084–4091. doi:10.1021/jf0733618
- Chesson, L. A., Valenzuela, L. O., O’Grady, S. P., Cerling, T. E., & Ehleringer, J. R. (2010). Hydrogen and oxygen stable isotope ratios of milk in the United States. Journal of Agricultural and Food Chemistry, 58, 2358–2363. doi:10.1021/jf904151c
- Crittenden, R. G., Andrew, A. S., LeFournour, M., Young, M. D., Middleton, H., & Stockmann, R. (2007). Determining the geographic origin of milk in Australasia using multi-element stable isotope ratio analysis. International Dairy Journal, 17, 421–428. doi:10.1016/j.idairyj.2006.05.012
- Durek, J., Ghadiri Khozroughi, A., Fröhling, A., Schlüter, O., Knorr, F., Mader, A., … Bolling, J. S. (2014). Effects of thermally treated broiler feed with different organic acid levels on resulting meat composition and parameters related to meat quality. Innovative Food Science & Emerging Technologies, 26, 397–405. doi:10.1016/j.ifset.2014.05.001
- Dutra, S. V., Adami, L., Marcon, A. R., Carnieli, G. J., Roani, C. A., Spinelli, F. R., & Vanderlinde, R. (2011). Determination of the geographical origin of Brazilian wines by isotope and mineral analysis. Analytical and Bioanalytical Chemistry, 401, 1571–1576. doi:10.1007/s00216-011-5181-2
- Franke, B. M., Gremaud, G., Hadorn, R., & Kreuzer, M. (2005). Geographic origin of meat – elements of an analytical approach to its authentication. European Food Research and Technology, 221, 493–503. doi:10.1007/s00217-005-1158-8
- Franke, B. M., Hadorn, R., Bosset, J. O., Gremaud, G., & Kreuzer, M. (2008). Is authentication of the geographic origin of poultry meat and dried beef improved by combining multiple trace element and oxygen isotope analysis? Meat Science, 80, 944–947. doi:10.1016/j.meatsci.2008.03.018
- Franke, B. M., Haldimann, M., Reimann, J., Baumer, B., Gremaud, G., Hadorn, R., … Kreuzer, M. (2007). Indications for the applicability of element signature analysis for the determination of the geographic origin of dried beef and poultry meat. European Food Research and Technology, 225, 501–509. doi:10.1007/s00217-006-0446-2
- Franke, B. M., Koslitz, S., Micaux, F., Piantini, U., Maury, V., Pfammatte, R. E., & Kreuzer, M. (2008). Tracing the geographic origin of poultry meat and dried beef with oxygen and strontium isotope ratios. European Food Research and Technology, 226, 761–769. doi:10.1007/s00217-007-0588-x
- Furia, E., Naccarat, A., Sindona, G., Stabile, G., & Tagarelli, A. (2011). Multielement fingerprinting as a tool in origin authentication of PGI food products: Tropea red onion. Journal of Agricultural and Food Chemistry, 59, 8450–8457. doi:10.1021/jf201556e
- Heaton, K., Kelly, S. D., Hoogewerff, J., & Woolfe, M. (2008). Verifying the geographical origin of beef: The application of multi-element isotope and trace element analysis. Food Chemistry, 107, 506–515. doi:10.1016/j.foodchem.2007.08.010
- Kelly, S. D., Heaton, K., & Hoogewerff, J. (2005). Tracing the geographical origin of food: The application of multi-element and multi-isotope analysis. Trends in Food Science & Technology, 16, 555–567. doi:10.1016/j.tifs.2005.08.008
- Knobbe, N., Vogl, J., Pritzkow, W., Panne, U., Fry, H., Lochotzke, H. M., & Preiss-Weigert, A. (2006). C and N stable isotope variation in urine and milk of cattle depending on the diet. Analytical and Bioanalytical Chemistry, 386, 104–108. doi:10.1007/s00216-006-0644-6
- Li, K., Chen, L., Zhao, -Y.-Y., Li, Y.-P., Wu, N., Sun, H., … Zhou, G.-H. (2015). A comparative study of chemical composition, color, and thermal gelling properties of normal and PSE-like chicken breast meat. CyTA-Journal of Food, 13, 213–219. doi:10.1080/19476337.2014.941411
- Millet, S., Raes, K., Van Den Broeck, W., De Smet, S., & Janssens, G. P. J. (2005). Performance and meat quality of organically versus conventionally fed and housed pigs from weaning till slaughtering. Meat Science, 69, 335–341. doi:10.1016/j.meatsci.2004.08.003
- Moreno-Rojas, J. M., Vasta, V., Lanza, A., Luciano, G., Ladroue, V., Guillou, C., & Priolo, A. (2008). Stable isotopes to discriminate lambs fed herbage or concentrate both obtained from C3 plants. Rapid Communications in Mass Spectrometry, 22, 3701–3705. doi:10.1002/rcm.3773
- Osorio, M. T., Moloney, A. P., Schmidt, O., & Monahan, F. J. (2011a). Beef authentication and retrospective dietary verification using stable isotope ratio analysis of bovine muscle and tail hair. Journal of Agricultural and Food Chemistry, 59, 3295–3305. doi:10.1021/jf1040959
- Osorio, M. T., Moloney, A. P., Schmidt, O., & Monahan, F. J. (2011b). Multielement isotope analysis of bovine muscle for determination of international geographical origin of meat. Journal of Agricultural and Food Chemistry, 59, 3285–3294. doi:10.1021/jf1040433
- Perini, M., Camin, F., Bontempo, L., Rossmann, A., & Piasentier, E. (2009). Multielement (H, C, N, O, S) stable isotope characteristics of lamb meat from different Italian regions. Rapid Communications in Mass Spectrometry, 23, 2573–2585. doi:10.1002/rcm.4140
- Pilgrim, T. S., Watlin, G. R. J., & Grice, K. (2010). Application of trace element and stable isotope signatures to determine the provenance of tea (Camellia sinensis) samples. Food Chemistry, 118, 921–926. doi:10.1016/j.foodchem.2008.08.077
- Pisani, A., Protano, G., & Riccobono, F. (2008). Minor and trace elements in different honey types produced in Siena County (Italy). Food Chemistry, 107, 1553–1560. doi:10.1016/j.foodchem.2007.09.029
- Reykdal, O., Rabieh, S., Steingrimsdottir, L., & Gunnlaugsdottir, H. (2011). Minerals and trace elements in Icelandic dairy products and meat. Journal of Food Composition and Analysis, 24, 980–986. doi:10.1016/j.jfca.2011.03.002
- Richter, E. K., Spangenberg, J. E., Kreuzer, M., & Leiber, F. (2010). Characterization of rapeseed (Brassica napus) oils by bulk C, O, H, and fatty acid C stable isotope analyses. Journal of Agricultural and Food Chemistry, 58, 8048–8055. doi:10.1021/jf101128f
- Sacco, D., Brescia, M. A., Buccolieri, A., & Jambrenghi, A. C. (2005). Geographical origin and breed discrimination of Apulian lamb meat samples by means of analytical and spectroscopic determinations. Meat Science, 71, 542–548. doi:10.1016/j.meatsci.2005.04.038
- Sakamoto, N., Ishida, T., Arima, T., Idemitsu, K., Inagaki, Y., Furuya, H., & Tawaki, S. (2002). Concentrations of radiocarbon and isotope compositions of stable carbon in food. Journal of Nuclear Science and Technology, 39, 323–328. doi:10.1080/18811248.2002.9715196
- Santato, A., Bertoldi, D., Perini, M., Camin, F., & Larcher, R. (2012). Using elemental profiles and stable isotopes to trace the origin of green coffee beans on the global market. Journal of Mass Spectrometry, 47, 1132–1140. doi:10.1002/jms.3018
- Sun, F. M., Wang, H. W., & Yang, S. M. (2008). Application of carbon, nitrogen, sulfur and hydrogen stable isotope in chick origin traceability. Journal of Instrumental Analysis, 27, 925–929.
- Wei, F. S., Zhang, C. J., Chen, J. S., & Wu, Y. Y. (1991). Study on the background contents on 61 elements of soil in China. China Environmental Sciences -Chin, 12, 12–19.
- Yanagi, Y., Hirooka, H., Oishi, K., Choumei, Y., Hata, H., Arai, M., & Kumagai, H. (2012). Stable carbon and nitrogen isotope analysis as a tool for inferring beef cattle feeding systems in Japan. Food Chemistry, 134, 502–506. doi:10.1016/j.foodchem.2012.02.107
- Zhao, Y., Zhang, B., Chen, G., Chen, A. L., Yang, S. M., & Ye, Z. H. (2013). Tracing the geographic origin of beef in China on the basis of the combination of stable isotopes and multielement analysis. Journal of Agricultural and Food Chemistry, 61, 7055–7060. doi:10.1021/jf400947y