
ABSTRACT
We assessed the effects of ultrasonic frequency, power, temperature and exposure time on the electric conductivity (EC) of wine to evaluate the feasibility of the online EC monitoring as an indicator to reflect the changes of wine quality under the ultrasound irradiation. Results showed that the continuously monitored curve of EC was significantly different from the values recorded at the beginning and end of sonication. An abrupt rise and a rapid drop of wine EC were observed at the start and end points of sonication, respectively, in all working conditions. With regards to the assayed wine temperatures, the effect exerted by this parameter on EC before sonication was totally different from that observed when the samples were cooled down after ultrasound treatment. All in all, these results suggest that the online EC monitoring of wine may be used as an efficient indicator to control and reflect the real changes of wine under ultrasound treatment.
RESUMEN
Hemos estudiado los efectos de la frecuencia de ultrasonido, la potencia, la temperatura y el tiempo de exposición en la conductividad eléctrica (EC) del vino para evaluar la viabilidad del seguimiento EC online como indicador para reflejar los cambios en la calidad del vino bajo irradiación de ultrasonido. Los resultados mostraron que la curva de EC supervisada en continuo fue significativamente diferente de los valores registrados al principio y al final de la sonicación. Se observaron un aumento brusco y una rápida caída de EC del vino al principio y al final de la sonicación, respectivamente, para todas las condiciones estudiadas. En referencia a las temperaturas testadas del vino, el efecto ejercido por este parámetro en EC antes de la sonicación fue totalmente distinto de aquel observado cuando se enfriaron las muestras después del tratamiento de ultrasonido. En resumen, estos resultados sugieren que el seguimiento online de EC del vino podría ser utilizado como un indicador eficiente para controlar y reflejar los cambios reales en el vino con el uso de tratamiento de ultrasonido.
PALABRAS CLAVE:
1. Introduction
As a low-cost, non-hazardous and environmentally friendly novel technology, ultrasound has recently attracted great attention in food industry, especially due to its significant effects on the chemical, physical, biochemical and microbial properties of foodstuffs (Martín, Zhang, Castro, Barbosa-Cánovas, & Swanson, Citation1994), which is attributed to the acoustic cavitation generated by ultrasound. Moreover, in some applications, both the physical forces and chemical reactions are useful. Regarding its utilization in food processing, several processes have been applied efficiently including freezing, cutting, drying, tempering, bleaching, sterilization, filtration, emulsification and extraction (Chandrapala, Oliver, Kentish, & Ashokkumar, Citation2012; Chemat, Zill-e-Huma, & Khan, Citation2011; Zhang et al., Citation2015a). Besides the above-mentioned applications, ultrasound has shown great potential for accelerating the ageing process of wine in order to obtain a homogeneous wine solution resembling a liquid that has been subject to many years of natural ageing (Chang & Chen, Citation2002; Chang, Citation2004; García Martín & Sun, Citation2013; Tao, García Martín, & Sun, Citation2014). As expected, it has been proved to be effective in modifying the quality of wines and fruit juices (Cheng, Soh, Liew, & Teh, Citation2007; Tiwari, Patras, Brunton, Cullen, & O’Donnell, Citation2010; Zhang, Shen, Fan, & García Martín, Citation2015b; Zheng, Zhang, Fang, & Liu, Citation2014); that is, ultrasound has a promising industrial application in this field in the near future.
Electrical conductivity (EC) is an electrical phenomenon which is defined as the measure of a material’s ability to accommodate the transport of an electric charge. It represents an important physicochemical property of the food products and has been used to determine the changes of nutrients like vitamins, minerals, fatty acids and proteins, or evaluate food quality during food processing (Colombié, Latrille, & Sablayrolles, Citation2007, Citation2008; Martín et al., Citation1994; Zhang, Citation2007). Furthermore, the EC of a solution is highly proportional (but not totally) to its ion concentration. In some situations, however, conductivity may not correlate directly to concentration. Regarding the EC in food exposed to ultrasound, significant changes have been observed by Jambrak, Mason, Paniwnyk, and Lelas (Citation2007) and Aadil, Zeng, Han, and Sun (Citation2013), but all the changes were measured discontinuously during ultrasonic treatment; i.e. the values of EC were recorded at a fixed time in one experimental run. Interestingly, our study indicates that the value measured discontinuously at a given time is very different from the value monitored by the real time at the same given time during sonication. The online monitoring of EC during winemaking could be used as a reliable and cheap sensor. In this sense, Colombié (Colombié et al., Citation2007, Citation2008) illustrated the good correlation of EC with assimilable nitrogen and pH during fermentation. An estimation of the wine cold stability after fermentation (to prevent tartaric salts from precipitating out the wine when stored) based on the decrease in conductivity of the wine over a period of time has been proposed as well (Zoecklein, Fugelsang, Gump, & Nury, Citation1995). Considering the chemical effects of ultrasound, in our opinion, the online EC measuring may be used as an indicator to reflect the real changes of food under sonication.
The real-time evaluation of changes in a specific compound of wine during sonication is difficult because of the complex composition of wine. Furthermore, most of the methods for wine characterization are destructive and thereby cannot be monitored online. Therefore, the monitoring of wine quality by means of EC online measures would be highly useful to assess the effects of ultrasound on wine. However, to the best of our knowledge, there is currently no available report for the online monitoring of EC in wine under sonication. The main objective of this study is to investigate the effect of ultrasound on the kinetic changes of EC in wine and evaluate the feasibility of using EC as an indicator to monitor the status of wine under sonication in the future.
2. Materials and methods
2.1. Materials
A wine of Cabernet Sauvignon from the vintage of 2012 was used throughout this research, which was kindly donated by Danfeng Winery Co. Ltd., Shaanxi, China.
2.2. Methods
2.2.1. Ultrasound experimental design and data collection
The sonication was carried out in ultrasonic cleaning bath KQ-300VDE (Kunshan Ultrasonic Equipment Co. Ltd., Jiangsu Province, China). The ultrasonic bath can work at the frequencies of 45, 80 and 100 kHz with a variable power output (maximum power 300 W). Ultrasonic energy was delivered from the bottom to the water in the tank by six annealed transducers. For each experimental run, 30 mL of red wine was loaded into a 50-mL glass Erlenmeyer flask sealed with a plastic film, and then placed in the water bath and fixed well in the same position during ultrasonic treatment.
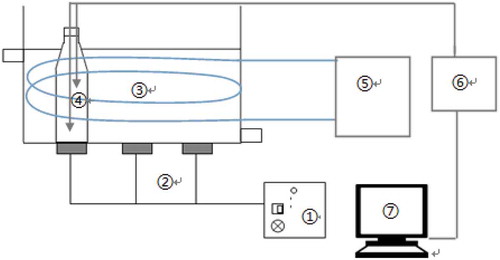
The changes of EC mediated by ultrasound were monitored using a Leici DDSJ-308 F digital conductometer (Shanghai YiDian Scientific Instrument Co. Ltd., China), which is connected to a REX 2.0 software of running Data Collector (Shanghai, YiDian Scientific Instrument Co. Ltd. China), a T-818-B-6 temperature sensor and a DJS-1D conductivity immersion electrode. The ultrasonic temperature was controlled by a Xiangya DLSB-5/20 circulation pump of closed-loop cryogenic refrigerator (Shanghai, China). Throughout the experiments, the EC data were recorded every 6 seconds. The experimental set-up is shown in .
Figure 1. Experimental set-up of ultrasonication: (1) ultrasonic generator; (2) transducer; (3) water bath; (4) 50-mL glass Erlenmeyer flask; (5) circulation pump of closed-loop cryogenic refrigeration; (6) electric conductometer; (7) PC.
Figura 1. Ajuste experimental para la ultrasonicación: (1) Generador ultrasónico; (2) Transductor; (3) Banyo de agua; (4) 50-mL de Erlenmeyer en frasco de vidrio; (5) Bomba de circulación de refrigeración criogénica en circuito cerrado; (6) Conductímetro electric; (7) del monitor.
Four experimental sets were performed in this study. First, the effect of ultrasound frequencies of 45, 80 and 100 kHz on EC in wine was monitored at the conditions of 300 W, 20 minutes and 20°C. Subsequently, the effects of different ultrasonic power levels, namely 120, 150, 180, 210, 240, 270 and 300 W, were investigated on the EC changes in wine, and the sonication was performed at 20°C for 20 min with the frequency of 100 kHz. Third, the effect of ultrasound exposure (20, 40, 60 and 100 min) was conducted with the ultrasonic conditions of 20°C, 100 kHz and 300 W. Finally, investigations were carried out with water bath temperatures of 20, 30, 40, 50 and 60°C, with a frequency of 100 kHz and a power of 300 W for 20 min.
3. Results and discussion
3.1. Effect of ultrasound frequencies on the kinetic changes of EC in wine
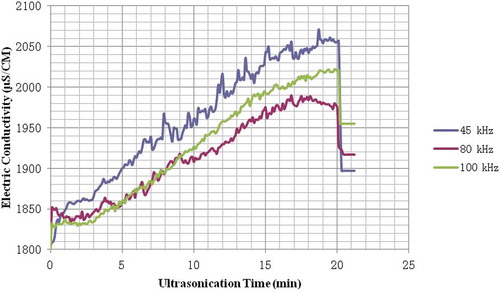
As shown in , the kinetic changes of EC were monitored online in wines treated at three ultrasonic frequencies of 45, 80 and 100 kHz, respectively. As a whole, the curves of EC in wine demonstrated a stable rising trend as a function of time during ultrasonic treatment. A sudden rise and a sudden drop of the EC were observed at the very beginning of ultrasonic irradiation and just when the ultrasound generator was turned off, respectively. Moreover, the sudden drop was followed by a stable value of the EC at the selected water bath temperature. In general, the EC of the wine treated with 45 kHz ultrasound increased quicker, and its value was higher than that of the others at a given time during the ultrasonic treatment. On the contrary, based on the final readings of EC after ultrasonic irradiation, the frequency of 45 kHz had the minimum influence on the EC of wine in comparison to 80 and 100 kHz. Furthermore, compared to the other curves of EC, the EC values recorded with 45 kHz ultrasound had a larger fluctuation during ultrasound treatment.
Figure 2. Effect of ultrasonic frequencies on the kinetic changes of EC in wine.
Figura 2. Efecto de las frecuencias ultrasónicas en los cambios cinéticos de EC en el vino.
Generally, the EC of a solution is considered as the total contributions of individual ions, and molar equivalent conductivity from the viewpoint of microscopic level (Singh & Heldman, Citation2001). Recently, ultrasound has been proved to have the potential to rapidly modify the composition of some kinds of wine, which is attributed to the local high temperatures and pressures generated during the explosion of cavitation bubbles (Chang & Chen, Citation2002; Zhang et al., Citation2015b). And these local high temperatures (>5000°C) and pressures (>1000 atm) caused by the collapsing of gas bubbles would lead to the dissociation of water vapour into hydroxyl radicals and hydrogen radicals (Kanthale, Gogate, Pandit, & Marie-Wilhelm, Citation2003; Riesz & Kondo, Citation1992; Suslick, Hammerton, & Cline, Citation1986), which then initiate a chain of chemical reactions, and consequently the conductivity of the red wine solution would increase. That is to say, the radicals and ions induced by ultrasonic radiation contributed to the increase of EC in food during sonication (Castellanos, Reyman, Sieiro, & Calle, Citation2001; Zhang et al., Citation2015c).
Furthermore, the amount of hydroxyl radicals generated by ultrasound cavitation increases with the increasing of frequency from 20 to 358 kHz (Ashokkumar et al., Citation2008; Campo, Coles, Marken, Compton, & Cordemans, Citation1999; Gambuteanu & Alexe, Citation2013; Zhang et al., Citation2015c). As known, an increase in the ultrasound frequency increases the number of active cavitation bubbles, and the cavitation bubbles are primarily transient at the frequency of 45 kHz, whereas stable bubbles are generated at higher frequencies. Both stable cavitation and an increase in the number of active bubbles can be expected to increase the amount of free radicals generated with an increase in the ultrasound frequency (Ashokkumar et al., Citation2008; Leighton, Citation1994). So 80 and 100 kHz ultrasound would definitely have produced more free radicals and ions than 45 kHz ultrasound, and consequently trigger more chemical reactions, thus provoking more changes in physicochemical properties of wine.
Due to the mass transfer effect of ultrasound on the small particles in wine (Birkin & Silva-Martinez, Citation1996), the Brownian movement of the microscopic particles in red wine started increasing at the very beginning of ultrasound exposure, and returned to its normal status once the sonication was terminated (Qiu, Hu, Xie, & Zhang, Citation1998). This could explain the observed facts in .
3.2. Effect of ultrasound power levels on the kinetic changes of EC in wine
The effects of ultrasound power levels (from 120 to 300 W) on the kinetic changes of EC in wine are depicted in . As a whole, there was again a rising trend of EC under all the ultrasonic power levels employed. Furthermore, the power level has a significant effect on the changes of EC during the ultrasonic treatment, which suggests a positive correlation between them.
Figure 3. Effect of ultrasonic power on the kinetic changes of EC in wine.
Figura 3. Efecto de la potencia ultrasónica en los cambios cinéticos de EC en el vino.
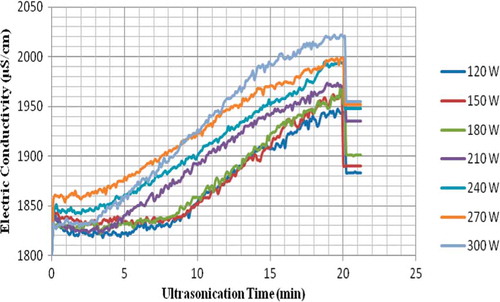
Once the ultrasound treatment was finished, the EC decreased and reached a stable value for all the power levels tested. These stable values of EC were notably higher than those before sonication. As observed in , the higher the ultrasound power level, the higher this final EC reading. This could be explained by the ultrasound intensity.
Ultrasound intensity is defined by ultrasound power, and intensity increases at the same vibration area with power. Ultrasound intensity has a strong influence on the collapse pressures and temperatures as well as the number of free radicals generated, creating an extreme environment which induces a chain of chemical reactions in wine (Gogate & Pandit, Citation2004). In addition, an increase in ultrasound intensity has the potential to contribute to an increase in the acoustic amplitude. The collapsing time, and temperature and pressure generated from collapses of bubbles are all dependent on the acoustic amplitudes, and the cavitational bubble collapse is more violent at higher acoustic amplitudes (Dukkanci & Gunduz, Citation2006; Zhang et al., Citation2015a). Besides that, the increase in intensity could also result in greater sonochemical effects on the collapsing bubbles. On the other hand, when ultrasound intensity is increased, more ultrasonic energy is delivered to the wine samples. Due to this energy, the pulsation and collapse of bubbles occur more rapidly, and more hydroxyl radicals and hydrogen radicals are released from the bubbles (Makino, Mossoba, & Riesz, Citation1982; Zhang et al., Citation2015c), which then initiate a chain of chemical reactions, increasing consequently the conductivity of the red wine.
3.3. Effect of ultrasonic time on the changes of EC in wine
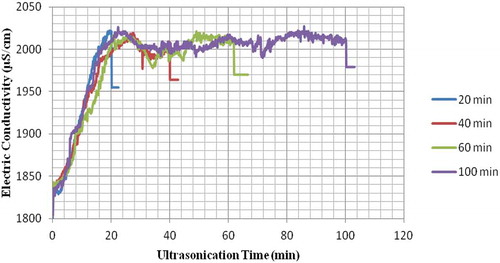
The EC rapidly increased with the increase of ultrasound exposure time roughly during the first 20 min, following by a stabilization in the EC reading over time (). This is in accordance with the results reported by Feng et al. (Citation1991). These authors pointed out that the yield of hydroxyl radicals in aqueous solution induced by ultrasound increased at the initial stage, and then tended to stabilize with the further increase of sonication time (Feng et al., Citation1991). Although the trends of EC changes in wine were very similar, and no significant differences were observed at a given time, the final readings recorded when ultrasound treatment stopped were significantly different. To be specific, the longer the treatment is, the larger the EC changes in wine will be.
Figure 4. Effect of ultrasonic time on the kinetic changes of EC in wine.
Figura 4. Efecto del tiempo de ultrasonido en los cambios cinéticos de EC en el vino.
3.4. Effect of ultrasonic temperature on kinetic changes of EC in wine
The temperature of the water bath, and consequently the temperature of wine, had a great effect on the EC. Prior sonication, the increase of the wine temperature led to a notable increase of the EC (). The effect exerted by temperature on wine EC was greater than those of the different ultrasound powers and frequencies assayed in this work (Figures 2 and 3).
Figure 5. Effect of ultrasonic temperature on the kinetic changes of EC in wine.
Figura 5. Efecto de la temperatura de ultrasonido en los cambios cinéticos de EC en el vino.
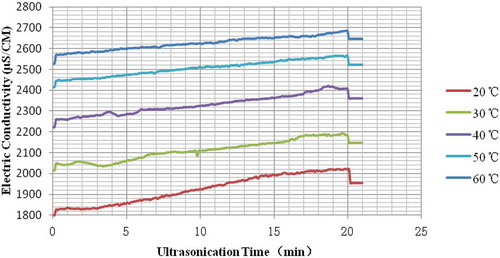
The highest and the lowest values of EC registered before ultrasound treatment were 2520 and 1800 μs/cm, which were achieved at the wine temperatures of 60°C and 20°C, respectively. And the final readings of EC ranked in the same order as at the beginning of ultrasound treatment, i.e. the higher the temperature, the higher the wine EC. However, when the ultrasonically treated wines were let cool down to 20°C (The time which required to cool down the samples from 60°C to 20°C was 35 min by using a circulation pump of closed-loop cryogenic refrigerator), the opposite trend was found (), so that wines treated with ultrasound at the highest temperatures showed the lowest EC. Probably due to that the increased temperature will reduce the cavitation intensity and the higher the temperature, the lower the conductivity.
Table 1. Final EC readings of ultrasonically treated wines after cooling down to 20°C.
Tabla 1. Lecturas finales de EC del vino después del tratamiento ultrasónico y enfriadas a 20°C.
Generally, temperature can influence the ions mobility of food and consequently their EC. Zhang (Citation2007) reported that the EC of some liquid foods (such as beer, coffee, fruit juice, milk and vegetable juice) increased with the increasing of temperature, which was in accordance with what we have found in this research. It has been reported a decrease of cavitation intensity with the increase of temperature during ultrasound treatment (Löning, Horst, & Hoffmann, Citation2002; Speight, Citation1999; Thompson & Doraiswamy, Citation1999). If cavitation intensity decreases, less hydroxyl and hydrogen radicals will be induced and thereby the effect on EC will be lower (Zhang et al., Citation2015c). This could account for the value of EC of the sample treated at 60°C after cooling down to 20°C.
4. Conclusions
In summary, the EC of wine was definitely influenced by the ultrasonic irradiation and operational temperature under all the conditions employed. Furthermore, the kinetic changes of EC monitored in real time were significantly different than the values measured at intervals during sonication. When operating at different wine temperatures, opposite effects were found. The highest conductivities were reached during sonication at the highest temperature assayed (60°C) while the minimum EC value was found at this temperature after cooling down the wine to 20°C once ultrasound treatment was over. These results suggest that the EC of wine might be considered as an important and simple indicator to monitor the status of chemical reactions in wine during ultrasonic irradiation in the future. However, considering the fact that the correlation between the EC and the chemical reactions induced by ultrasound within wine remains to be demonstrated, further investigations will be conducted to confirm it and illustrate the potential of online EC monitoring for following the changes in wine during sonication.
Disclosure statement
The authors declare that there is no conflict of interest.
Additional information
Funding
References
- Aadil, R. M., Zeng, X.-A., Han, Z., & Sun, D.-W. (2013). Effects of ultrasound treatments on quality of grapefruit juice. Food Chemistry, 141, 3201–3206. doi:10.1016/j.foodchem.2013.06.008
- Ashokkumar, M., Sunartio, D., Kentish, S., Mawson, R., Simons, L., Vilkhu, K., & Versteeg, C. (. (2008). Modification of food ingredients by ultrasound to improve functionality: A preliminary study on a model system. Innovative Food Science & Emerging Technologies, 9, 155–160. doi:10.1016/j.ifset.2007.05.005
- Birkin, P. R., & Silva-Martinez, S. (1996). A study of the effect of ultrasound on mass transport to a microelectrode. Journal of Electroanalytical Chemistry, 416, 127–138. doi:10.1016/S0022-0728(96)04742-0
- Campo, F. J. D., Coles, B. A., Marken, F., Compton, R. G., & Cordemans, E. (1999). High-frequency sonoelectrochemical processes: Mass transport, thermal and surface effects induced by cavitation in a 500 kHz reactor. Ultrasonics Sonochemistry, 6, 189–197. doi:10.1016/S1350-4177(99)00017-6
- Castellanos, M. M., Reyman, D., Sieiro, C., & Calle, P. (2001). ESR-spin trapping study on the sonochemistry of liquids in the presence of oxygen. Evidence for the superoxide radical anion formation. Ultrasonics Sonochemistry, 8, 17–22. doi:10.1016/S1350-4177(99)00047-4
- Chandrapala, J., Oliver, C., Kentish, S., & Ashokkumar, M. (2012). Ultrasonics in food processing. Ultrasonics Sonochemistry, 19, 975–983. doi:10.1016/j.ultsonch.2012.01.010
- Chang, A. C. (2004). The effects of different accelerating techniques on maize wine maturation. Food Chemistry, 86, 61–68. doi:10.1016/j.foodchem.2003.08.010
- Chang, A. C., & Chen, F. C. (2002). The application of 20 kHz ultrasonic waves to accelerate the aging of different wines. Food Chemistry, 79, 501–506. doi:10.1016/S0308-8146(02)00226-1
- Chemat, F., Zill-e-Huma, & Khan, M. K. (2011). Applications of ultrasound in food technology: Processing, preservation and extraction. Ultrasonics Sonochemistry, 18, 813–835. doi:10.1016/j.ultsonch.2010.11.023
- Cheng, L. H., Soh, C. Y., Liew, S. C., & Teh, F. F. (2007). Effects of sonication and carbonation on guava juice quality. Food Chemistry, 104, 1396–1401. doi:10.1016/j.foodchem.2007.02.001
- Colombié, S., Latrille, E., & Sablayrolles, J.-M. (2007). On-line estimation of assimilable nitrogen by electrical conductivity measurement during alcoholic fermentation in enological conditions. Journal of Bioscience and Bioengineering, 103, 229–235. doi:10.1263/jbb.103.229
- Colombié, S., Latrille, E., & Sablayrolles, J.-M. (2008). Interest of on-line monitoring electrical conductivity during wine fermentation. European Food Research and Technology, 226, 1553–1557. doi:10.1007/s00217-007-0649-1
- Dukkanci, M., & Gunduz, G. (2006). Ultrasonic degradation of oxalic acid in aqueous solutions. Ultrasonics Sonochemistry, 13, 517–522. doi:10.1016/j.ultsonch.2005.10.005
- Feng, R., Qian, Y., Xu, J., Wang, S., Li, H., & Shi, Q. (1991). Therapeutic ultrasound cavitation and ESR determination of free radicals. Acta Acustica, 16, 306–312.
- Gambuteanu, C., & Alexe, P. (2013). Principles and effects of acoustic cavitation. Annals of the University Dunarea de Jos of Galati Fascicle VI–Food Technology, 37, 9–17.
- García Martín, J. F., & Sun, D.-W. (2013). Ultrasound and electric fields as novel techniques for assisting the wine ageing process: The state-of-the-art research. Trends in Food Science & Technology, 33, 40–53. doi:10.1016/j.tifs.2013.06.005
- Gogate, P. R., & Pandit, A. B. (2004). Sonochemical reactors: Scale up aspects. Ultrasonics Sonochemistry, 11, 105–117. doi:10.1016/j.ultsonch.2004.01.005
- Jambrak, A. R., Mason, T. J., Paniwnyk, L., & Lelas, V. (2007). Ultrasonic effect on pH, electric conductivity, and tissue surface of button mushrooms, Brussels sprouts and cauliflower. Czech Journal of Food Sciences, 25, 90–100.
- Kanthale, P. M., Gogate, P. R., Pandit, A. B., & Marie-Wilhelm, A. (2003). Mapping of an ultrasonic horn: Link primary and secondary effects of ultrasound. Ultrasonics Sonochemistry, 10, 331–335. doi:10.1016/S1350-4177(03)00104-4
- Leighton, T. (1994). The acoustic bubble. London: Academic Press.
- Löning, J.-M., Horst, C., & Hoffmann, U. (2002). Investigations on the energy conversion in sonochemical processes. Ultrasonics Sonochemistry, 9, 169–179. doi:10.1016/S1350-4177(01)00113-4
- Makino, K., Mossoba, M. M., & Riesz, P. (1982). Chemical effects of ultrasound on aqueous solutions. Evidence for hydroxyl and hydrogen free radicals (OH and H)) by spin trapping. Journal of the American Chemical Society, 104, 3537–3539. doi:10.1021/ja00376a064
- Martín, O., Zhang, Q., Castro, A. J., Barbosa-Cánovas, G. V., & Swanson, B. G. (1994). Empleo de pulsos eléctricos de alto voltaje para la conservación de alimentos. Microbiología e ingeniería del proceso. Revista Española De Ciencia Y Tecnología De Alimentos, 34, 1–34.
- Qiu, T., Hu, S., Xie, X., & Zhang, X. (1998). Colloidal coagulation and precipitation promoted by ultrasound. Applied Acoustics, 17, 32–44. (In Chinese).
- Riesz, P., & Kondo, T. (1992). Free radical formation induced by ultrasound and its biological implications. Free Radical Biology and Medicine, 13, 247–270. doi:10.1016/0891-5849(92)90021-8
- Singh, R. P., & Heldman, D. R. (2001). Introduction to Food engineering (3rd ed.). London: Academic Press.
- Speight, J. G. (1999). Ullmann’s encyclopedia of industrial chemistry. Petroleum Science and Technology, 17, 445–445. doi:10.1080/10916469908949727
- Suslick, K. S., Hammerton, D. A., & Cline, R. E. (1986). Sonochemical hot spot. Journal of the American Chemical Society, 108, 5641–5642. doi:10.1021/ja00278a055
- Tao, Y., García Martín, J. F., & Sun, D.-W. (2014). Advances in wine aging technologies for enhancing wine quality and accelerating wine aging process. Critical Reviews in Food Science and Nutrition, 54, 817–835. doi:10.1080/10408398.2011.609949
- Thompson, L. H., & Doraiswamy, L. K. (1999). Sonochemistry: Science and engineering. Industrial & Engineering Chemistry Research, 38, 1215–1249. doi:10.1021/ie9804172
- Tiwari, B. K., Patras, A., Brunton, N., Cullen, P. J., & O’Donnell, C. P. (2010). Effect of ultrasound processing on anthocyanins and color of red grape juice. Ultrasonics Sonochemistry, 17, 598–604. doi:10.1016/j.ultsonch.2009.10.009
- Zhang, H. (2007). Electrical properties of foods. Encyclopedia of Life Support Systems (EOLSS). Developed under the Auspices of the UNESCO, 115–125.
- Zhang, Q.-A., Shen, H., Fan, X.-H., Shen, Y., Wang, X., & Song, Y. (2015a). Changes of gallic acid mediated by ultrasound in a model extraction solution. Ultrasonics Sonochemistry, 22, 149–154. doi:10.1016/j.ultsonch.2014.06.010
- Zhang, Q.-A., Shen, Y., Fan, X.-H., & García Martín, J. F. (2015b). Preliminary study of the effect of ultrasound on physicochemical properties of red wine. CyTA – Journal of Food, 1–10. doi:10.1080/19476337.2015.1045036
- Zhang, Q.-A., Shen, Y., Fan, X.-H., García Martín, J. F., Wang, X., & Song, Y. (2015c). Free radical generation induced by ultrasound in red wine and model wine: An EPR spin-trapping study. Ultrasonics Sonochemistry, 27, 96–101. doi:10.1016/j.ultsonch.2015.05.003
- Zheng, X., Zhang, M., Fang, Z., & Liu, Y. (2014). Effects of low frequency ultrasonic treatment on the maturation of steeped greengage wine. Food Chemistry, 162, 264–269. doi:10.1016/j.foodchem.2014.04.071
- Zoecklein, B. K., Fugelsang, B., Gump, B., & Nury, F. (1995). Wine analysis and production. New York, NY: Chapman & Hall.