
ABSTRACT
The fatty acid (FA) composition in human milk, bovine milk and infant formula from the northeast region of China was analyzed by gas chromatography (GC). The content of linoleic acid (LA, C18:2n6) in bovine milk (2.53 %) was lower than human milk (25.58 %) and formula milk (20.56 %). The trends of LA and α-linolenic acid (ALA, C18:3n3) in human milk increased significantly throughout the lactation while a decreasing trend for LA was observed and the difference of ALA was not significant in both bovine and formula milks. The proportion of docosahexaenoic acid (DHA, C22:6n3) and arachidonic acid (ARA, 20:4n6) in human milk and formula were declining with the change of lactation or infant age. We suggest there should be more detailed distinction with reference to human milk in the infant formula in order to meet infant’s personalized nutrition, especially the FA composition in the 1st month after delivery.
RESUMEN
Se analizó la composición de los ácidos grasos (FA) en la leche humana, la leche bovina y la fórmula infantil en la región noreste de China mediante cromatografía de gases (GC). El contenido de ácido linoleico (LA, C18:2n6) en la leche bovina (253 %) fue menor que en la leche humana (25,58 %) y la fórmula infantil (20,56 %). Las tendencias de LA y el ácido linoleico α (ALA, C18:3n3) en la leche humana aumentaron significativamente durante la lactación mientras que se observó una tendencia de disminución para LA y la diferencia de ALA no fue significativa en la leche bovina ni en la fórmula infantil. La proporción de ácido docosahexaenoico (DHA, C22:6n3) y ácido araquidónico (ARA, 20:4n6) en la leche humana y la fórmula infantil fue en declive con el cambio de la lactación o la edad del bebé. Sugerimos que debería haber una distinción más detallada en lo que concierne a la leche humana en la fórmula infantil para responder a la nutrición personalizada de los bebés, especialmente la composición de FA en el 1er mes de vida.
1. Introduction
Human milk, a complex biological fluid containing different constituents, is ideally satisfied to the infant’s nutritional requirements in the first half of year of human life (Fuquay, Fox, & McSweeney, Citation2011). The lipid content is about 38 g/L in human milk, which not only contributes more than 50 % of the energy for the growth of the newborn but also provides essential polyunsaturated fatty acid (PUFA) for infant, such as DHA and ARA which play an important role in visual and cognitive development (Gunstone, Harwood, & Dijkstra, Citation2007; Tai, Wang, & Chen, Citation2013). However, there are only about 38 % of infants worldwide who are completely breast-fed in their first six months after birth (World Health Organization [WHO], Citation2010). In this case, infant formulas become an important nutritional source for them (WHO, Citation1992).
The composition and content of FA in human milk are dynamic and variable within a feeding, diurnally, over lactation, between mothers, and other factors (Chung, Citation2014). Among these factors, the stage of lactation is the primary factor which affect the FA composition in human milk (Yang et al., Citation2014). With the change of lactation, saturated fatty acids (SFA) tend to increase slightly and total monounsaturated FAs decreased and the oleic acid (OLA) was much at the part of the decrease in the major MUFA, However, there are no statistical significance (Ribeiro et al., Citation2008). Meanwhile, main n-6 and n-3 PUFA showed fluctuations from the 1st week up to 16th week of lactation, for example, ARA significantly dropped from transitional to mature period. This trend was also confirmed by Yu, Duchen, and Björkstén (Citation1998). What’s more, Kovács, Funke, Marosvölgyi, Burus, and Decsi (Citation2005) and Minda et al. (Citation2004) analyzed the FA composition of human milk during the first 28 days and found that the FA composition even change from day to day. However, unlike the dynamic changes of the FA in human milk, all infant formulas are fortified to the same and they are ‘one-size-fits-all’ based on authoritative criterion and standard including commission directive 2006/141/EC (European Communities[EC], Citation2006), code of federal regulations 21CFR107 (Food and Drug Administration [FDA], Citation2014), codex stan 72–1981 (Codex Alimentarius Commission [CAC], Citation1981), codex stan 156–1987(CAC, Citation1987) and the national food safety standard such as GB 10765–2010 and GB 10767–2010 (Standardization Administration of the People’s Republic of China [SAC], Citation2010a, Citation2010b). Obviously, the fact cannot meet the personalized nutritional requirements of formula-fed infants.
Personalized nutrition is a conceptual simulation to personalized medicine and it emphasizes that the food products satisfy requirement or preference of specific consumer groups. At the same time, the personalized nutrition of specific consumer groups is affected with many factors such as taste and flavor preferences, cultural mores and life stages and so on (Dennis, et al. Citation2007; Kussmann & Fay, Citation2008). It is known that the nutritional status of different life stages have significant impact on the body’s health and development. Especially in the early stage of life, the growth and development of the body are primary biological purpose and vary rapidly for the infant. Therefore, the dietary requirements should be considered comprehensively. However, there are only a few studies, associated with the term infant who exclusively depend on the infant formula, in the field of personalized nutrition. Based on this situation, comparing the FA composition among the human, bovine and formula milks and validating whether the infant and follow-on formulas could meet the personalized nutritional requirements of infant in different life stages become necessary. Hence, we are particularly interested in analyzing the composition and content of FA in the milk of human, bovine and infant and follow-on formulas from the northeast region of China and looking forward to obtain a scientific basis to adjust the FA composition of infant and follow-on formula with reference to human milk.
2. Material and methods
2.1 Reagents
All reagents were of analytical or high performance liquid chromatography (HPLC) grade. Ammonia, ethanol, petroleum ether, ethyl ether, pyrogallic acid, potassium hydroxide, sodium chloride and methanol were purchased from Tianjin Kermel Chemical Reagent Co. Ltd. Boron trifluoride was purchased from Alfa Aesar (Tianjin) Chemical Co. Ltd. n-hexane was from Tianjin guangfu fine chemical research institute. The 37 component FAME mix was from Sigma-Aldrich (Bellefonte, USA).
2.2 Raw sample collection and store
The collection of human and bovine milk samples were reviewed and authorized by the scientific research ethics committee of Northeast Agricultural University (No. 20120624). All participants provided written informed consent.
Seventy-three human milk samples were donated by volunteer mothers (30 ± 4 years old, with 40 ± 3 weeks of pregnancy) from Harbin (Heilongjiang Province, China), Qiqihar (Heilongjiang Province, China) and Changchun (Jilin Province, China), and their race is the Han nationality. The lactation of human is divided into three periods: colostrum (1 ~ 5 d), transition (6 ~ 21 d) and maturity lactation (after 21 d) and all of the samples were collected from the 1st to the 122nd day after delivery. Each sample was collected after full expression from one breast using a milk pump while the baby was fed on the other breast between 8:00 AM and 11:00 AM on each collection day. Then packed it in a 50 mL polypropylene tube and refrigerated rapidly. Finally, samples were sent to the laboratory and stored at – 80ºC until analyses.
Forty-nine bovine milk samples were collected from the 1st day to the 120th day. Bovine milk is also divided into three periods which include colostrum (1 ~ 7 d), transition (8 ~ 35 d) and maturity lactation (after 36 d). The samples were collected by hand during 3:00 PM to 4:00 PM with the assistance of the professionals of pasture. Each collected sample was packed in a 50 mL polypropylene tube and refrigerated rapidly. Finally, all samples were sent to the laboratory and stored at – 80ºC until analyses.
The infant (0 ~ 6 months), older infant (6 ~ 12 months) and young children (12 ~ 36 months) formulas were purchased from local markets (Harbin, Heilongjiang Province, China). All of the formulas are conformed to meet the national food safety standard of Infant formula (GB 10765–2010), older infants and young children formula (GB 10767–2010) in China. The origin of the fat fraction is composite vegetable oil and anhydrous cream and the average content of total fat is 2.8 g/100 mL. Finally, twenty-four formulas were stored at ventilated, cool and dry conditions until analyses.
2.3 Analytical methods
The extraction, derivatization of lipid were carried out according to the GB 5413.27–2010 (SAC, Citation2010c) with minor modifications and our research was conducted in key laboratory of dairy science, northeast agricultural university. Briefly, sample (1.0 mL) was added to a 10 mL test tube and mixed with 0.2 mL ammonia. Test tube was heated at 65 ± 1ºC for 15 min, Taken out and slightly shaken. After cooling down to room temperature, ethanol (1.0 mL) was added and shaken. Then 2.0 mL ether and petroleum ether were added to the test tube respectively and the resulting mixture was shaken for 1 min. After standing and de mixing, the upper phase (approximately 4 mL) was moved to 10 mL test tube equipped with Teflon-lined screw caps. This process was repeated 3 times and 1 mL ether and petroleum ether respectively in the last time. Finally, all of the organic phases were pooled in screw glass tubes and dried via nitrogen blowing.
Pyrogallol-methanol (0.1 g/mL, 0.1 mL) was added to the crude lipid. After concentrated and dried, KOH-methanol (0.5 mol/L, 1.0 mL) was mixed in extract and put into water bath at 80 ± 1ºC for 5 ~ 10 min. Then BF3-methanol (14 %, 0.5 mL) was added and continued bathing 15 min and cooled down to room temperature. The solution in glass tube was transferred to 10 mL centrifuge tube and the glass tube was washed (1.0 mL each time) with saturated sodium chloride solution before all liquid was pooled in the same centrifuge tube. Put 2.0 mL n-hexane into the mixture, centrifuged (5000 rpm/min, 5 min) and the n-hexane phase was transferred into 1.5 mL sampling bottles by 1.0 mL sterile syringe through 0.22 filter membrane. Stored at −20 ºC and waiting for analysis.
2.4 Instrumentation and analytical conditions
The analysis for the methyl esters of the FA was carried out by Agilent 7890A with a 7683 auto injector coupled to a flame ionization detector (Agilent Technologies, Richardson, TX, USA). A SP-2560 capillary column was used for analysis (100 m × 0.25 mm ID 0.2 μm, Agilent Technologies), 1.0 µL aliquots were injected and the spilt ratio of 50:1 was used. Calefactive procedure of column as follows: the initial temperature was 140ºC for 5 min, increased to 180ºC at the speed of 5ºC/min and stayed for 10 min then rose to 210ºC at speed of 2ºC/min and kept 15 min, finally, up to 240ºC at speed of 10ºC/min and hold the temperature for 10 min. the temperature of injection port and detector were set at 240ºC and 260ºC respectively. The carrier gas was helium and the flux was 1.0 mL/min. The parameters were acceptable if the 37 components FAME Mix were separated ideally and the shape of all peaks were sharp and symmetrical. In addition, The peaks in samples were identified by comparison with the FAME standards and the result was expressed as mass percentage.
2.5 Statistical analysis
The results were provided by Agilent GC work station (normalization). The data were expressed as median (inter-quartile). Differences were considered significant at P-values < 0.05 at the 95 % confidence level by SPSS 13.0 software.
3. Results and discussion
3.1 FA compositions of the human milk in different lactation
FA compositions in the human milk, fluctuated with the change of lactation, is presented in . PAM, OLA and LA were the predominant FA during the colostrum, transition and mature lactation, accounted for 77.98 ~ 78.57 % of total FA. The contents of PAM, cis-11-eicosenoic acid (C20:1n9), erucic acid (C22:1n9), nervonic acid (C24:1n9), cis-11, 14-eicosadienoic acid (C20:2 n6) reduced with the change of lactation.
Table 1. Fatty acids of the human milk in colostrum, transition milk and mature lactation (% of total fatty
Tabla 1. Ácidos grasos de la leche humana en el calostro, la leche de transición y la lactación madura (% del total de ácidos grasos).
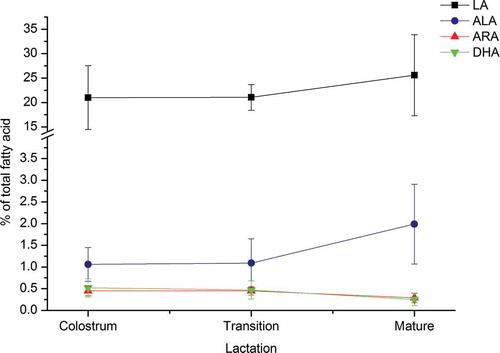
The content of LA and ALA increased from colostrum to mature (). This trend were similar with the result of Ribeiro et al. (Citation2008) and we reported higher content of them. The reason may be due to the Chinese people eat more soybean oil. Conversely, the contents of DHA and ARA decreased with the change of lactation, their contents were 0.52 % and 0.45 % in the colostrum period. From the transition to mature period, the contents of DHA and ARA decreased from 0.47 % and 0.45 % to 0.25 % and 0.29 % respectively (). This trend were consistent with related literatures reported by Yu et al. (Citation1998), Berenhauser, Prado, Silv, Gioielli, and Block (Citation2012), Ribeiro et al. (Citation2008), Kovacs et al (Citation2005) and Li et al. (Citation2009). The cause of the changes of LA, ALA, DHA and ARA in human milk could be expounded as follows: 1) a competitive inhibition exists between the metabolism of n-3 and n-6 fatty acid families since the process that LA and ALA are converted to ARA and DHA respectively by diverse desaturase- and elongase-enzymes share the same series of enzymes (Salem, Wegher, Mena, & Uauy, Citation1996; Schmitz, Ecker, Citation2008). 2) △6- and △5-desaturase activities in human liver of neonates was lower than previously reported in adult humans (Poisson et al., Citation1993). With the growth of the infant, the enzyme system is more perfect. The ability of converting LA and ALA to ARA and DHA will be strong. Therefore, the LA and ALA in breast milk will increase while the content of ARA and DHA will decrease.
Figure 1. The trend of LA, ARA, ALA and DHA in human milk. The contents of LA and ALA increased with the lactation while the ARA and DHA had the opposite trend. The black, blue, red and green represent the trend of LA, ALA, ARA and DHA respectively.
Figura 1. La tendencia de LA, ARA, ALA y DHA en la leche humana. Los contenidos de LA y ALA aumentaron con la lactación mientras que ARA y DHA tuvieron una tendencia opuesta. Los colores negro, azul, rojo y verde representan la tendencia de LA, ALA, ARA y DHA respectivamente.
3.2 FA compositions of the bovine milk in different lactation
In bovine milk, the content of the more than half SFA in the colostrum less than which were in transition and mature period except for butyric acid (C4:0), myristic acid(C14:0), PAM, heptadecanoic acid (C17:0) and STA and so on. No significant variations were observed in the content of MUFA in bovine milk, although the proportion of MUFA in the transition was higher than that in the colostrum and mature lactation, especially represented by OLA. This result is opposite to related investigations which were conducted by Auldist, Walsh, and Thomson (Citation1998) and Kgwatalala, Ibeagha-Awemu, Mustafa, and Zhao (Citation2009). As for PUFA, the trend of LA decreased with lactation while ARA had the opposite trend and its content peaked at 0.07 % in the mature lactation (). The STA level in the bovine milk was much higher the human milk in whole lactation. In addition, DHA and EPA were not detected in Holstein milk and the percentage of ARA was trivial in whole lactation. This situation can be improved by adding fish oil and sunflower oil to the bovine diet (Shingfield et al., Citation2006). All of this requiring us to pay more attention to the process which produce the infant formula with Holstein milk as the main raw material.
Table 2. Fatty acid of the Holstein bovine milk in colostrum, transition milk and mature lactation (% of total fatty acid).
Tabla 2. Ácidos grasos de la leche bovina Holstein en el calostro, la leche de transición y la lactación madura (% del total de ácidos grasos).
3.3 FA compositions of the infant and follow-on (older infant and young children) formula
In the formulas, PAM, OLA and LA were the major FA and total of them accounting for 74.04 %, 67.4 % and 61.82 % in infant, older infant and young children formulas respectively. The percentage of LA, DHA and ARA in total FA decreased when the applicable groups changed from infant to young children (). Except for young children formula, the LA levels in infant and older formulas were similar with the content in human milk. DHA and ARA were only detected in infant formula (DHA: 0.16 %, ARA: 0.12 %) and older infant formula (DHA: 0.02 %, ARA: 0.05 %) and their contents were significantly lower than the contents of human milk ().
Table 3. Fatty acid in the infant and follow-up (older infants and young children) formula (% of total fatty acid)
Tabla 3. Ácidos grasos en la fórmula infantil (bebés mayores y niños más pequeños) y de continuación (% del total de ácidos grasos).
3.4 Comparison of FA compositions among the human milk, bovine milk and formula milk
There were 26, 26 and 28 kinds of FA in the human milk, purebred Holstein milk and formula milk (). Compared with other studies, the numbers of FA in human milk were lower than the results obtained by Chen et al. (Citation1997) where 30 kinds FA were detected in Chinese human milk, however, the numbers of FA in Holstein milk was same with Czech Pied cattle Which contained 26 kinds FA (Pešek, Samková, & Špička, Citation2006). As for FA profile, we specifically detected C8:0 and C23:0 in human milk, but did not find C22:4n-6, C22:5n-6, C22:5n-3 and trans fatty acid including C14:1t, C16:1t. In bovine milk, our result presented more SFA such as C21:0, C23:0 while there are more PUFA including C16:2n-4, C16:3n-4, C18:3n-4, C18:4n-3 in Czech Pied cattle. Among three kinds of sample, SFA, MUFA and PUFA accounted for 33.12 %, 36.47 % and 30.72 % of the total FA in the mature human milk respectively; 69.88 %, 27.20 % and 2.92 % in the bovine milk; 46.38 %, 29.28 % and 24.34 % in the formula. Comparing with other literatures, we found that the content of PUFA of human milk in our study is higher than Wenzhou (21.54 %) and Changzhou (29.73 %) while the SFA are lower than the content in the two regions (Wenzhou, 42.90 %; Changzhou, 36.63 %) but MUFA (Wenzhou, 35.55 %; Changzhou, 33.64 %) are the exact opposite (Peng et al., Citation2009), although the differences are not significant. The proportions of SFA, MUFA and PUFA in bovine milk are close to the literature reported by Micinski et al. (Citation2012) who indicated that these proportions were 70.00 %, 24.90 % and 5.10 %. Compared with other literatures, the proportions of SFA in formula milk in our result were higher than majority of Danish infant formula (37.70 %~43.70 %) and the MUFA was lower than Danish (32.70 %~42.50 %) and Serbia (30.06 %) (Arsić et al., Citation2009; Straarup, Lauritzen, Faerk, Høy, & Michaelsen, Citation2006). Notably, the status of PUFA be opposite to MUFA, our result was 24.34% and it had an absolute advantage over the infant formula of the Serbia (15.00 %) and Danish (14.60 %~22.90 %). That is evidently beneficial to Chinese infants since the PUFA are crucial for their growth, such as DHA and ARA which are good for the retina and brain development (Valenzuela, Julio Sanhueza, & Nieto, Citation2006). In addition, the intake of DHA is determined by dietary n-3 PUFA (including ALA and dietary DHA) (Giribaldi et al., Citation2012; Guesnet, Alessandri, Citation2011). Thus, adequate PUFA in infant formula are vital for the development of infants. The FA in milk lipids derive from the diet or blood lipids synthesized de novo in the liver, in the case of ruminants, β-hydroxybutanoic acid is converted to butanoic acid or butanyl CoA and incorporated directly into triglycerides or instead of acetyl CoA in the biosynthesis of FA (Fuquay et al., Citation2011). That is the reason why we could find the existence of caprylic acid (8:0) and another short chain FA in bovine milk and infant formula but not in human milk (). The contents of capric acid (C10:0), myristic acid (C14:0), PAM, STA, myristoleic acid (C14:1) and heptadecenoic acid (C17:1) of bovine milk were highest among human milk, infant formula and bovine milk.
Table 4. Fatty acids in the human milk, bovine milk and formula milk (% of total fatty acid).
Tabla 4. Ácidos grasos en la leche humana, la leche bovina y la fórmula infantil (% del total de ácidos grasos).
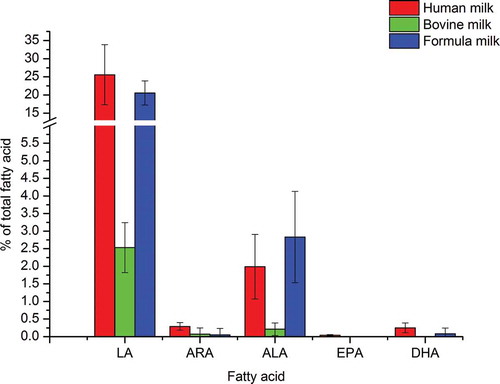
The content of LA in mature bovine milk was 2.92 % and lower than the contents in mature human milk (30.72 %) and formula milk (including infant and older infant formula) (24.34 %), the ALA level of bovine milk (0.21 %) was the lowest among them, the reason could be due to the dietary PUFA which are bio-hydrogenated in the rumen of cow (Fuquay et al., Citation2011). The levels of ARA and DHA in human milk (0.29 % and 0.25 % respectively) were higher than the levels in formula milk (0.05 % and 0.08 % respectively). The EPA and DHA are so small amount that cannot be detected in the bovine milk, the EPA did not be detected likewise in formula milk ().
Figure 2. The comparison of essential fatty acid content among human, bovine and formula milk. The red, green and blue represent corresponding values in the human milk, bovine milk and formula respectively. The sequence from left to right are LA, ARA, ALA, EPA and DHA.
Figura 2. Comparación de los contenidos de ácidos grasos esenciales en la leche humana, bovina y la fórmula infantil. Los colores rojo, verde y azul representan los valores correspondientes de la leche humana, bovina y la fórmula infantil respectivamente. La secuencia de izquierda a derecha es LA, ARA, ALA, EPA y DHA.
The FA compositions were significant difference among human milk, bovine milk and formulas. The infant is in the first peak of growth and the development. Without doubt, human milk can be the best choice in this period. However, the lower rate of breast feeding is an indisputable fact (WHO, Citation2010). At the same time, formula are ‘one-size-fits-all’ under many regulations (Australia New Zealand Food Standard Code [ANZFSC], Citation2013; Codex Alimentarium Commission: Codex standard for follow-up formula, Citation1987; CAC, Citation1981; FDA, Citation2014). Thus, it is urgent to make the formula meet the infant’s personalized nutritional requirement.
4. Conclusions
According to the results, we found that the FA compositions are different significantly with the change of lactation or infant age in the human and formula milks. The FA composition of formula should be guided by human milk, especially for LA, ALA, ARA, DHA. Infant develops quickly in the early life stage and they need a great deal of FA to ensure the energy supply and promote the developments of brain and retina. Thus, the personalized nutrition of infant formula becomes very important for formula-fed infant’s survival. We recommend that there should be a more detailed distinction in the infant formula that just like human milk, especially the FA composition in the 1st month after delivery. There is a little information about the trend of FA composition in human milk from the 2nd to the 4th month. Further studies are needed to definitively establish the personalized nutrition of infant formula in fatty acid composition.
Disclosure statement
No potential conflict of interest was reported by the authors.
Additional information
Funding
References
- Arsić, A., Prekajski, N., Vučić, V., Tepšić, J., Popović, T., Vrvić, M., & Glibetić, M. (2009). Milk in human nutrition: Comparison of fatty acid profiles. Acta Veterinaria, 59, 569–578. doi:10.2298/AVB0906569A
- Auldist, M.J., Walsh, B.J., & Thomson, N.A. (1998). Seasonal and lactational influences on bovine milk composition in New Zealand. Journal of Dairy Research, 65, 401–411. doi:10.1017/S0022029998002970
- Australia New Zealand Food Standards Code, Standard 2.9.1 Infant Formula Products. (2013). Federal Register of Legislation of Instruments F2013C00621 Retrieved from https://www.comlaw.gov.au/Details/F2011C00547/Download
- Berenhauser, A.C., Prado, A.C.P.D., Silv, R.C.D., Gioielli, L.A., & Block, J.M. (2012). Fatty acid composition in preterm and term breast milk. International Journal of Food Sciences & Nutrition, 63, 318–325. doi:10.3109/09637486.2011.627843
- Bier, D.M., Bruce German, J., & Lönnerdal, B. (2007). Personalized nutrition for the diverse needs of infants and children. Helsinki: Nestlé Nutrition Workshop.
- Chen, Z.Y., Kwan, K.Y., Tong, K.K., Ratnayake, W.M., Li, H.Q., & Leung, S.S. (1997). Breast milk fatty acid composition: A comparative study between Hong Kong and Chong Qing Chinese. Lipids, 32, 1061–1067. doi:10.1007/s11745-997-0137-6
- Chung, M.-Y. (2014). Factors affecting human milk composition. Pediatrics & Neonatology, 55, 421–422. doi:10.1016/j.pedneo.2014.06.003
- Codex Alimentarium Commission: Codex standard for follow-up formula. (1987). Codex Stan 156-1987. Retrieved from http://news.40777.cn/stardard-10779/
- Codex Alimentarius Commission: Standard for infant formula and formulas for special medical purposes intended for infants. (1981). Codex Stan 72-1981. Retrieved from http://down.foodmate.net/standard/sort/11/3131.html
- Food and Drug Administration. (2014). Code of Federal Regulations, 21CFR107. Part 107 – Infant Formula. Retrieved from http://www.accessdata.fda.gov/scripts/cdrh/cfdocs/cfcfr/cfrsearch.cfm?fr=107.1
- Fuquay, J.W., Fox, P.F., & McSweeney, P.L.H. (2011). Encyclopedia of dairy sciences. London: Academic Press.
- Giribaldi, M., Cavallarin, L., Baro, C., Nicola, P.D., Coscia, A., & Bertino, E. (2012). Biological and nutritional aspects of human milk in feeding of preterm infants. Food & Nutrition Sciences, 3, 1682–1687. doi:10.4236/fns.2012.312220
- Guesnet, P., & Alessandri, J.-M. (2011). Docosahexaenoic acid (dha) and the developing central nervous system (cns) – implications for dietary recommendations. Biochimie, 93, 7–12. doi:10.1016/j.biochi.2010.05.005
- Gunstone, F.D., Harwood, J.L., & Dijkstra, A.J. (2007). The lipid handbook with CD-ROM (3rd ed). New York, NY: CRC Press.
- Kgwatalala, P.M., Ibeagha-Awemu, E.M., Mustafa, A.F., & Zhao, X. (2009). Influence of stearoyl-coenzyme a desaturase 1 genotype and stage of lactation on fatty acid composition of canadian jersey cows. Journal of Dairy Science, 92, 1220–1228. doi:10.3168/jds.2008-1471
- Kovács, A., Funke, S., Marosvölgyi, T., Burus, I., & Decsi, T. (2005). Fatty acid in early human milk after preterm and full-term delivery. Journal of Pediatric Gastroenterology and Nutrition, 41, 454–459. doi:10.1097/01.mpg.0000176181.66390.54
- Kussmann, M., & Fay, L.B. (2008). Nutrigenomics and personalized nutrition: Science and concept. Personalized Medicine, 5, 447–455. doi:10.2217/17410541.5.5.447
- Li, J., Fan, Y., Zhang, Z., Yu, H., An, Y., Kramer, J.K.G., & Deng, Z. (2009). Evaluating the trans fatty acid, CLA, PUFA and erucic acid diversity in human milk from five regions in china. Lipids, 44, 257–271. doi:10.1007/s11745-009-3282-x
- Miciński, J., Zwierzchowski, G., Kowalski, I.M., Szarek, J., Pierożyński, B., & Raistenskis, J. (2012). The effects of bovine milk fat on human health. Polish Annals of Medicine, 19, 170–175. doi:10.1016/j.poamed.2012.07.004
- Minda, H., Kovács, A., Funke, S., Szász, M., Burus, I., & Molnár, S. (2004). Changes of fatty acid composition of human milk during the first month of lactation: A day-to-day approach in the first week. Annals of Nutrition & Metabolism, 48, 202–209. doi:10.1159/000079821
- Peng, Y., Zhou, T., Wang, Q., Liu, P., Zhang, T., Zetterström, R., & Strandvik, B. (2009). Fatty acid composition of diet, cord blood and breast milk in Chinese mothers with different dietary habits. Prostaglandins Leukotrienes & Essential Fatty Acids, 81, 325–330. doi:10.1016/j.plefa.2009.07.004
- Pešek, M., Samková, E., & Špička, J. (2006). Fatty acids and composition of their important groups in milk fat of czech pied cattle. Czech Journal of Animal Science, 51, 181–188.
- Poisson, J.P., Dupuy, R.P., Sarda, P., Descomps, B., Narce, M., Rieu, D., & Paulet, A.C. (1993). Evidence that liver microsomes of human neonates desaturate essential fatty acids. Biochimica et Biophysica Acta, 1167, 109–113. doi:10.1016/0005-2760(93)90149-4
- Ribeiro, M., Balcao, V., Guimaraes, H., Rocha, G., Moutinho, C., & Matos, C. (2008). Fatty acid profile of human milk of portuguese lactating women: prospective study from the 1st to the 16th week of lactation. Annals of Nutrition & Metabolism, 53, 50–56. doi:10.1159/000156597
- Salem, N., Wegher, B., Mena, P., & Uauy, R. (1996). Arachidonic and docosahexaenoic acids are biosynthesized from their 18-carbon precursors in human infants. Proceedings of the National Academy of Sciences, 93, 49–54. doi:10.1073/pnas.93.1.49
- Schmitz, G., & Ecker, J. (2008). The opposing effects of n-3 and n-6 fatty acids. Progress in Lipid Research, 47, 147–155. doi:10.1016/j.plipres.2007.12.004
- Shingfield, K.J., Reynolds, C.K., Hervás, G., Griinari, J.M., Grandison, A.S., & Beever, D.E. (2006). Examination of the persistency of milk fatty acid composition responses to fish oil and sunflower oil in the diet of dairy cows. Journal of Dairy Science, 89, 714–732. doi:10.3168/jds.S0022-0302(06)72134-8
- Standardization Administration of the People’s Republic of China. (2010a). Infant formula (National Health and Family Planning Commission of PRC Publication No. GB 10765-2010) Retrieved from http://www.moh.gov.cn/zwgkzt/psp/201005/47402/files/bc25275055b04aac83f5b7911ad249c4.pdf
- Standardization Administration of the People’s Republic of China. (2010b). Older infants and young children formula (National Health and Family Planning Commission of PRC Publication No. GB 10767-2010) Retrieved from http://www.moh.gov.cn/zwgkzt/psp/201005/47403/files/97fd3a2acf39453aa58b0390e69643f5.pdf
- Standardization Administration of the People’s Republic of China. (2010c). Determination of fatty acids in foods for infants and young children, milk and milk products (National Health and Family Planning Commission of PRC Publication No. GB 5413.27-2010) Retrieved from http://www.moh.gov.cn/zwgkzt/psp/201005/47423/files/55ce2f2a0342401b96499565c6588557.pdf
- Straarup, E.M., Lauritzen, L., Faerk, J., Høy, C.E., & Michaelsen, K.F. (2006). The stereospecific triacylglycerol structures and fatty acid profiles of human milk and infant formulas. Journal of Pediatric Gastroenterology & Nutrition, 42(3), 293–299. doi:10.1097/01.mpg.0000214155.51036.4f
- Tai, E.K., Wang, X.B., & Chen, Z.Y. (2013). An update on adding docosahexaenoic acid (DHA) and arachidonic acid (AA) to baby formula. Food & Function, 4, 1767–1775. doi:10.1039/c3fo60298b
- The commission of the European communities: commission directive 2006/141/EC of 22 December 2006 on infant formulae and follow-on formulae and amending Directive 1999/21/EC. (2006). Infant Formula and Follow-on Formula. Official Journal of the European Union. Retrieved from http://eur-lex.europa.eu/legal-content/EN/TXT/?qid=1466217774984&uri=CELEX:32006L0141
- Valenzuela, A., Julio Sanhueza, B., & Nieto, S. (2006). Docosahexaenoic acid (DHA), essentiality and requirements: Why and how to provide supplementation. Grasas Y Aceites, 57, 229–237. doi:10.3989/gya.2006.v57.i2
- World Health Organization. (1992). Guidelines concerning the main health and socioeconomic circumstances in which infants have to be fed on breast-milk substitutes. In: Thirty-Ninth World Health Assembly [A39/8Add.1-10April 1986] (pp. 122–135). Retrieved from http://apps.who.int/iris/bitstream/10665/162002/1/WHA39_8_eng.pdf?ua=1
- World Health Organization. (2010). Infant and young child feeding. Updated February 2014. Retrieved from http://www.who.int/mediacentre/factsheets/fs342/en/index.html.
- Yang, T., Zhang, Y., Ning, Y., You, L., Ma, D., & Zheng, Y. (2014). Breast milk macronutrient composition and the associated factors in urban Chinese mothers. Chinese Medical Journal, 127, 1721–1725. doi:10.3760/cma.j.issn.0366-6999.20133260
- Yu, G., Duchen, K., & Björkstén, B. (1998). Fatty acid composition in colostrum and mature milk from non-atopic and atopic mothers during the first 6 months of lactation. Acta Pædiatrica, 87, 729–736. doi:10.1111/j.1651-2227.1998.tb01738.x