
ABSTRACT
A comparison was made of the effect of different gas headspace to meat ratio on quality of pork loin (m. longissimus thoracis et lumborum) obtained from crossbred pigs (Polish Landrance x Duroc, n = 6) as a function of cold storage. Samples were stored in modified atmosphere packs (80% O₂:20% CO₂) with gas headspace to meat ratios (G/M) of 3:1, 1:1 and 1:3. Physicochemical and microbiological parameters were monitored for up to 12 days. The results indicated that the best properties of meat were obtained when stored pork loins with the gas headspace to meat ratio of 1:1. G/M = 1:3 contributed to the increase in the growth of microorganisms and G/M = 3:1 and led to unfavorable changes in meat color. Finally, chemical properties of pork loins were unaffected (P > 0.05) by varying the gas headspace to meat ratio.
RESUMEN
Se realizó una comparación del efecto de diferentes ratios gas de espacio de cabeza a carne sobre la calidad del lomo de cerdo (músculo longísimo y lumbar) obtenido de razas mezcladas de cerdo (Landrance polaco x Duroc, n=6) para almacenamiento en frío. Las muestras se almacenaron en paquetes con atmosfera modificada (80% O₂:20% CO₂) con el ratio gas de espacio de cabeza a carne (G/M) de 3:1, 1:1 y 1:3. Se realizó un seguimiento de los parámetros fisicoquímicos y microbiológicos durante 12 días. Los resultados indicaron que las mejores propiedades de la carne se obtuvieron cuando se almacenó el lomo de cerdo con el ratio gas de espacio de cabeza a carne de 1:1. G/M = 1:3 contribuyó a aumentar el crecimiento de microorganismos y G/M = 3:1 conllevó a cambios desfavorables en el color de la carne. Finalmente, las propiedades químicas del lomo de cerdo no se vieron afectadas (P>0,05) por el ratio gas de espacio de cabeza a carne.
1. Introduction
Lately, a lot of work has been done on the effect of varying the gas composition in modified atmosphere packaging (MAP) on the shelf-life of pork (Lukic et al., Citation2015; Lund, Lametsch, Hviid, Jensen, & Skibsted, Citation2007). However, limited research has been carried out on the effects of varying the gas headspace to meat ratio in MAP, which may also play an important role in its quality. Typically, modified atmosphere used for meat packaging consists of oxygen (O2) and carbon dioxide (CO2) as O2 favors the bright red color of fresh meat (Mancini & Hunt, Citation2005) and CO2 (in an amount of 20% or more) suppresses microbial growth (Lopez-Rubio et al., Citation2004).
The stability of meat color may deteriorate with decreasing proportion of the product to the surrounding gases. The reason for this is the increase of gas volume, which in high O2 MAP is equivalent to the increase in the amount of O2 involved in the oxidation reaction (John et al., Citation2004). However, according to some references, minor differences in cholesterol oxidation products and volatile compounds, as well as no effect on phospholipid classes of fresh loin were found due to packaging method (vacuum, air and MAP with CO2) during 8 days of storage (García-Márquez, Narváez-Rivas, Gallardo, Cabeza, & León-Camacho, Citation2013a, Citation2013b, Citation2014).
On the other hand, excessive amount of the product in the package can lead to a reduction in the period of its shelf-life due to the insufficient amount of CO2, which guarantees microbiological stability of stored raw material. On the basis of the literature, it can be concluded that the optimal level of CO2 in meat is 1.2 L to 2 L/kg (Gill & Gill Citation2005; Jeremiah, Penney, & Gill, Citation1992). Also metabolism of microorganisms in meat may cause minor changes in the composition of the gas by their use of O2 and production of CO2 (Jakobsen & Bertelsen, Citation2002).
Due to the interactions between preservative gases and the product, confirmed experimentally, appropriate ratio is required if the protective atmosphere is to be maintained. It is suggested that the volume of gases should not be more than three times greater than the product volume inside the packaging to both slow down the adverse reactions connected with the presence of O2 inside (Gill & Gill, Citation2005) and to also avoid packaging deformation (Blakistone, Citation1999).
Therefore, the aim of the study presented in this article was to evaluate the influence of gas headspace to meat ratio (G:M of 3:1, 1:1 and 1:3, respectively) on physicochemical properties and microbiology of pork loins stored in commercially used MAP.
2. Materials and methods
Animals and sampling
The experimental procedures were approved by the Local Ethical Commission (ISO 21527-2:2008, Citation2008). The pigs were reared under conventional indoor system, which guaranteed an appropriate level of animal welfare with an unlimited access to water. All the animals were fed a standard diet based on rapeseed, soya, wheat and barley meal (crude protein 160 g/kg and metabolizable energy 13 MJ) until they reached the slaughter weight of 100 ± 2 kg (around 160 ± 3 days).
The experiment was carried out on 30 crossbred gilts of Polish Landrace × Duroc. After slaughter in commercial slaughterhouse and 24 h chilling, pork loins (m. longissimus thoracis et lumborum) were separated from six randomly selected carcasses (6 loins from the left and 6 loins from the right half-carcasses) and transported in cold conditions at temperatures of around 2°C at the Warsaw University of Life Sciences (Warsaw, Poland).
At the 48th hour postmortem, the obtained meat was divided. The whole left loins were designated for physicochemical analysis and the right ones for microbiological analysis. Each of six left loins was divided into 20 pork steaks (two steaks in tray): 10 slices from left loin (thickness of 1.5 cm) were used to evaluate pH, chromatic parameters, drip loss, basic composition and fatty acid (FA) profile and next 10 slices (thickness of 2.5 cm) were used for cooking loss and the Warner Blatzer Shear Force (WBSF) evaluation on cooked meat. Hereby, on each light condition and at each time of storage, the analyses were made from the same loin. Also each of six right loins was divided into 20 pork steaks with two different thicknesses to create similar conditions for storage (two steaks in tray). Hereby, on each gas headspace to meat ratio (G:M) and at each time of storage, the analyses were made from the same loin. Laboratory analyses were performed at the 8th, 10th and 12th day of storage. The samples identified as ‘0 d’ were controls and they were analyzed on the same day of packaging within 2 h from collection time. All measurements were conducted in sextuplicate for each gas headspace to meat ratio and at each time of storage.
Packaging and storage conditions
Pork loins were divided into parts in such a way that gas headspace to meat ratio (G:M) equaled 1:3, 1:1 and 3:1, respectively, and packaged in polypropylene/ethylene vinyl alcohol/polypropylene (PP/EVOH/PP) trays characterized by low permeability to gases using semi-automatic packaging machine (SEALPAC M3, Sealpac GmbH, Oldenburg, Germany). The samples were stored in a high concentration of O2 (80% O2, 20% CO2) at a temperature of 2°C ± 1°C for 12 days.
Gas analysis in MAP
The gas atmosphere (% O2 and % CO2) in the packages was checked on the 1st, 8th, 10th and 12th day using a gas analyzer (PAS/P, WITT-GASETECHNIK GmbH & Co KG, Witten, Germany) where the instrument needle was inserted through a rubber septum attached to the lidding material. The results were expressed as % O2 and % CO2.
Physical analysis
The pH value of pork loins was measured according to the device instructions, using a Testo 205 pH meter (Testo Inc., Germany) equipped with a glass electrode. The electrode was calibrated against buffers of pH 4.0 and 7.0 and then placed directly into the samples (2 cm deep). Each measurement was performed in three replications, taking the mean value as the assay result. The temperature of the samples during the measurements was 2 ± 1°C.
The instrumental measurement of the color parameters of pork loins (L*, a*, b* and C*) was specified using a Minolta chromameter (CR-400, Konica Minolta Inc., Tokyo, Japan), with a spot diameter of 8 mm, a D65 illuminant (color temperature – 6500 K) and an observer angle of 2°. The chromameter was calibrated on the CIE LAB color space system using a white plate (L* = 98.45, a* = −0.10, b* = −0.13). Measurements of the samples were taken immediately after opening the package from five locations including the center and every quarter of the meat. Additionally on each day of storage total color difference (ΔE) in relation to day 0 was determined according to the following formula:
Drip loss was calculated as the difference in the meat weight before and after storage, according to the following formula:
in which DL is an indicator of drip loss in %, m1 is the weight of raw material before storage expressed in grams and m2 is the weight of raw material after storage expressed in grams.
To assess the cooking loss, pork loin chops were cooked in a water bath (80°C) until an internal temperature of 72°C was reached. Afterwards, the samples were cooled at room temperature and chilled for another 12 h to achieve an internal temperature of 4°C (Marcinkowska et al., Citation2016). Cooking loss was calculated as the percentage of the weight of cooked samples compared to the weight of raw samples, according to the following formula:
in which CL is an indicator of cooking loss in %, m2 is the weight of raw material after storage expressed in grams and m3 is the weight of cooked samples expressed in grams.
Shear force measurements were performed according to the method described by Marcinkowska et al. (Citation2016) using an Instron universal testing machine (Model 5965, Instron Co., Canton, MA, USA). Six cylindrical samples from each pork loin slice, with the diameter of 1.27 cm and height of 2.5 ± 0.3 cm, were sheared using a ‘V’-shaped steel knife perpendicular to the muscle fibers orientation. The capacity of the measuring head of the machine amounted to 500 N and crosshead speed was 200 mm/min. The hardness of pork loins (N) was defined as the maximum force on the shear curve.
Chemical analysis
For FA profile determination, the lipids were extracted from homogenized samples (5 g) with chloroform-methanol 2:1 (v/v) according to the method described by Folch and Lees (Citation1957). Fatty acid methyl esters (FAME) were analyzed following the procedure described by Poławska et al. (Citation2012) using a GC-7890 Agilent gas chromatograph equipped with a 60 m capillary column (Hewlett-Packard-88, Agilent J&W GC Columns, USA) with a 0.25 mm inner diameter and coating thickness of 0.20 μm. A 1 μl sample was injected at a split ratio of 1:40. Helium was used as a carrier gas at a flow rate of 50 mL/min. The temperature program with a total runtime of 47 min was from 140°C (held for 5 min) at a rate of 4°C/min to 190°C and then to 215°C at a rate 0.8°C/min. IndividualFA peaks were identified by comparison with known reference methyl esters (Supelco 37 Component FAME Mix, 47885-U, Sigma-Aldrich Co.). All FA values were expressed as a weight percentage of total FAs. The FA measurement of pork loins was carried out on the first and last day of storage.
Microbiological analysis
Microbiological analysis of stored pork loins were performed in the Accredited Laboratory (accreditation no. PCA no AB 1095) on every measurement day in accordance with the relevant harmonized standards: with the relevant harmonized standards: ISO 6579:2002/Amp.1:2007 (ISO, Citation2007) (the presence of Salmonella spp.), ISO 16649-2: 2001 (ISO, Citation2001b) (the presence of E. coli), ISO 21528-2:2004 (ISO, Citation2004) (the presence of Enterobacteriaceae), ISO 4833-1:2013 (ISO, Citation2013) (total aerobic plates count (TAPC)), ISO 17410:2001 (ISO, Citation2001a) (total psychrotrophic bacteria count), ISO 15214:1998 (ISO, Citation1998) (the number of lactic acid bacteria), ISO 13720:2010 (ISO, Citation2010) (the number of Pseudomonas spp.) and ISO 21527-2:2008 (ISO, Citation2008) (the general amount of yeast and mold). All microbiological tests were carried out in triplicate and the results were transformed into a logarithm of the number of colony-forming units (CFU/g).
Statistical methods
All data were analyzed using the Statistica 10.0 software. The data were analyzed using an individual loin from carcass as the experimental unit. The results were analyzed using two-way analysis of variance with the storage time (ST) and light intensity (LI) as the factors for O2 and CO2 concentration, pH, color parameters, drip loss, cooking loss, shear force, basic chemical composition,FA profile, Salmonella spp., E. coli, Enterobacteriaceae, TAPC, Pseudomonas spp., psychrotrophic bacteria, lactic acid bacteria and yeasts and molds. The differences between groups were tested according to the Tukey’s test, performed at the significant level of P < 0.05. The results in figures are presented as mean values and standard deviations (SD). The results in tables are presented as mean values with their pooled standard errors of measurement (SEM).
3. Results and discussion
Gas analysis in MAP
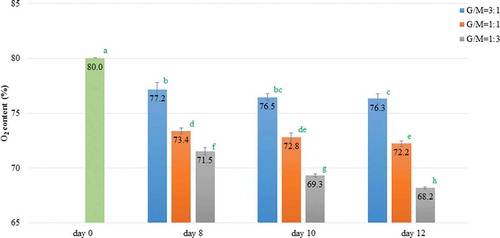
Analysis of changes in gas concentrations in the modified atmosphere surrounding the stored meat is crucial due to their association with meat discoloration and microbiological growth. In the experiment on the 8th, 10th and 12th day of storage, the O2 concentration decreased reaching the lowest values on the last day for packaging containing the highest portions of meat ().
Figure 1. The O2 content (mean ± SD) in MAP containing pork loins stored in packages with different gas headspace to meat ratio (G/M); *a–h, the mean values marked with various letters show significant statistical differences. P < 0.05. G/M = 3:1 gas headspace to meat ratio of 3:1, G/M = 1:1 gas headspace to meat ratio of 1:1, G/M = 1:3 gas headspace to meat ratio of 1:3.
Figura 1. Contenido de O2 (Promedio±SD) en MAP que contiene lomo de cerdo almacenado en paquetes con diferentes ratio gas de espacio de cabeza a carne (G/M); *a – h – los valores promedio marcados con distintas letras muestran diferencias estadísticas significativas. P < 0,05. G/M = 3:1 ratio gas de espacio de cabeza a carne de 3:1, G/M = 1:1 ratio gas de espacio de cabeza a carne de 1:1, G/M = 1:3 ratio gas de espacio de cabeza a carne de 1:3.
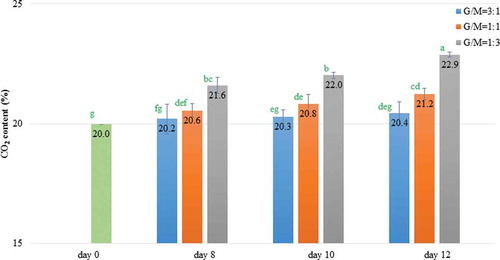
Additionally, pork loins packaged at a gas headspace to meat ratio of 1:3 were characterized by the highest concentration of CO2 (). These kinds of changes in gas composition may be attributed to microorganism growth and can contribute to accelerated product spoilage. In the other two cases, the CO2 level remained stable starting from day 8. This is consistent with Bingol and Ergun (Citation2011) and Kennedy, Buckley, and Kerry (Citation2004) who reported greater stability of gases in packages containing smaller portions of meat.
Figure 2. The CO2 content (mean ± SD)in MAP containing pork loins stored in packages with different gas headspace to meat ratio (G/M); *a–g, the mean values marked with various letters show significant statistical differences. P < 0.05. G/M = 3:1 gas headspace to meat ratio of 3:1, G/M = 1:1 gas headspace to meat ratio of 1:1, G/M = 1:3 gas headspace to meat ratio of 1:3.
Figura 2. Contenido de O2 (Promedio ±SD) en MAP que contiene lomo de cerdo almacenado en paquetes con diferentes cromatografías de gases de la proporción de carne (G/M); *a – g – los valores promedio marcados con distintas letras muestran diferencias estadísticas significativas. P < 0.05. G/M = 3:1 ratio gas de espacio de cabeza a carne de 3:1, G/M = 1:1 ratio gas de espacio de cabeza a carne de 1:1, G/M = 1:3 ratio gas de espacio de cabeza a carne de 1:3.
Physical analysis
The application of various gas headspace to meat ratio and the prolongation of ST of the meat may have significant effects upon its physical properties ().
Table 1. Selected physical parameters of pork loins (average) with different gas headspace to meat ratio.
Tabla 1. Parámetros físicos seleccionados de lomo de cerdo (promedio) con diferentes ratios de gas de espacio de cabeza a carne.
Despite this, the results achieved in the study demonstrated no effect of both the ST and gas headspace to meat ratio on its pH value (P > 0.05). Seydim, Acton, Hall, and Dawson (Citation2006) observed a similar effect on the pH value of ostrich meat stored for 12 days. Jakobsen and Bertelsen (Citation2004) and Juncher et al. (Citation2001) pointed out in their studies that an increased concentration of CO2 can lead to a drop in the pH value of a stored product. This effect may be related to the absorption of CO2 by meat and the production of carbonic acid. Although the CO2 content increased slightly on day 12 in the meat packaged with a gas headspace to meat ratio of 1:1 and 1:3, there was no simultaneous reduction in the pH of the meat.
In all samples, drip loss values increased during the storage (), which was also confirmed in other research for both vacuum and MAP (Marcinkowska-Lesiak et al., Citation2016). The highest drip loss value was observed on the 12th day of storage regardless of the applied gas headspace to meat ratio. The interaction of ST and gas headspace to meat ratio affected drip loss values significantly (P < 0.001).
A high cooking loss gives an expectation of a less optimal eating quality of meat (Aaslyn, Bejerholma, Ertbjergb, Bertramc and Andersen, Citation2003). In respect to these parameters, the statistical analysis () showed that both ST and the gas headspace to meat ratio were the factors which caused an effect on cooking loss (P < 0.001). In general, it was observed that all samples had weight loss of approximately 21%–23%, which was probably due to the relatively constant acidity of the meat during storage and probably did not change its eating quality.
The stability of meat color may deteriorate with decreasing the proportion of the product to the gas headspace. The reason for it is the increase in gas volume, which is equivalent to the increase in the amount of O2 participating in the oxidation reaction. On the other hand, an excessive amount of meat in the trays can reduce its shelf-life due to the insufficient amount of CO2 which guarantees microbiological stability of the stored product. Color parameters (L*, a*, b*, chroma and ΔE) in the experiment were influenced by ST, the gas head space to meat ratio and their interaction (). Lightness (L*) values increased in all samples as a function of ST, whereby the less meat there was in the package, the more intense was the increase of L* parameter. Beginning on the 8th day, the pork loin packaged in a gas headspace to meat ratio of 3:1 was characterized by significantly higher values of the L* parameter than the meat packaged in a 1:1 and 1:3 gas headspace to meat ratio. However, O’Grady (Citation2007) reported that the gas headspace to meat ratio did not affect the lightness of beef stored for 14 days in a gas headspace to meat ratio 0.5:1, 1:1 and 2:1, respectively. Additionally, a* values of the samples decreased significantly from 8.81 at the beginning of the storage to between 5.68 and 6.52 at the end of the storage () due to oxidation of myoglobin in packaged meat. Also, the interaction of ST and the gas headspace to meat ratio influenced a* values significantly (P < 0.001) and beginning on the 8th day the redness of the meat did not differ in terms of packaging treatments. Similar results were reported by Kennedy et al. (Citation2004) and O’Grady (Citation2007) who determined that a change in the gas headspace to meat ratio in the packaging has not contributed to a decline in the stability of a* parameter. Kim, Huff-Lonergan, Sebrsnek and Lonergan (Citation2010) reported that higher concentrations of O2 affect the oxidation of lipids, which reduced the stability of b* value of meat. In our study, yellowness remained relatively constant throughout the storage of pork loins packaged in all gas headspace to meat ratios (). Even though the samples differed in terms of O2 concentrations on the last day of storage, existing interactions contributed to the maintenance of b* parameter at similar levels according to the results reported by O’Grady (Citation2007). Also C* values remained stable on the 12th day of storage for all types of packaging. The factor of color differences (ΔE) increased with time. Beginning on the 8th day, pork loins packaged in a gas headspace to meat ratio of 3:1 were characterized by significantly higher values of ΔE than other samples, which gave the impression of being different colors. For samples packaged in a gas headspace to meat ratio of 1:1 and 1:3, total changes of color were clearly recognized starting from the 10th day (∆E ≥ 3.5).
Also, WBSF values were influenced by ST, the gas headspace to meat ratio and their interaction (). Additionally, shear force increased only for pork loin stored at a gas headspace to meat ratio of 3:1. WBSF values of the other samples remained relatively constant throughout the 12 days of storage. Higher O2 content in samples stored at a maximum gas headspace to meat ratio could probably lead to an increase in WBSF values of pork loins. These results are in agreement with the results of other authors (Clausen, Jakobsen, Ertbjerg, & Madsen, Citation2009; Kim et al., Citation2010) who demonstrated that the decrease in tenderness of meat was associated with high O2 concentrations in MAP. However, O’Grady (Citation2007) did not find differences in shear force between samples stored at varied gas headspace to meat ratios.
Chemical analysis
Changes in FA profile may be responsible for quality and storage stability of pork meat because off-odors and discoloration from lipid oxidation drastically reduce its consumer acceptability (Leick et al., Citation2010; Teye et al., Citation2006). Due to the fact that lipid oxidation is dependent on the level of unsaturation, a greater proportion of monounsaturated acids and polyunsaturated acids can increase deterioration of stored meat. In the present study, the proportion of saturated fatty acids (SFA), as well as the proportion of monounsaturated acids, the proportion of polyunsaturated acids (PUFA), PUFA/SFA ratio, content of n-6 FAs, content of n-3 FAs and the n-6/n-3 ratio were not affected by ST or the gas headspace to meat ratio and their interaction (P > 0.05, ). Therefore, it seems that gas headspace to meat ratio does not influence the oxidation rate of pork during 12 days of storage.
Table 2. Profile of fatty acids (% FAMEtotal) pork loins in packages with different gas headspace to meat ratio.
Tabla 2. Perfil de ácidos grasos (% FAME total) de los paquetes de lomo de cerdo con diferentes ratio gas de espacio de cabeza a carne.
Microbiological analysis
It should be emphasized that meat, irrespective of whether it has been previously considered unacceptable by consumers due to undesirable changes in appearance, odor and taste, deteriorates also by the action of the bacterial microflora. Its development is influenced mainly by the type of product, its pH, time, temperature and composition of gas atmosphere during storage (Cutter, Citation2002; Ismail, Deak, El-Rahmna, Yassien, & Beuchat, Citation2000). During the 12 days of storage of pork loins, there was no presence of Salmonella spp. and the number of E. coli bacteria and Enterobacteriaceae in each case was <1 log10CFU/g. Additionally in the second experimental design, changes in selected microbial populations are shown in . For all samples, the time of storage and the gas headspace to meat ratio were the factors affecting each bacterial group (P < 0.001). Also, the interaction between these two variables affected microbial growth (P < 0.001). This may happen due to the fact that the antibacterial activity of CO2 dissolved in the aqueous phase of stored pork loins is proportional to the effective concentration of this gas in the headspace (Devlieghere, Debevere, & Van Impe, Citation1998).
Table 3. Microbiological parameters of pork loins (average) with different gas headspace to meat ratio.
Tabla 3. Parámetros microbiológicos del lomo de cerdo (promedio) con diferentes ratio gas de espacio de cabeza a carne.
For all loins, the TAPC increased significantly with time and reached less than 7 log CFU/g after 12 days of storage (). On the final day, there was only a significant difference in the TAPC value for samples containing the highest portions of meat in comparison to samples containing the lowest portions of meat. Also, Bingol and Ergun (Citation2011) reported increased growth of microflora in ostrich meat in the case of lower gas headspace to meat ratio. In both cases, the observed changes were probably caused by insufficient CO2 concentrations, which reduce the number of aerobic bacteria during storage.
Psychrotrophic counts, lactic acid bacteria counts and Pseudomonas spp. increased during ST for pork loins packaged in all gas headspace to meat ratios. In spite of this fact, the final increase in the growth of these microorganisms in a 1:3 gas headspace to meat ratio was higher compared to the other two cases, the microbiology of the pork loins was unaffected by varying the gas headspace to meat ratio until day 12 of storage (). This effect can mainly be attributed to the bacteriostatic action of CO2 in the headspace of packaged samples (Bozec, Vautier, L’Hommeau & Le Roux, Citation2014). When headspace of CO2 was not enough according to meat volume, a significant increase in the growth rate of bacteria on the last day was noticed, which was also associated with higher production of CO2 by these microorganisms.
Psychrotrophs have a genetic ability to adapt to cool temperatures, which is confirmed by our results showing that their number was similar to the TAPC. On the other hand, the most common lactic acid bacteria occurring in meat includes facultative aerobes (Lactobacillus sp., Leuconostoc sp.), which grow better at lower concentrations of O2 (Nychas, Skandamis, Tassou, & Koutsoumanis, Citation2008), thus their slight increase for samples containing the highest portions of meat. The bacteria on meat stored in air conditions are dominated by the Pseudomonas spp., which proliferate on the surface of the meat at a very rapid rate using glucose as a basic medium. When the rate of diffusion of glucose from the tissue surface no longer meets the needs of the bacteria, they switch on the catabolism of amino acids. Before glucose is exhausted in muscle tissue at the normal pH (5.5), flora usually reaches a level of 108 cfu/g (Bruckner, Albrecht, Petersen, &Kreyenschmidt, Citation2012; Nychas et al., Citation2008). In our experimental design, Pseudomonas spp. growth was intensified when the gas concentrations decreased in the atmosphere, although these samples had the highest CO2 content which can be due to lactic acid bacteria (LAB) metabolism. Similar results were found by Bingol and Ergun (Citation2011) who reported that microbial growth increased during storage and samples with the biggest portions of meat showing the highest counts of them. On the contrary, Murphy, O’Grady, and Kerry (Citation2013) did not find significant differences of mesophilic and psychrotrophic bacteria counts in beef steaks packaged under different gas headspace to meat ratios.
Finally, yeast and molds also showed sustained growth during the storage. However, Bingol and Ergun (Citation2011) show their higher growth for samples containing higher portions of meat; in our study, the interaction between ST and the gas headspace to meat ratio (P < 0.001) showed that no differences were observed between the samples, taking into account varying the gas headspace to meat ratio ().
4. Conclusions
Based on the obtained results, an excess of pork in packs with high O2 modified atmosphere (80% O2, 20% CO2) contribute to the increase in microorganism growth. On the other hand, an inadequate portion of the product in relation to the gas headspace atmosphere can lead to unfavorable changes in its color. This may be related to changes in the gas headspace composition, which were more apparent in packaging containing more meat. Irrespective of that, no significant changes in the oxidation of FAs in pork stored for 12 days were observed. Therefore, due to the best quality properties of pork loins, gas headspace to meat ratio of 1:1 is recommended.
All in all, this research work can be used in practice in commercial meat processing units for packaging which are looking forward to a better packaging technique as well as the purpose of the consumers who have passion for safe food, looking for good sensory attributes in the food they consume.
Disclosure statement
No potential conflict of interest was reported by the authors.
Additional information
Funding
References
- Aaslyng, M.D., Bejerholma, C., Ertbjergb, P., Bertramc, H.C., & Andersen, H.J. (2003). Cooking loss and juiciness of pork in relation to raw meat quality and cooking procedure. Food Quality and Preference, 14, 277–288. doi:10.1016/S0950-3293(02)00086-1
- Bingol, E.B., & Ergun, O. (2011). Effects of modified atmosphere packaging (MAP) on the microbiological quality and shelf life of ostrich meat. Meat Science, 88, 774–785. doi:10.1016/j.meatsci.2011.03.013
- Blakistone, B.A. (1999). Meat and poultry. In B.A. Blakistone (Ed.), Principles and aplications of modified atmosphere packaging of food (pp. 240–290). Gaitherburg Maryland: Aspen Publishers.
- Bozec, A., Vautier, A., L’Hommeau, T., & Le Roux A. (2014, August). Optimising the shelf-life of pork chops with new gas compositions and reduced headspace. Paper presented at the 60th International Congress of Meat Science and Technology, Punta Del Este.
- Bruckner, S., Albrecht, A., Petersen, B., & Kreyenschmidt, J. (2012). Characterization and comparison of spoilage processes in fresh pork and poultry. Journal of Food Quality, 35, 372–382. doi:10.1111/j.1745-4557.2012.00456.x
- Clausen, I., Jakobsen, M., Ertbjerg, P., & Madsen, N.T. (2009). Modified atmosphere packaging affects lipid oxidation, myofibrillar fragmentation index and eating quality of beef. Packaging Technology Science, 22(2), 85–96. doi:10.1002/pts.828
- Cutter, C.N. (2002). Microbial control by packaging: A review. Critical Reviews in Food Science and Nutrition, 42(2), 151–161. doi:10.1080/10408690290825493
- Devlieghere, F., Debevere, J., & Van Impe, J. (1998). Concentration of carbon dioxide in the water-phase as a parameter to model the effect of a modified atmosphere on microorganisms. International Journal of Food Microbiology, 43, 105–113. doi:10.1016/S0168-1605(98)00101-9
- Folch, J., & Lees, M. (1957). A simple method for isolation and purification of total lipids from animal tis sues. The Journal of Biological Chemistry, 226, 497–509.
- García-Márquez, I., Narváez-Rivas, M., Gallardo, E., Cabeza, C.M., & León-Camacho, M. (2013a). Changes in the phospholipid fraction of intramuscular fat from pork loin (fresh and marinated) with different irradiation and packaging during storage. Grasas Y Aceites, 64, 7–14. doi:10.3989/gya.084312
- García-Márquez, I., Narváez-Rivas, M., Gallardo, E., Cabeza, C.M., & León-Camacho, M. (2013b). Changes in the volatile compounds of pork loin (fresh and marinated) with different irradiation and packaging during storage. Grasas Y Aceites, 64, 250–263. doi:10.3989/gya.131412
- García-Márquez, I., Narváez-Rivas, M., Gallardo, E., Cabeza, C.M., & León-Camacho, M. (2014). Characterization and quantification of the cholesterol oxidation product fraction of intramuscular fat from pork loin (fresh and marinated) with different irradiation and packaging during storage. Grasas Y Aceites, 65(e045). doi:10.3989/gya.0465141
- Gill, O., & Gill, C.O. (2005). Preservative packaging for fresh meats, poultry, and fin fish. In J. H. Han (Ed.), Innovations in food packaging (pp. 204–220). London: Elsevier Academic Press.
- Ismail, S.A., Deak, T., El−Rahman, H.A., Yassien, M.A., & Beuchat, L.R. (2000). Presence and changes in populations of yeasts on raw and processed poultry products stored at refrigeration temperature. International Journal of Food Microbiology, 62, 113–121. doi:10.1016/S0168-1605(00)00414-1
- ISO (1998). Microbiology of food and animal feeding stuffs -Horizontal method for the enumeration of mesophilic lactic acid bacteria - Colony-count technique at 30º C. ISO 13720:1998. Geneva: Author.
- ISO (2001a). Microbiology of food and animal feeding stuffs - Horizontal method for the enumeration of psychrotrophic microorganism. ISO 17410:2001. Geneva: Author.
- ISO. (2001b). Microbiology of food and animal feeding stuffs - Horizontal method for the enumeration of -glucuronidase-positive Escherichia coli - Part 2: Colony-count technique at 44 °C using 5-bromo-4-chloro-3-indolyl -D-glucoronide. ISO 16649-2:2001. Geneva: Author.
- ISO. (2004). Microbiology of food and animal feeding stuffs - Horizontal methods for the detection and enumeration of Enterobacteriaceae - Part 2: Colony-count method. ISO 21528-2:2004. Geneva: Author.
- ISO (2007). Microbiology of food and animal feeding stuffs - Horizontal method for the detection of Salmonella spp. - Amendment 1: Annex D: Detection of Salmonella spp. in animal faeces and in environmental samples from the primary production stage. ISO 6579:2002/Amd.1:2007. Geneva: Author.
- ISO. (2008). Microbiology of food and animal feeding stuffs - Horizontal method for the enumeration of yeasts and moulds - Part 2: Colony count technique in products with water activity less than or equal to 0,95. ISO 21527-2:2008. Geneva: Author.
- ISO (2010). Meat and meat products - Enumeration of presumptive Pseudomonas spp. ISO 13720:2010. Geneva: Autho
- ISO (2013). Microbiology of the food chain - Horizontal method for the enumeration of microorganisms - Part 1: Colony count at 30 degrees C by the pour plate technique. ISO 4833-1:2013. Geneva: Author.
- Jakobsen, M., & Bertelsen, G. (2002). The use of CO2 in packaging of fresh red meats and its effect on chemical quality changes in the meat: A review. Journal of Muscle Foods, 13, 143–168. doi:10.1111/j.1745-4573.2002.tb00326.x
- Jakobsen, M., & Bertelsen, G. (2004). Predicting the amount of carbon dioxide absorbed in meat. Meat Science, 68, 603–610. doi:10.1016/j.meatsci.2004.05.012
- Jeremiah, L.E., Penney, N., & Gill, C.O. (1992). The effects of prolonged storage under vacuum or CO2 on the flavor and texture profiles of chilled pork. Food Research International, 25(1), 9–19. doi:10.1016/0963-9969(92)90020-6
- John, L., Cornforth, D., Carpenter, C.E., Sørheim, O., Pettee, B.C., & Whittier, D.R. (2004). Colour and thiobarbituric acid values of cooked top sirloin steaks packaged in modified atmospheres of 80% oxygen, or 0.4% carbon monoxide, or vacuum. Meat Science, 69, 441–449. doi:10.1016/j.meatsci.2004.08.013
- Juncher, D., Rønn, B., Mortensen, E.T., Henckel, P., Karlsson, A., & Skibsted, L.H. (2001). Effect of pre-slaughter physiological conditions on the oxidative stability of color and lipid oxidation during chill storage of pork. Meat Science, 58, 347–357. doi:10.1016/S0309-1740(00)00156-X
- Kennedy, C., Buckley, D.J., & Kerry, J.P. (2004). Display life of sheep meats retail packaged under atmospheres of various volumes and compositions. Meat Science, 68(4), 649–658. doi:10.1016/j.meatsci.2004.05.018
- Kim, Y.H., Huff-Lonergan, E., Sebranek, J.G., & Lonergan, S.M. (2010). High-oxygen modified atmosphere packaging system induces lipid and myoglobin oxidation and protein polymerization. Meat Science, 85(4), 759–767. doi:10.1016/j.meatsci.2010.04.001
- Leick, C.M., Puls, C.L., Ellis, M., Killefer, J., Carr, T.R., Scramlin, S.M. … McKeith, F.K. (2010). Effect of distillers’ dried grains with solubles and ractopamine (Paylean) on quality and shelf-life of fresh pork and bacon. Journal of Animal Science, 88, 2751–2766. doi:10.2527/jas.2009-2472
- Lopez-Rubio, A., Almenar, E., Hernandez-Munoz, P., Lagaron, J.M., Catala, R., & Gavara, R. (2004). Overview of active polymer-based packaging technologies for food applications. Food Reviews International, 20(4), 357–387. doi:10.1081/FRI-200033462
- Lukic, M., Petronijevic, R., Petrovic, Z., Karana, D., Djordjevic, V., Trbovic, D., & Parunovic, N. (2015). Effects of different gas compositions on the color estimations of MAP packaged pork chops. Procedia Food Science, 5, 168–171. doi:10.1016/j.profoo.2015.09.048
- Lund, M.N., Lametsch, R., Hviid, M.S., Jensen, O.N., & Skibsted, L.H. (2007). High-oxygen packaging atmosphere influences protein oxidation and tenderness of porcine longissimus dorsi during chill storage. Meat Science, 77, 295–303. doi:10.1016/j.meatsci.2007.03.016
- Mancini, R.A., & Hunt, M.C. (2005). Current research in meat color. Meat Science, 71, 100–121. doi:10.1016/j.meatsci.2005.03.003
- Marcinkowska-Lesiak, M., Zdanowska-Sąsiadek, Ż., Stelmasiak, A., Damaziak, K., Michalczuk, M., Poławska, E. … Wierzbicka, A. (2016). Effect of packaging method and cold storage time on chicken meat quality. CYTA – Journal of Food, 14(1), 41–46. doi:10.1080/19476337.2015.1042054
- Murphy, K.M., O’Grady, M.N., & Kerry, J.P. (2013). Effect of varying the gas headspace to meat ratio on the Quality and shelf life of beef steaks packaged in high oxygen modified atmosphere packs. Meat Science, 94, 447–454. doi:10.1016/j.meatsci.2013.03.032
- Nychas, G.J.E., Skandamis, P.N., Tassou, C.C., & Koutsoumanis, K.P. (2008). Meat spoilage during distribution. Meat Science, 78, 77–89. doi:10.1016/j.meatsci.2007.06.020
- O’Grady, M.N. (2007). Report on the optimised gas to meat ratio in high oxygen modified atmosphere (MAP) to improve quality and safety of packaged beef (Final). Report, Integrated Project in FP6. Ireland, FOOD-CT-2006-36241
- Poławska, E., Lisiak, D., Jóźwik, A., Pierzchała, M., Strzałkowska, N., Pomianowski, J., & Wójcik, A. (2012). The effect of the diet supplementation with linseed and rapeseed on the physico-chemical and sensory characteristics of ostrich meat. Animal Science Papers and Reports, 30, 65–72.
- Seydim, A.C., Acton, J.C., Hall, M.A., & Dawson, P.L. (2006). Effects of packaging atmospheres on shelf-life quality of ground ostrich meat. Meat Science, 73, 503–510. doi:10.1016/j.meatsci.2006.01.010
- Teye, G.A., Sheard, P.R., Whittington, F.M., Nute, G.R., Stewart, A., & Wood, J.D. (2006). Influence of dietary oils and protein level on pork quality. 1. Effects on muscle fatty acid composition, carcass, meat and eating quality. Meat Science, 73, 157–165. doi:10.1016/j.meatsci.2005.11.010