
ABSTRACT
The stability of milk-based formulas (infant formula and follow-up formula) were evaluated at 42°C and 50°C, during 90 days. Unsaturated fatty acids, color, peroxide values, headspace oxygen and volatile organic compounds (VOCs) were analyzed to evaluate the stability of milk-based formulas. No significant changes were observed in the unsaturated fatty acids (except DHA with a significant decrease after 90 days storage) of milk-based formulas stored at 42 or 50°C for 90 days. There is a significant change in color of the formulas during storage. For peroxide values and headspace oxygen, samples which were stored at a higher temperature would have higher peroxide values and less headspace oxygen after 90 days. For VOCs, results showed the significant differences of VOCs profiles in the formulas stored at different temperatures and lengths of storage period. In this study, the higher fat, the less oxidation stability was found.
RESUMEN
El presente estudio se propuso evaluar la estabilidad de fórmulas de base láctea (fórmula infantil y fórmula de seguimiento) a los 42, 50 y 90 días [de almacenamiento]. Para evaluar la estabilidad de dichas fórmulas se analizaron los ácidos grasos insaturados, el color, los índices de peróxido, el espacio de cabeza de oxígeno y los compuestos orgánicos volátiles (VOCs). Después del almacenamiento durante 42, 50 y 90 días, no se observaron cambios significativos en los ácidos grasos insaturados de las fórmulas de base láctea (con excepción del DHA, que registró una disminución significativa después de 90 días de almacenamiento). Durante el almacenamiento, en las fórmulas se produjo un cambio de color significativo. En términos de los índices de peróxido y el espacio de cabeza de oxígeno, después de 90 días las muestras almacenadas a una temperatura más elevada mostraron índices de peróxido superiores y menos espacio de cabeza de oxígeno. En cuanto a los VOCs, los resultados registran diferencias significativas en los perfiles de VOCs en las fórmulas almacenadas a diferentes temperaturas y durante diferentes periodos. El estudio permitió concluir que cuanto mayor es el contenido de grasa, menor es la estabilidad de la oxidación.
1. Introduction
Infant formulas represent the only food for non-breast-fed infants and premature babies, playing a very important nutritional role since they represent the only way for providing newborns with all of the nutrients they need for healthy growth. Infant formulas contain fatty acids, which contain unsaturated fatty acids that satisfy the needs of the neonates. While some prooxidant in infant formula (Lee, Ho, Kean, & Chow, Citation2012; Schaich & Pryor, Citation1980a, Citation1980b) could make fat oxidation to appear in the powder, especially the unsaturated fatty acid such as linolenic acid, linoleic acid (LA), eicosapentaenoic acid (EPA), docosahexaenoic acid (DHA), arachidonic acid (ARA) (Cesa, Casadei, Cerreto, & Paolicelli, Citation2015; Manglano et al., Citation2005).
During peroxidation of unsaturated fatty acids (UFAs), hydroperoxides are formed and these primary products rapidly decompose to form a complex mixture of secondary lipid oxidation products (aldehydes, ketones, etc.), which spoil infant formulas (Gray & Monahan, Citation1992; Romeu-Nadal, Castellote, & López-Sabater, Citation2004; Romeu-Nadal, Chávez-Servín, Castellote, Rivero, & López-Sabater, Citation2007; Semeniuc et al., Citation2009). Traditionally, the peroxide value (POV) had been used to determine primary lipid oxidation products (Chávez-Servín, Castellote, Martín, Chifré, & López-Sabater, Citation2009; Lloyd, Hess, & Drake, Citation2009; Sun, Wang, Chen, & Li, Citation2011), the volatile organic compounds (VOCs) have been used to determine secondary lipid oxidation products (Chávez-Servín, Castellote, & López-Sabater, Citation2008; Van Ruth, Floris, & Fayoux, Citation2006).
In addition, as formulas contain large amounts of protein and carbohydrate, Maillard reaction easily takes place during shelf life. Maillard reaction between carbonyl and amino groups, not only can alter the color and flavor of infant formulas, but also lowers the nutritional value of protein, damages vitamins and even produces anti-nutrients and toxic substances, thereby influencing the stability of their shelf life. These generate compounds that affect food quality due to changes in color, flavor (off-flavor effect), texture and even nutritional value and food safety, thus, limit their shelf life stability (Sefrioui, Billiau, & Waer, Citation1997).
The food industry has continually striven to improve the quality and nutritional content of infant formula, aiming to bring their composition closer to that of human milk. Powdered infant formulas normally have similar fatty acid compositions to human milk. This is generally achieved by combining vegetable oils extracted from sunflower, soybean, coconut, palm, high-oleic safflower, peanut, low-erucic acid rapeseed and corn oils (Nasirpour, Scher, & Desobry, Citation2006), and added polyunsaturated fatty acids (PUFAs) to infant formula and follow-up formula, such as ARA and DHA (Chávez-Servín et al., Citation2009), which are more susceptible to oxidation than linoleic acid (C18:2, n-6) (LA), and may produce undesirable flavors and odors. Research paper has shown that hexanal is a major breakdown product of LA oxidation, while pentanal and hexanal are volatile oxidation products of n-6 PUFA and propanal of n-3 PUFA (García-Martínez et al., Citation2010).
On this basis, the aim of this study was to evaluate the stability of milk-based formulas that are supplemented with PUFAs under different storage conditions, so as to find a simple method to monitor the stability of infant formula. Two infant formulas with the same material, the same processing technology and with different fat contents were studied to analyze their oxidation stability. The stability of milk-based formulas was evaluated through the detection of unsaturated fatty acids (UFAs), color, peroxide values (POV), headspace oxygen (HO) and VOCs. During the study, milk-based formulas, sealed in their original packaging, were stored at different temperatures to accelerate oxidation so as to give information about the shelf life of these products in a shorter time.
2. Materials and methods
2.1. Samples
Infant formula (IF1) and follow-up formula (IF2) powder samples, supplemented with PUFAs (ARA (C20:4 n-6) and DHA (C22:6 n-3), were produced at a pilot scale at Brightdairy´ Product Technology Centre (Shanghai, China) using the same processing conditions (wet-mix process, in which dry ingredients are mixed in a liquid phase (water or milk), and then heat-treated). Samples were packaged by aluminum foil bag and filled with nitrogen. Samples’ detailed information was shown in supplementary Table 1.
The milk-based infant formula powders stability was studied by means of an accelerated storage test, which is commonly used to obtain reliable information on product stability. The milk-based powder IF1 and IF2 were kept in the dark either at 42 ± 2°C (Relative humidity 75%) or at 50 ± 2°C (Relative humidity 75%) from production until 0, 30, 60 and 90 days thereafter. Every 30 days, the samples were stored in their original packages, and each sample was withdrawn and stored at −80°C until analysis was performed.
2.2. UFAs analysis
Fatty acid profiles were analyzed by fast GC after derivatization to FAMEs according to GB 5413.27-2010 (Determination of fatty acids in foods for infants and young children, milk and milk products. Standards Press of China).Unsaturated fatty acid (oleic acid (C18:1 n-9), LA (C18:2 n-6), linolenic acid (18:3 n-3), ARA (C20:4 n-6), EPA (C20:5 n-3) and DHA (C22:6 n-3) of IF1and IF2 samples were analyzed after predetermined days. Thirty-seven standard fatty acid triglycerides, used as the fatty acid internal standard, were purchased from Sigma (Sigma-Aldrich, China). Each analysis was repeated two times.
2.3. Color determination
Measurement of L*, a* and b* values of milk powders were carried out as described by Nielsen, Stapelfeldt and Skibsted (Citation1997b) and modified. Color measurement was conducted using a ColorFlex EZ spectrophotometer (Hunter Lab, Reston, U.S.A) with a 31.8 mm aperture, the port diameter/view diameter 45º/0º. The instrument was calibrated using a white plate. Illuminant was D65 at a standard observation of 10. The results were expressed as L* (lightness ranging from 0% to 150%), a* (color axis ranging from greenness (−a*) to redness (+a*)) and b* (color axis ranging from blueness (−b*) to yellowness (+b*)). Each experiment has been repeated two times.
2.4. POV determination
The POV was performed according to the method proposed by Cesa and modified (Cesa, Casadei, Cerreto, & Paolicelli, Citation2012). In this method, 15 g milk-based formulas were weighed and reconstituted with 70 mL of demineralized water at 37°C. 280 mL of n-hexane/propan-2-ol, 3:1 was added to the powder and the mixture was kept under magnetic stirring for 15 min, ultrasonic time 60 s (20 kHz), centrifuged (7000 × g, 10 min) and filtered (with anhydrous sodium sulfate). The upper phase was collected and the inner phase was added with 90 mL of n-hexane/propan-2-ol, 3:1 twice. The collected organic phase was evaporated at room temperature under reduced pressure and in the darkness. The obtained residue was weighed and titrated. Each experiment was repeated twice.
2.5. HO determination
HO of each milk-based infant formula package measurement was conducted using a Gas Analyzer MAPY 4.0 (WITT-Gasetechnik GmbH & Co KG EZ, Germany) according to (Lloyd, Zou, Ogden, & Pike, Citation2004) with modifications. Headspace oxygen was measured using a rigid pack sampler with a 0.2-pm filter, and the instrument was calibrated to ambient air (20.9% oxygen) beforehand. After that, a septum was placed on each can top, followed by puncturing with the rigid pack sampler, the headspace gas was drawn out and injected into the analyzer to generate a reading about percentage oxygen, the measure time was 15 s. Each analysis was repeated two times.
2.6. VOCs analysis
The HERACLES electronic nose (Alpha M.O.S., Toulouse, France) was applied to monitor the volatile organic compounds (VOCs) extracts from different milk-based infant formulas. This instrument, which had the ability to perform complete data treatment, was integrated with classical GC functionalities and E-Nose olfactive fingerprint software. It is consisted of a sampling system, a detector system that contains two short columns of different polarities coupled (MXT-5 and MXT-1701, nonpolar and polar, long 10 m, diameter 180 µm) to two flame ionization detectors (FID) for a global fingerprint and a data acquisition and processing system (Alpha MOS proprietary software (Alpha Soft 14.2)) which used multivariate statistical analysis and chemometrics to acquire, compute and interpret electronic nose measurements. A typical analysis could be run in 15–120 s, and VOCs analysis was performed in less than 60 s, with a sensitivity reaching ppb concentrations, due to an integrated trap using absorbent support.
Volatiles were collected and analyzed by the HERACLES electronic nose as described by Xiao et al. (Citation2014) with several modifications. Briefly, 1 g sample and 1 mL ultrapure water were placed in 10 ml headspace vials and capped with a Teflon faced silicon rubber cap, afterward the vials with tested samples were incubated at 50°C for 20 min. The incubation temperature was set at 60°C, and the autosampler injected 5000 μL of gas samples from headspace to GC with a rate of 100 μL/s. The following temperature conditions were used: injector at 200°C; temperature program including isotherm at 40°C; for 2 s, a 3°C/s ramp to 250°C and isotherm at 250°C for 5 s; and detector temperature at 261°C. Three copies vials were orderly placed in the automatic sampler in the headspace system. The parameters were optimized in details, and each analysis was repeated three times. The method of analysis was calibrated using an alkane solution (n-butane to n-hexadecane) to convert retention time in Kovat’s indices and to identify the VOCs using AroChem Base. The data processing was carried out with Alphasoft V14.2 software.
2.7. Statistical analysis
Statistical analysis was conducted with IBM SPSS Statistic 21, and one-way analysis of variance (ANOVA) was used. The least significant difference at a 95% confidence level (α ≤ 0.05) was set in statistical tests.
The sensory data such as X (time)/Y (relative area or relative height of peaks) from GC were analyzed using the statistical software AlfaSoft 14.2 delivered with Heracles II. Automatic data reduction was used to select the most significant variables for the application. Statistical package allowed to analyze the results obtained and to trace VOCs profile changes using principal components analysis (PCA).
3. Results and discussion
3.1. Unsaturated fatty acids
UFAs were determined at times 0, 30, 60 and 90 days after keeping at 42°C or 50°C;. Due to the slight differences found between fatty acids over time, we included only those unsaturated fatty acid (C18:1 n-9, C18:2 n-6, C18:3 n-3, C20:4 n-6, C20:5 n-3 and C22:6 n-3) profiles determined at the starting point (0 day), after 30 days of storage, after 60 days of storage and after 90 days of storage. Results are expressed as % wt/wt of fat (). Unexpectedly, only DHA of milk-based powders showed a significant difference (p < 0.05) during storage. This difference was found in IF1 after 90 days of storage at 42°C (from 0.140% to 0.134%) and of storage at 50°C (from 1.40% to 1.30%). A significant decrease or increase of other fatty acids in both formulas was found.
Table 1. Unsaturated fatty acids of the studied milk-based formulas during storage 90 days (% wt/wt, mean ± SD).
Tabla 1. Ácidos grasos insaturados de las fórmulas de base láctea durante 90 días de almacenamiento (% p/p, media ± DE).
PUFAs, in particular, are easily attacked by free radicals that react with their double bonds, thereby yielding several products such as short-chain aldehydes (Manglano et al., Citation2005; Romeu-Nadal et al., Citation2007). It is believed that the susceptibility of fatty acids to oxidation is largely related to their degree of unsaturation (Chávez-Servín et al., Citation2009). Thus, DHA, EPA and ARA, the most unsaturated fatty acids in the formula studied, were expected to be the most susceptible to oxidation due to their structural characteristics. However, surprisingly, EPA and ARA levels remained constant throughout storage. As stated above, only DHA (the major n-3 PUFAs in the studied formula) of IF1 showed a decrease (). While there was no significant change for all of the UFAs in IF2. Regarding the lower DHA content in IF1, it may be caused by the higher fat content considering the same DHA material and the processing technology.
3.2. Colorimetric values
The colorimetric values of milk-based infant formulas were evaluated in the powders stored at 42 and 50°C (). For both formulas, the colorimetric values of milk-based infant formulas showed the same behavior: a clear decrease of L* (formulas stored at 42°C and 50°C) and a* (formulas stored at 42°C), a clear increase of b* (formulas stored at 42°C and 50°C) and a* (formulas stored at 50°C). During storage, the decreases (or increases) of L*, a* and b* stored at 50°C was more rapid than milk-based infant formulas stored at 42°C. For instance, on the 30th day, a significant decrease in L* value was observed for IF2 stored at 50°C, while this change was absent for those stored in 42°C. Regarding the experiments performed for 30 days, L* of IF1 and IF2 decrease to 92.18 and 93.08 stored at 42°C, but L* of IF1 and IF2 decrease to 91.45 and 92.19 stored at 50°C, respectively. After 90 days, L* of IF1 stored at 42°C showed a significant increase (compared to the starting value), a* of IF2 stored at 42°C did not show a significant increase, maybe because the IF1 and IF2 had different fat, protein and carbohydrate contents that influenced the color changes.
Table 2. Colorimetric values of the studied milk-based formulas during storage 90 days (mean ± SD).
Tabla 2. Índices colorimétricos de las fórmulas de base láctea almacenadas durante 90 días (media ± DE).
These results of L* and b* were consistent with Nielsen, Stapelfeldt and Skibsted (Citation1997a), which showed that L* (lightness) gradually decreased and the color gradually turned darker. Meanwhile, b* (yellow-blue degree) gradually increased and the color was changed to be yellow with the prolonging of the storage. Besides, the development trend of a*’ for the same powder varies with temperature change, the a* of the milk-based powder decreased during storage under 42°C, as opposed to an increase for those stored at 50°C. The result showed that the progressive oxidation changes of milk-based powder samples during storage were in accordance with the observations made by Cesa et al. (Citation2015).
3.3. Peroxide values and headspace oxygen
To assess the effects of storage time and temperature on the oxidative stability of UFAs supplemented formula, we measured POV and HO of the package ( and ). The limiting POV specified by China standards for edible vegetable oil is 0.25 g/100g (9.85 mmol/kg). At the beginning of this study, a value of 0.77 mmol/kg was recorded for IF1, which increased to 7.70 mmol/kg for those stored at 42°C, and 9.50 mmol/kg for those stored at 50°C after 90 days. For IF2, a value of 1.04 mmol/kg was recorded at the outset of our study, while values of 6.24 and 7.99 mmol/kg were recorded at 90 days for 42°C and 50°C, respectively. By the end of the storage period, all POV had increased by ≥6 times. Other than that, POV had increased to a larger extent for IF1 than IF2 under the same condition.
Figure 1. Peroxide value and headspace oxygen of infant formula during storage (IF1-42-POV, the peroxide value of infant formula stored at 42°C; IF1-50-POV, the peroxide value of infant formula stored at 50°C; IF1-42-HO, the headspace oxygen of infant formula stored at 42°C; IF1-50-HO, the headspace oxygen of infant formula stored at 50°C).
Figura 1. Índice de peróxido y espacio de cabeza de oxígeno en la fórmula infantil durante el almacenamiento (IF1-42-POV, el índice de peróxido de la fórmula infantil almacenada a 42°C; IF1-50-POV, el índice de peróxido de la fórmula infantil almacenada a 50°C; IF1-42-HO, el espacio de cabeza de oxígeno de la fórmula infantil almacenada a 42°C; IF1-50-HO, el espacio de cabeza de oxígeno de la fórmula infantil almacenada a 50°C).
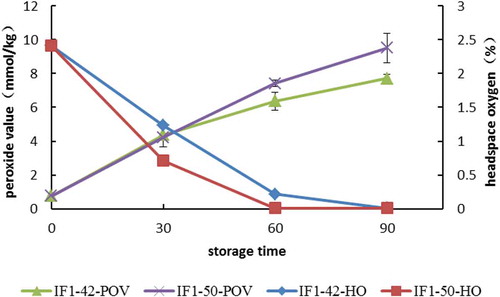
Figure 2. Peroxide value and headspace oxygen of follow-up formula during storage (IF2-42-POV, the peroxide value of follow-up formula stored at 42°C; IF2-50-POV, the peroxide value of follow-up formula stored at 50°C; IF2-42-HO, the headspace oxygen of follow-up formula stored at 42°C; IF2-50-HO, the headspace oxygen of follow-up formula stored at 50°C).
Figura 2. Índice de peróxido y espacio de cabeza de oxígeno de la fórmula de seguimiento durante el almacenamiento (IF2-42-POV, el índice de peróxido de la fórmula de seguimiento almacenada a 42°C; IF2-50-POV, el índice de peróxido de la fórmula de seguimiento almacenada a 50°C; IF2-42-HO, el espacio de cabeza de oxígeno de la fórmula de seguimiento almacenada a 42°C; IF2-50-HO, el espacio de cabeza de oxígeno de la fórmula de seguimiento almacenada a 50°C).
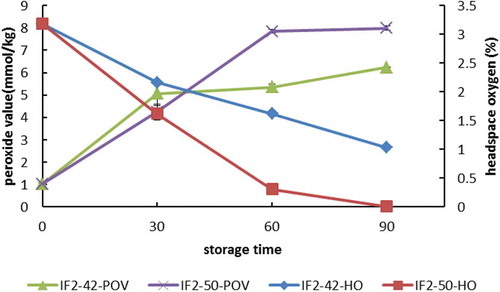
As we know, both temperature and oxygen are the main risk factors for the autoxidation process. The headspace oxygen of the milk-based formulas was also studied in this paper. The results showed that at the beginning of the study, the HO of IF1 was 2.41%, which decreased to 0.01% after 90 days of storage at 42°C, and to 0.01% after 60 days of storage at 50°C. For IF2, the HO was 3.18% at the outset of our study, while values of 1.03% and 0.01% were recorded at 90 days for 42°C and 50°C, respectively. These matched with the trend of POV values obtained in the study. In the earlier stage, POV values of both formulas increased sharply, while HO consumption increased speedily in the first 60 days. From our study, we concluded that the oxidation of milk powder was quickly induced in the early storage (when oxygen is at a higher concentration) and produced primary oxidation products.
3.4. Changes of VOCs profile during storage
VOCs in IF1 and IF2 samples for 0, 30, 60 and 90 days are presented in . As indicated in , 35 VOCs were found in tested samples from group of aldehydes, alcohols, ketones, hydrocarbons, volatile acids, amine and sulfur compounds. The VOCs in milk-based formulas found in our study coincided with that proposed by the study of Hausner, which were mainly aldehydes, alcohols, ketones and small amount of other compounds (Hausner, Philipsen, Skov, Petersen, & Bredie, Citation2009). In this study, IF1 samples with 0-day storage had a minimum number of VOCs, with no presence of sulfur compounds, amine, less aldehydes (without 3-methylbutanal and (Z)-3-hexenal), and ketones (without 3-hexanone, 3-hexen-2-one and 2-octanone). For IF2 samples with 0-day storage had a similar condition with IF1, had a minimum number of VOCs, with no presence of sulfur compounds, less aldehydes, ketones and alcohols. IF1 and IF2 samples from 30 days to 90 days storage showed a similar change trend of VOCs numbers (more and more), with no esters being detected. Powder samples tested after 50°C storage showed a variety of VOCs with the predominance of aldehydes, Ketones and acids.
Table 3. Volatile organic compounds of milk-based powders during storage.
Tabla 3. Compuestos orgánicos volátiles de los polvos de base láctea durante su almacenamiento.
3.5. Statistical evaluation of differentiation of VOCs profiles
Data from all of the tested samples consisting of sensors sets (finger print) of relative areas and relative heights of peaks were assigned to represent retention times. With data reduction (Discrimination power >0.9), a PCA variance model was developed. For IF1-42, IF1-50, IF2-42 and IF2-50, PCA analysis returned 13, 14, 11 and 10 principal components, from which the first two were considered significant as they explained >90% of the data variance (IF1-42: PC1 71.752%, PC2 20.904%; IF1-50: PC1 73.800%, PC2 18.712%; IF2-42: PC1 80.691%, PC2 15.836% and IF2-50: PC1 99.461%, PC2 0.323%), and the discrimination index were 94, 83, 93 and 93, respectively. The obtained discrimination result showed the difference among VOCs profiles of samples stored at 42°C or 50°C. shows the selection of the peaks allowed better discrimination among different storage periods. In addition, it was found that the distance between samples under the same storage condition showed a trend of gradual increase. Therefore, PCA variance model is suitable for expressing the difference among samples.
Figure 3. Biplot of principal component analysis about infant formula and follow-up formula (IF1-42, infant formula stored at 42°C; IF1-50, infant formula stored at 50°C; IF2-42, follow-up formula stored at 42°C; IF2-50, follow-up formula stored at 50°C).
Figura 3. Biplot [diagrama de dispersión de dos variables] del análisis de componentes principales en la fórmula infantil y la fórmula de seguimiento (IF1-42, fórmula infantil almacenada a 42°C; IF1-50, fórmula infantil almacenada a 50°C; IF2-42, fórmula de seguimiento almacenada a 42°C; IF2-50, fórmula de seguimiento almacenada a 50°C).
![Figure 3. Biplot of principal component analysis about infant formula and follow-up formula (IF1-42, infant formula stored at 42°C; IF1-50, infant formula stored at 50°C; IF2-42, follow-up formula stored at 42°C; IF2-50, follow-up formula stored at 50°C).Figura 3. Biplot [diagrama de dispersión de dos variables] del análisis de componentes principales en la fórmula infantil y la fórmula de seguimiento (IF1-42, fórmula infantil almacenada a 42°C; IF1-50, fórmula infantil almacenada a 50°C; IF2-42, fórmula de seguimiento almacenada a 42°C; IF2-50, fórmula de seguimiento almacenada a 50°C).](/cms/asset/905631c5-1258-42c9-a216-37554d18cd92/tcyt_a_1561519_f0003_oc.jpg)
and Table 4 show that most of the VOCs which induced IF1-42 to differ during different storage periods were acetaldehyde, propan-2-one, propanal, 2-butanol, 2-methyl-1-propanol, 2-methylbutanal, 3-ethylpentane, pentanal, 1-hexen-3-one, hexanal, 2,4-octadiene, 3-methyl-octane and octanal. VOCs which induced IF1-50 difference during the storage periods were acetaldehyde, propan-2-one, propanal, butanal, 2-butanol, 2-methyl-1-propanol, 2-methylbutanal, 1-penten-3-one, 3-ethylpentane, 3-pentanol, 2,4-octadiene, 3-methyl-octane, methional, octanal;the VOCs of IF2-42 were acetaldehyde, propan-2-one, propanal, 1-propanol, 2-butanol, 3-ethylpentane, pentanal, 1-hexen-3-one, hexanal, 3-methyl-octane, 2-heptanone. Meanwhile, the VOCs of IF2-50 were acetaldehyde, propan-2-one, propanal, butanal, 2-butanol, 2-methyl-1-propanol, 2-methylbutanal, 1-penten-3-one, 3-pentanol and 3-methyl-octane. Further analysis was found that regarding IF1-42, the baseline (0 days) had good relativity with octanal, 60 days had good relativity with propanal, 3-ethylpentane, 2,4-octadiene and 3-methyl-octane as well as hexanal, pentanal, 1-hexen-3-one, acetaldehyde and 2-butanol for 90 days. Similar analysis for IF1-50, IF2-42 and IF2-50, see and .
In order to further analyze the difference VOCs screened by PCA, AlfaSoft 14.2 was used to treat the corresponding material and got its relative area. Supplementary Figs. 1–4 were the relative content (indicated by the relative peak area) of VOCs from each sample during different storage periods. Supplementary Figs. 1–4 showed propan-2-one was with the highest content in all VOCs. Supplementary Figs. 1 and 3 showed the second oxidation products of propanal, pentanal and hexanal were gradually increased with the storage time when IF1 and IF2 were under 42°C. This result reflected their oxidation degree increased slowly and was consistent with the result of Chávez-Servín et al. (Citation2009, Lloyd et al. (Citation2009) which indicated that this storage temperature of milk-based powders was a moderate temperature to produce milk lipid oxidation, and their contents increased with the degree of oxidation.
However, regarding the IF1 and IF2 powders stored at 50°C, the main substances that differed between samples during the storage periods were not aldehydes, but large molecular products of fat oxidation, methyl or ethyl products. These phenomena might indicate that milk-based infant formulas stored at higher temperature had a faster oxidation rate, and that the milk-based infant formula stored in the high temperature would have an obvious oxidation degree. Besides, these results were also supported by the sensory evaluation of milk-based formulas: milk-based formulas stored at 50°C for 60 d showed obvious unpleasant oxidized flavor while this unpleasant taste was not found in the ones stored at 42°C for 90 d (data not shown).
4. Conclusions
The most important conclusions of the present study were, on the one hand, that infant formula and follow-up formula stored at 42 or 50°C for 90 days did not show significant changes in UFAs (except DHA of IF1 stored at 42°C and 50°C). On the other hand, the color showed a significant change in milk-based powders during storage. The results of color were as follows: L* gradually decreased and the color gradually turned darker, b* gradually increased and the color changed more to yellow with storage time. Besides, the change of a* was related to the temperature, a* slowly decreased when formulas were stored at 42°C and rapidly increased at 50°C. For peroxide values and headspace oxygen, samples which were stored at a higher temperature would have higher peroxide values and lower headspace oxygen after 90 days. And this study also confirmed that electronic nose Heracles II could be used to differentiate milk-based infant formulas. Milk-based formula samples with 0, 30, 60 and 90 days of storage at 42 or 50°C were successfully recognized by VOCs profile analysis with PCA. For milk-based formulas stored at 42°C, the significant differences of VOCs profiles were dominated by aldehydes such as acetaldehyde, propanal, 2-methylbutanal, pentanal and hexanal, etc.. But for milk-based formulas stored at 50°C, the significant differences of VOCs profiles were dominated by aldehydes, methyl- and Ethyl-compounds such as 2-methyl-1-Propanol, 2-methylbutanal, 3-Ethylpentane, 3-methyl-octane, Methional, acetaldehyde, propanal, etc. In this study, it was found that IF2 had higher stability than IF1, despite the fact that IF1 had a lower DHA content compared to IF2 (the baseline of DHA in IF1 is about 37.5 mg/100 g, IF2 43.5 mg/100 g). So for the higher fat content, the worse oxidation stability was also found. Meanwhile, for the powder industry, the color and VOCs were found to be the more suitable parameters for evaluation of the freshness of milk-based formulas because these are rapid, cheap and reliable to detect. Of course, peroxide value was also a good indicator for evaluating the stability of milk-based powder without considering the ease of operation.
Author contributions
We thank Wang Jun-kui and Wang Feng-xian for their technical assistance. Jia Hong-xin, Chen Wen-liang, Qi Xiao-yan and Su Mi-ya designed the study. Chen Wen-liang and Qi Xiao-yan collected test data and discussed over the course of the study. Jia Hong-xin and Su Mi-ya wrote the manuscript and had primary responsibility for the final content. A sincere thank you to Hung Ying Fung Alison for her diligent proofreading of the manuscript. All authors read and approved the final manuscript.
Supplemental Material
Download Zip (257 KB)Acknowledgments
The authors thank Brightdairy (Shanghai, China) for providing the samples of infant formula and follow-up formula.
Disclosure statement
No potential conflict of interest was reported by the authors.
Supplementary material
Supplemental data for this article can be accessed here.
Additional information
Funding
Related Research Data
References
- Buttery, R. G., Guadagni, D. G., & Ling, L. C. (1973). Flavor compounds. volatilities in vegetable oil and oil-water mixtures. estimation of odor thresholds. Journal of Agricultural & Food Chemistry, 21(2), 198–201.
- Buttery, R. G., Turnbaugh, J. G., & Ling, L. (1988). Contribution of volatiles to rice aroma. Journal of Agricultural & Food Chemistry, 36(5), 1006–1009.
- Cesa, S., Casadei, M. A., Cerreto, F., & Paolicelli, P. (2012). Influence of fat extraction methods on the peroxide value in infant formulas. Food Research International, 48(2), 584–591.
- Cesa, S., Casadei, M. A., Cerreto, F., & Paolicelli, P. (2015). Infant milk formulas: Effect of storage conditions on the stability of powdered products towards autoxidation. Foods, 4(3), 487–500.
- Chávez-Servín, J. L., Castellote, A. I., & López-Sabater, M. C. (2008). Volatile compounds and fatty acid profiles in commercial milk-based infant formulae by static headspace gas chromatography: Evolution after opening the packet. Food Chemistry, 107(1), 558–569.
- Chávez-Servín, J. L., Castellote, A. I., Martín, M., Chifré, R., & López-Sabater, M. C. (2009). Stability during storage of LC-PUFA-supplemented infant formula containing single cell oil or egg yolk. Food Chemistry, 113(2), 484–492.
- Evans, C. D., Moser, H. A., & List, G. R. (1971). Odor and flavor responses to additives in edible oils. Journal of the American Oil Chemists’ Society, 48(9), 495–498.
- García-González, D. L., Tena, N., Aparicio-Ruiz, R., & Morales Maria, M. A. (2008). Relationship between sensory attributes and volatile compounds qualifying dry-cured hams. Meat Science, 80(2), 315–325.
- García‐Martínez, M. D. C., Rodríguez‐Alcalá, L. M., Marmesat, S., Alonso, L., Fontecha, J., & Márquez‐Ruiz, G. (2010). Lipid stability in powdered infant formula stored at ambient temperatures. International Journal of Food Science & Technology, 45(11), 2337–2344.
- Giri, A., Osako, K., & Ohshima, T. (2010). Identification and characterisation of headspace volatiles of fish miso, a japanese fish meat based fermented paste, with special emphasis on effect of fish species and meat washing. Food Chemistry, 120(2), 621–631.
- Gray, J. I., & Monahan, F. J. (1992). Measurement of lipid oxidation in meat and meat products. Trends in Food Science & Technology, 3(10), 315–319.
- Gunten, R. L. V., Bush, L. J., Odell, G. V., Wells, M. E., & Adams, G. D. (1976). Factors related to the occurrence of trimethylamine in milk. Journal of Milk & Food Technology, 39(8), 526–529.
- Hausner, H., Philipsen, M., Skov, T. H., Petersen, M. A., & Bredie, W. L. P. (2009). Characterization of the volatile composition and variations between infant formulas and mother’s milk. Chemosensory Perception, 2(2), 79–93.
- Karagül-Yüceer, Y., Drake, M. A., & Cadwallader, K. R. (2004). Evaluation of the character impact odorants in skim milk powder by sensory studies on model mixtures. Journal of Sensory Studies, 19(1), 1–13.
- Kubickova, J., & Grosch, W. (1998). Quantification of potent odorants in camembert cheese and calculation of their odour activity values. International Dairy Journal, 8(1), 17–23.
- Lee, T. A., Ho, J. H., Kean, K. S., & Chow, C. F. (2012). Comprehensive stability evaluation of iron-fortified milk powder. Food Science & Technology Research, 18(3), 419–428.
- Lloyd, M. A., Hess, S. J., & Drake, M. A. (2009). Effect of nitrogen flushing and storage temperature on flavor and shelf-life of whole milk powder. Journal of Dairy Science, 92(6), 2409–2422.
- Lloyd, M. A., Zou, J., Ogden, L. V., & Pike, O. A. (2004). Sensory and nutritional quality of nonfat dry milk in long-term residential storage. Journal of Food Science, 69(8), S326–S331.
- Luna, G., Morales, M. T., & Aparicio, R. (2006). Characterisation of 39 varietal virgin olive oils by their volatile compositions. Food Chemistry, 98(2), 243–252.
- Manglano, P., Lagarda, M. J., Silvestre, M. D., Vidal, C., Clemente, G., & Farré, R. (2005). Stability of the lipid fraction of milk-based infant formulas during storage. European Journal of Lipid Science & Technology, 107(11), 815–823.
- Meijboom, P. W. (1964). Relationship between molecular structure and flavor perceptibility of aliphatic aldehydes. Journal of the American Oil Chemists’ Society, 41(4), 326–328.
- Morales, M. T., Luna, G., & Aparicio, R. (2005). Comparative study of virgin olive oil sensory defects. Food Chemistry, 91(2), 293–301.
- Nasirpour, A., Scher, J., & Desobry, S. (2006). Baby foods: Formulations and interactions (a review). Critical Reviews in Food Science and Nutrition, 46(8), 665–681.
- Nielsen, B. R., Stapelfeldt, H., & Skibsted, L. H. (1997a). Differentiation between 15 whole milk powders in relation to oxidative stability during accelerated storage: Analysis of variance canomical variable analysis. International Dairy Journal, 7(8–9), 589–599.
- Nielsen, B. R., Stapelfeldt, H., & Skibsted, L. H. (1997b). Early prediction of the shelf-life of medium-heat whole milk powders using stepwise multiple regression and principal component analysis. International Dairy Journal, 7(5), 341–348.
- Preininger, M., & Grosch, W. (1994). Evaluation of key odorants of the neutral volatiles of emmentaler cheese by the calculation of odour activity values. Lebensm. -Wiss. Technol., 27(3), 237–244.
- Reiners, J., & Grosch, W. (1998). Odorants of virgin olive oils with different flavor profiles. Journal of Agricultural & Food Chemistry, 46(7), 2754–2763.
- Romeu-Nadal, M., Castellote, A. I., & López-Sabater, M. C. (2004). Headspace gas chromatographic method for determining volatile compounds in infant formulas. Journal of Chromatography A, 1046(1–2), 235–239.
- Romeu-Nadal, M., Chávez-Servín, J. L., Castellote, A. I., Rivero, M., & López-Sabater, M. C. (2007). Oxidation stability of the lipid fraction in milk powder formulas. Food Chemistry, 100(2), 756–763.
- Schaich, K. M., & Pryor, W. A. (1980a). Free radical initiation in proteins and amino acids by ionizing and ultraviolet radiations and lipid oxidation-part III: Free radical transfer from oxidizing lipids. CRC Critical Reviews in Food Science & Nutrition, 13(3), 189–244.
- Schaich, K. M., & Pryor, W. A. (1980b). Free radical initiation in proteins and amino acids by ionizing and ultraviolet radiations and lipid oxidation-part I: Ionizing radiation. CRC Critical Reviews in Food Technology, 13(2), 89–129.
- Schnabel, K. O., Belitz, H. D., & Ranson, C. V. (1988). Investigations on the structure-activity-relationships of odorous substances. communication i. detection thresholds and odour qualities of aliphatic and alicyclic compounds containing oxigen functions. Zeitschrift für Lebensmittel-Untersuchung und Forschung, 187(3), 215–223.
- Sefrioui, H., Billiau, A. D., & Waer, M. (1997). Early events in oxidation of whole milk powder detected by electron spin resonance spectrometry. carry-over effects from butter oil used for instantization. Transplantation, 70(2), 348–353.
- Semeniuc, C. A., Guş, C., Rotar, A. M., Socaci, S. A., Suharoschi, R., & Laslo, C. (2009). Effect of storage time on the oxidative status of infant formula. Bulletin of University of Agricultural Sciences and Veterinary Medicine Cluj-Napoca. Agriculture, 66(2), 448–452.
- Stephan, A., & Steinhart, H. (1999). Quantification and sensory studies of character impact odorants of different soybean lecithins. Journal of Agricultural & Food Chemistry, 47(10), 4357–4364.
- Sun, Y. E., Wang, W. D., Chen, H. W., & Li, C. (2011). Autoxidation of unsaturated lipids in food emulsion. Critical Reviews in Food Science & Nutrition, 51(5), 453–466.
- Van Ruth, S. M., Floris, V., & Fayoux, S. (2006). Characterisation of the volatile profiles of infant formulas by proton transfer reaction-mass spectrometry and gas chromatography-mass spectrometry. Food Chemistry, 98(2), 343–350.
- Xiao, Z., Yu, D., Niu, Y., Chen, F., Song, S., Zhu, J., & Zhu, G. (2014). Characterization of aroma compounds of chinese famous liquors by gas chromatography-mass spectrometry and flash gc electronic-nose. Journal of Chromatography. B, 945-946(2), 92–100.