
ABSTRACT
1,3-Dioleoyl-2-palmitoylglycerol (OPO), an important structured triacylglycerol, is generally supplemented into infant and toddler formulas as a nutrient fortifier. However, its role on fecal microbiota has not received attention in the last decades. In this study, anaerobic fermentation in vitro and high-throughput sequencing were conducted to investigate effects of standard OPO alone (OPO-A) and OPO-enriched plant-oil formula (OPO-P) on toddler fecal microbiota. The results showed OPO could be efficiently utilized by toddler fecal microbiota. OPO supplementation enhanced the production of short-chain fatty acids and lactic acid by microbiota. Furthermore, OPO promoted the growth of Bifidobacterium whereas inhibited the growth of Enterobacter at different fermentation time when compared with the control group. Besides, OPO supplementation enhanced bacterial diversity. Thus, this study indicated that OPO could modulate the fecal microbiota. The results provided useful information for further exploring the physiological role of OPO on colon, and provided new ideas for application of OPO.
RESUMEN
Generalmente, en fórmulas destinadas a lactantes y niños pequeños el 1,3-dioleoil-2-palmitoilglicerol (OPO), un importante triacilglicerol estructurado, se complementa como un enriquecedor de nutrientes. Sin embargo, en las últimas décadas no se ha dado atención al papel que desempeña en la microbiota fecal. En el presente estudio, se emplearon la fermentación anaeróbica in vitro y la secuenciación de alto rendimiento para investigar los efectos del OPO estándar solo (OPO-A) y la fórmula de aceite vegetal enriquecido con OPO (OPO-P) en la microbiota fecal de niños pequeños. Los resultados mostraron que el OPO podía ser utilizado eficientemente por ésta. La suplementación con OPO mejoró la producción de ácidos grasos de cadena corta y de ácido láctico por la microbiota fecal. Además, en comparación con el grupo de control, el OPO promovió el crecimiento de Bifidobacterium al tiempo que inhibió el crecimiento de Enterobacter en diferentes tiempos de fermentación. Asimismo, se comprobó que la suplementación con OPO mejora la diversidad bacteriana. Por lo tanto, este estudio constató que OPO puede modular la microbiota fecal. Los resultados proporcionaron información útil para explorar más a fondo el papel fisiológico de OPO en el colon y aportaron nuevas ideas para su aplicación.
ABBREVIATIONS OPO: 1,3-Dioleoyl-2-palmitoylglycerol; PA: palmitic acid; OA: oleic acid; HMF: human milk fat; OPO-A: only standard OPO alone supplemented in basal microbiota culture medium; OPO-P: OPO-enriched plant-oil formula(a nutritional supplement of infant and toddler formulas in China) supplemented in basal microbiota culture medium; Control: no OPO added in the basal microbiota culture medium; ORI: original fecal microbiota; OTUs: operational taxonomic units; GC-MS: gas chromatography-mass spectrometry; HPLC: high-performance liquid chromatography.
1. Introduction
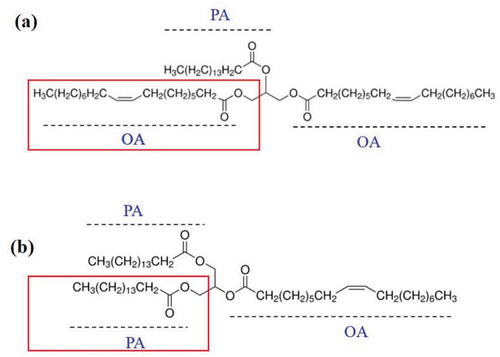
1,3-Dioleoyl-2-palmitoylglycerol (OPO), a structured triacylglycerol component that is generally present in human milk fat (HMF), is always used as an important nutritional supplement in infant and toddler formulas (Lee, Son, Akoh, Kim, & Lee, Citation2010; Yang, Xu, He, & Li, Citation2003). In China, it is generally added to commercial infant and toddlers formulas in the form of OPO-enriched plant-oil formula(OPO-P). Palmitic acid (PA) and oleic acid (OA) are the two fatty acids present in OPO. PA is located at the sn-2 position, whereas the sn-1,3 positions are mainly occupied by OA in OPO (), which is different with the typical structure of the triacylglycerol 1,3-palmitoylglycerol-2-dioleoyl (POP) (), a typical component of milk fat and other vegetable oils (Robles et al., Citation2011). There is increasing evidence that OPO intake has many beneficial health effects (Guncheva, Zhiryakova, Radchenkova, & Kambourova, Citation2008; Mu, Citation2010). Many clinical studies and investigations have shown that OPO is beneficial to the absorption of lipids and energy and the reduction of fecal calcium loss, as well as improvement of constipation, abdominal pain and intestinal obstruction for infants and toddlers (Jiménez et al., Citation2010; Li et al., Citation2010). Furthermore, it is well documented that OPO enhances bone strength and improves the maturity of the intestines and stomach (Sun, Wei, Su, Zou, & Wang, Citation2018). However, the exact mechanisms underlying the health benefits of dietary OPO are not fully defined. Despite this, there has been growing interest in the development of OPO supplementation in infant and toddler formulas to meet human dietary demands, especially for infants.
Figure 1. The structures of 1,3-dioleoyl-2-palmitoylglycerol (OPO) (a) and 1,3-palmitoylglycerol-2-dioleoyl (POP) (b) the different structure between OPO and POP was marked with red text box.
Figura 1. Estructuras de 1,3-dioleoil-2-palmitoilglicerol (OPO) (a) y 1,3-palmitoilglicerol-2-dioleoil (POP) (b). La estructura diferente entre OPO y POP se indicó con un cuadro de texto rojo.
Studies of the intestinal microbiota have received increasing attention around the world in the last decade due to its crucial role in human health (Clemente, Ursell, Parfrey, & Knight, Citation2012; Conlon et al., Citation2014; Li, Wang, Wang, Hu, & Chen, Citation2016; Schippa et al., Citation2014; Sonnenburg et al., Citation2016; Vernocchi, Del Chierico, & Putignani, Citation2016; Yang et al., Citation2018). In general, the intestinal microbiota plays an important role in the immune system, metabolic responses, and human health, although the mechanisms of action are still not fully understood (Choque Delgado & Tamashiro, Citation2018; Nash et al., Citation2018; Ventura, O’Toole, De Vos, & Van Sinderen, Citation2018). Growing evidence has indicated that the composition and richness of the intestinal microbiota are related to metabolic syndromes in humans, such as obesity, diabetes, cardiovascular diseases, and insulin resistance (Clemente et al., Citation2012). It is widely accepted that intestinal microbial communities are regulated by many factors, and dietary ingredients are considered among the most pivotal factors that regulate the composition and metabolic activity of the intestinal microbiota, which in turn influences human health. Many previous studies have described the influence of dietary bioactive compounds (e.g., phenolics, flavonoids, oligosaccharides and polysaccharides) on the composition and metabolism of the intestinal microbiota (Choque Delgado & Tamashiro, Citation2018; Ma et al., Citation2017; Nash et al., Citation2018; Yang, Citation2018). For example, Ma et al. (Citation2017) have reported that Pleurotus eryngii polysaccharides have a positive role in gastrointestinal tract health. They found that a Pleurotus eryngii polysaccharide-treated group enhanced short-chain fatty acid (SCFA) content, as well as increased the abundances of Porphyromonadaceae, Rikenellaceae, Bacteroidaceae and Lactobacillaceae at the family level (Ma et al., Citation2017). The impact of polyphenols from black tea and red wine/grape juice on the gut microbiota was studied using SHIME (Simulator of the human intestinal microbial ecosystem) by Kemperman et al. (Citation2013), who found that black tea and red wine grape polyphenol extracts could modulate selected members of the human gut microbiota. Additionally, Kemperman et al. (Citation2013) found that black tea and red wine grape polyphenol extracts promoted the growth of Klebsiella, Alistipes, Cloacibacillus, Victivallis and Akkermansia but inhibited the growth of Bifidobacterium, B. coccoides, Anaeroglobus, Subdoligranulum and Bacteroides. He and Giusti (Citation2010) reported that anthocyanins modulate the intestinal microbiota and, thus, exert protective effects against chronic gut disorders, such as colon cancer and inflammatory bowel disease.
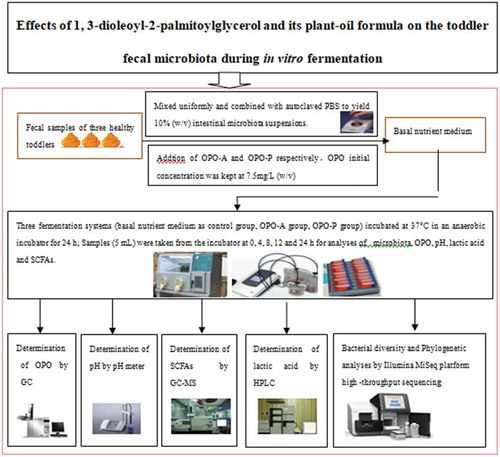
It is now widely accepted that the health benefits of dietary ingredients are largely related to changes in the composition of the intestinal microbiota and the production of bacteria-derived metabolites (Choque Delgado & Tamashiro, Citation2018; Conlon & Bird, Citation2014; Nash et al., Citation2018; Tomás-Barberán, Selma, & Espín, Citation2016). OPO is an expensive nutrient fortifier in China; as an important triacylglycerol,most of its digestion takes place in the upper digestive tract and absorption takes place in the small intestine, so its interaction with intestinal microorganisms is often overlooked. Therefore, to the best of our knowledge, no information is available regarding the effects of OPO on the composition and metabolic activity of the infant and toddler fecal microbiota. Therefore, the aim of this study was to conduct in vitro batch fermentation experiments of OPO with toddler fecal microbiota samples to evaluate the effects of OPO on microbial composition and diversity by high-throughput sequencing analysis. Changes in the fecal microbiota fermentation process(0, 4, 8, 12 and 24 h)were assessed by using a 16S rRNA gene sequencing amplification technique. Furthermore, the effects of OPO-A and OPO-P on the production of SCFAs and lactic acid by the fecal microbiota were also investigated. Additionally, the behavior of the fecal microbiota during fermentation, including changes in the OPO concentration and pH during the fermentation process, were evaluated. A schematic diagram of this research study is shown . The results obtained will provide new insights into the effects of OPO-A and OPO-P on the toddler fecal microbiota, provide scientific basis for development of OPO sustained release microcapsules which could be digested and used directly in the large intestine.
Figure 2. Schematic diagram of the research study.
Figura 2. Diagrama esquemático del estudio de investigación.
2. Materials and methods
2.1. Materials
OPO standard (purity: 99.9%) which came from palm oil was purchased from Larodan AB Co. (Solna, Sweden) and stored in a sealed polyethylene reagent bottle in a freezer at −20°C until further use. OPO-P is a kind of nutrient fortifier commodity in China. It’s a mixture commodity which also came from palm oil was provided by a commercial company in China. OPO is usually supplemented into commercial infant and toddler formulas in the form of OPO-enriched plant-oil formula (OPO-P) to enhance their nutritional value. It contained 50% refined vegetable oil (palm oil consisting of 40% OPO), 4.2% protein, 41.6% lactose, 3.7% water, 0.5% stabilizer, emulsifier, minerals, vitamins and other components. It is a structured lipid obtained from palm oil through a process of enzymatic esterification. Triheptadecanoin (purity: 99.9%), 2-methylpentanoic acid (purity: 99.0%), acetic acid (purity: 99.9%), propionic acid (purity: 99.5%), i-butyric acid (purity: 99.9%), n-butyric acid (purity: 99.9%), i-valeric acid (purity: 99.0%), n-valeric acid (purity: 99.5%), and lactic acid (purity: 99.9%) were purchased from Sigma-Aldrich Co. (St. Louis, MO, USA). Ammonium hydroxide (25%), anhydrous ethanol, anhydrous diethyl ether, petroleum ether (boiling range: 30°C to 60°C), methoxypyridine, bile salts, hexane, pyridine and anhydrous sodium sulfate were of analytical purity and were purchased from Sinopharm Chemical Reagent Co., Ltd. (Shanghai, China). All solvents used for chromatographic purposes were gas chromatography (GC) grade. Agarose 75510–019 (Invitrogen, USA), ethidium bromide (EB; EX328-5Ml), Q5 high-fidelity DNA polymerase, 5× reaction buffer, 5× high GC buffer, dNTPs (10 mM), the MoBio PowerSoil® DNA Isolation Kit (12888), and the Axygen AxyPrep DNA Gel Extraction Kit (AP-GX-500) were purchased from Sangon Biotech Company (Shanghai, China).
2.2. Preparation of the fecal microbiota
Preparation of the fecal microbiota was carried out according to the method of Zhang et al. (Citation2013) with some modifications. Briefly, fecal samples were obtained from three healthy volunteers (one female baby and two male babies, ages 2–2.5 years old) without antibiotic treatment, breastfeeding, and gastrointestinal disorders over the preceding 6-month period. Fecal samples with the same weights from each of the three toddlers were mixed uniformly and then combined with autoclaved phosphate-buffered saline (PBS, 0.1 M, pH 7.0, which was placed on the aseptic anaerobic operating platform before use, and continuously filled it with nitrogen and hydrogen to keep anaerobic.) to yield a 10% (w/v) suspension. The suspension was filtered with an autoclaved gauze filter, and the filtrate was stored until use.
2.3. In vitro fermentation of OPO
The effects of OPO on the toddler fecal microbiota were investigated by in vitro fermentation according to the method of Li et al. (Citation2015) and Liu, Gibson, and Walton (Citation2016) with some modifications. According to GB 14880–2012 of the China National Food Safety Standards – Food Nutrition Supplement Use Standard, OPO was added at concentrations of 24–96 g/kg to infant and toddler formula powder; the liquid formula for infants or toddlers was prepared at the following dilution ratio: 4.5 g of powder/30 mL of water. In this study, a middle dose of 50 g/kg multiplied by the formula powder dilution ratio was used, and then the initial concentration of OPO was maintained at 7.5 mg/mL (w/v) in the fermented liquid. OPO-A and OPO-P were mixed with autoclaved basal nutrient medium to give an OPO concentration of 7.5 mg/mL (w/v) in a YQX-1 anaerobic incubator (Yuejin Medical Optical Instruments Factory, Shanghai, China). The mixture fermentation systems were named OPO-A and OPO-P, respectively. Basal nutrient medium (pH 7.0), which contained 2 g/L peptone, 2 g/L yeast extract, 0.1 g/L NaCl, 0.04 g/L KH2PO4, 0.04 g/L K2HPO4, 0.01 g/L MgSO4 · 7H2O, 0.01 g/L CaCl2 · 6H2O, 2 g/L NaHCO3, 0.02 g/L hemin, 0.5 g/L cysteine HCl, 0.5 g/L bile salts, 1 mg/L resazurin, 2 mL/L Tween 80, 10 μL/L vitamin K1 and distilled water, was used as a control. Fermentation was initiated by adding 5 mL of fecal filtrate to 45 mL of culture medium containing OPO in a Serum bottles with rubber stoppers, followed by incubation at 37°C in an anaerobic incubator. The control consisted of basal nutrient culture medium without any other additive and was incubated under the same conditions. Samples were taken from the incubator at 0, 4, 8, 12 and 24 h for bacterial enumeration and analyses of OPO and pH in the fermentation systems. All experiments were repeated three times.
2.4. Determination of OPO by gas chromatography (GC)
OPO was analyzed with an Agilent 6890 series GC system consisting of a GC with a hydrogen flame ionization detector (FID) (Agilent Technologies, Waldbronn, Germany). Each OPO sample was taken from cryopreservation into room temperature. Then, 20–200 μg of OPO was mixed with 100 μL of the internal standard solution (triheptadecanoin) and 1 mL of ammonia:water (2:8). The mixture was then placed in a 65 ± 1°C water bath for 15 min before cooling to room temperature. Subsequently, 1 mL of ethyl alcohol, 2.5 mL of diethyl ether and 2.5 mL of petroleum ether were added, and the mixture was vortexed for 3 min and centrifuged at 7000 rpm for 5 min. The supernatant was set aside. Then, 2.5 mL of diethyl ether and 2.5 mL of petroleum ether were added to the substratum, and the mixture was vortexed for 3 min and centrifuged at 7000 rpm for 5 min. The supernatants were merged, and this process was repeated once. The chromatographic conditions were as follows: DB-1HT quartz capillary column: 15 m × 0.25 mm, 0.1 μm; carrier gas: high-purity He (purity > 99.999%); carrier gas flow rate: 1.0 mL/min; injection port temperature: 320°C; flow rate: 20:1; and column and box temperature: 200°C for 1 min, increased at 30°C/min to 370°C, and maintained for 10 min. The detector temperature was 370°C. The hydrogen flow rate was 47 mL/min. The air flow rate was 400 mL/min. The tail gas (nitrogen) velocity was 30 mL/min. The sample quantity was 1.0 μL.
2.5. Determination of pH value
The pH was analyzed using a FE20-FiveEasy PlusTM pH meter (METTLER TOLEDO). The pH meter probe was inserted into the fermented liquid and suspensions of babies’ feces.
2.6. Determination of SCFAs and lactic acid
Analysis of SCFAs, including acetic, propionic, n-butyric, i-butyric, n-valeric and i-valeric acids, in the control, OPO-A and OPO-P fermentation systems was performed by gas chromatography-mass spectrometry (GC-MS). Briefly, 400 μL of fermented sample solution was mixed with 1.2 mL of deionized water. Next, some small steel balls were added into the mixture, and ultrasonication was carried out for 5 min in an ice water bath before the mixture was ground (45 Hz) for 4 min. The extract was then centrifuged at 5000 rpm for 20 min (at 4°C) before the supernatant was collected. Then, 0.6 mL of the collected supernatant was vortexed with 0.15 mL of H2SO4 (50%, v/v) and 0.8 mL of 50 μg/mL 2-methylpentanoic acid solution (internal standard, dissolved in ether) followed by centrifugation at 12000 rpm for 10 min at 4°C. The supernatant was used for the determination of SCFAs with a GC-MS system. An Agilent GC system (7890, Palo Alto, CA, USA) equipped with an HP-INNOWax column (30 m × 250 μm × 0.25 μm) and a FID was used. One microliter of the test solution was injected into the GC system. Injection was made in split mode, and the split ratio was 5:1; helium (He) was used as the carrier gas. The front inlet purge flow rate was 3 mL/min, while the column flow rate was 1 mL/min. The column temperature program was set as follows: initial temperature started at 100°C and maintained for 1 min, followed by an increase to 150°C at a rate of 5°C per min, then ramped to 250°C at a rate of 50°C per min and maintained for 5 min. The solvent delay was set at 3 min. The detector was operated in electron impact ionization mode, which used an ionization voltage of −70 eV and scanned in the 20–400 m/z range. The temperatures of the quadrupole analyzer, ion source, interface, and transmission line were 150°C, 230°C, 270°C and 260°C, respectively. SCFAs were identified via comparison with the retention times of pure standard compounds under the same conditions. The concentration of lactic acid was determined by HPLC according to the method of Li et al. (Citation2015). Sample solution was centrifuged for 5 min at 10,000 g, then 20μL supernatant was injected onto the HPLC system (Agilent 1100 series with DAD) for analysis. Detection was set at 210 nm and the column oven temperature was set at 25℃. The mobile phase consisted of H3PO4 solution adjusted to pH 2.5 with 20 nM KH2PO4 solution (A) and methanol (B). Elution was performed with the linear gradient as follows: A 95%, B 5%, 0–16 min; A from 95% to 70%, B from 5% to 30%,16–30 min; A70%,B 30%,30–40 min. The flow rate was 0.8mL/min. Quantification of the samples was carried out using calibration curves of lactic acids in concentrations between 0.5 – 100mM.
2.7. Analysis of the fecal microbiota
2.7.1. DNA extraction, polymerase chain reaction (PCR) amplification, and sequencing
Total genomic DNA was extracted using a MoBio PowerSoil® DNA Isolation Kit (12888) after the fermentation samples were centrifuged at 4°C. The microbial compositions of the three studied fermentation systems containing added OPO-A, OPO-P or no addition were recorded as OPO-A, OPO-P and control, respectively. The original microbial composition before fermentation was also studied and recorded as ORI. The molecular size of the genomic DNA was estimated by 0.8% agarose gel electrophoresis, and its concentration was quantified with an ultraviolet spectrophotometer (RS232G, Eppendorf, Germany). All DNA samples were stored at −20°C before analysis. An approximately 280-bp fragment of the bacterial 16S rRNA genes with highly variable V4 was selected for sequencing. PCR was performed using a MyCycler thermal cycler (Bio-Rad). The PCR primers were as follows: forward primer: AYTGGGYDTAAAGNG; reverse primer: TACNVGGGTATCTAATCC. The PCR amplification system contained 0.25 μL of Q5 high-fidelity DNA polymerase, 5 μL of 5* reaction buffer, 5 μL of 5* high GC buffer, 5 μL of 10-mM dNTPs, 1 μL of template DNA, 1 μL of forward primer, 1 μL of reverse primer, and 11.25 μL of ddH2O. The PCR procedure was as follows: initial denaturation: 98°C for 30 s; circulation: 27 times; denaturation: 98°C for 15 s; primer annealing: 50°C for 30 s; extension: 72°C for 30 s; and extension: 72°C for 10 min. The DNA of the PCR product was subjected to 2% agarose gel electrophoresis, and the band of the correct fragment was cut out and recycled by using an Axygen gel kit. The PCR recycling product was quantified using a Quant-iT PicoGreen dsDNA Assay Kit in a microplate reader (BioTek, FLx800, Vermont, USA). Genomic library construction was completed using a TruSeq Nano DNA LT Library Prep Kit from Illumina (Magoč & Salzberg, Citation2011). Paired-end sequencing of 2 × 300 bp was performed using a MiSeq Reagent Kit V3 (600 cycles) in an Illumina MiSeq apparatus (Illumina, USA).
2.7.2. Sequence alignment and operational taxonomic unit (OTU) clustering
Quantitative Insights into Microbial Ecology (QIIME) software was used for high-throughput sequencing analysis. The Greengenes database (Release 13.8, http://greengenes.secondgenome.com/) and the UCLUST sequence alignment tool were used for sequence alignment, OTU clustering and diversity analyses with a sequence similarity of 97%. Sequencing was cut off at an abundance value of less than 0.01% of the total sequencing of all OTU samples (Bokulich et al., Citation2013; DeSantis et al., Citation2006; Edgar, Citation2010). OTU diversity was further examined via rarefaction analysis.
2.8. Statistical analysis
The experiments in this study were carried out in triplicate. The results of the triplicate analysis are presented as the mean ± standard deviation (SD). One-way analysis of variance (ANOVA) with Tukey’s test for multiple comparisons was conducted to analyze the significant difference among different treated groups. A p value of < 0.05 was considered statistically significant difference. The obtained results were analyzed and processed by using SPSS version 21.0 (SPSS Inc., Chicago, IL, USA).
Richness and diversity indexes, including the Simpson index (Simpson, Citation1949), the bias-corrected (Chao, Citation1984)1 index (Chao et al., Citation2004), the abundance-based coverage estimator (ACE) (Chao et al., Citation1993), and the Shannon-Weaver diversity index (Shannon, Citation1948a, Citation1948b; Shannon, et al., Citation2003), were calculated using QIIME and Mothur. To describe the similarity of the bacterial communities, LibShuff(in MOTHUR) analysis was employed to compare the OTU composition of each clone library. The unweighted and weighted UniFrac distance matrixes of the unweighted pair-group method with arithmetic means (UPGMA) was clustered by using QIIME software, and R software and the GraPhlAn tool were used for visualization.
3. Results
3.1. Changes in OPO content during the fermentation process
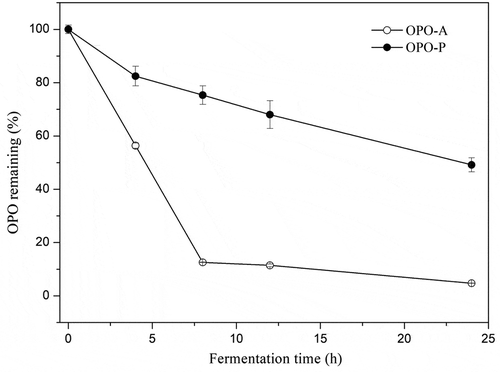
GC analysis was employed to determine the changes in OPO content in the OPO-A and OPO-P fermentation systems during the fermentation process; the results are shown in . OPO content significantly decreased with fermentation time increased both in the OPO-A and OPO-P fermentation systems, as shown in . This result indicated that OPO could be efficiently utilized by the toddlers fecal microbiota. Furthermore, OPO content in the OPO-A fermented liquid system decreased more rapidly relative to the OPO-P system. The decline rate of OPO decline was10.93% per hour in OPO-A group during the first 8 h of fermentation, which whereas the decline rate of OPO is only 3.08% in OPO-P group is only 3.08% per hour.
Figure 3. Percentage of OPO remaining in the fermentation systems containing OPO-A or OPO-P at different fermentation time points.
Figura 3. Porcentaje de OPO restante en los sistemas de fermentación que contienen OPO-A u OPO-P en diferentes momentos de la fermentación.
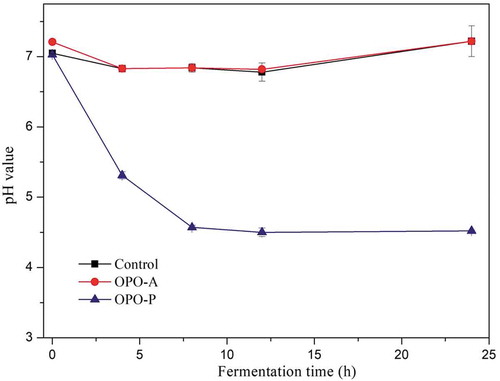
3.2. Changes in pH during the fermentation process
Change in pH is one of the indicators of the fermentation process, and pH may influence the growth of microorganisms. Changes in pH during the fermentation process are shown in . The pH values in the control and OPO-A fermentation systems decreased insignificantly, and both were maintained at approximately 7.0. However, for the OPO-P fermentation system, a decrease in pH during the fermentation process was observed. The pH decline rate was more pronounced during the first 8 h of intestinal fermentation and then slowed down during the later period of fermentation.
Figure 4. Changes in pH in the fermentation systems containing OPO-A or OPO-P or with no addition (Control) at different fermentation time points.
Figura 4. Cambios en el pH en los sistemas de fermentación que contienen OPO-A u OPO-P o sin adición (control) en diferentes momentos de la fermentación.
3.3. Effects of OPO on the production of SCFAs and lactic acid
The concentrations of SCFAs, including acetic, propionic, n-butyric, i-butyric, n-valeric and i-valeric acid, before and after fermentation were determined to estimate the potential effect of OPO-A and OPO-P on the fecal microecology; the results are shown in . Acetic acid was the predominant fermentation product in the control, OPO-A and OPO-P groups. Whereas n-butyric, i-butyric, n-valeric and i-valeric acids were maintained at low levels in all three groups. In addition, as shown in , OPO supplementation significantly enhanced the production of acetic acid at most of given fermentation time point, and this enhancement effect was more pronounced with OPO-P. Furthermore, total SCFAs were significantly increased after the addition of OPO (OPO-A and OPO-P groups) at most of fermentation time point () when compared with the concentration in the control group. Additionally, it can be seen from that the total SCFA concentrations in the Control and OPO-A groups rapidly increased to their maximum value at 8 h respectively. However, the total SCFAs in the OPO-P group continually increased from 0 to 24 h.
Table 1. The concentrations (μg/mL) of SCFAs and lactic acid in different fermentation solutions (control, OPO-A and OPO-P groups) at different fermentation time points.
Tabla 1. Concentraciones (μg/mL) de SCFA y ácido láctico en diferentes soluciones de fermentación (control, grupos OPO-A y OPO-P) en diferentes momentos de la fermentación.
The concentration of lactic acid after fermentation was determined to estimate the potential effect of OPO on the fecal microecology; the results are shown in . The concentration of lactic acid in the OPO-A group was higher than that in the control group at 4 h. Additionally, only a small amount of lactic acid was present after fermentation from 8 h to 24 h in the control and OPO-A groups, and there were no significant differences between the two groups. Furthermore, a much higher amount of lactic acid was produced in the OPO-P group than in the control and OPO-A groups at any fermentation time point.
3.4. Effects of OPO on the richness and diversity of the fecal microbiota
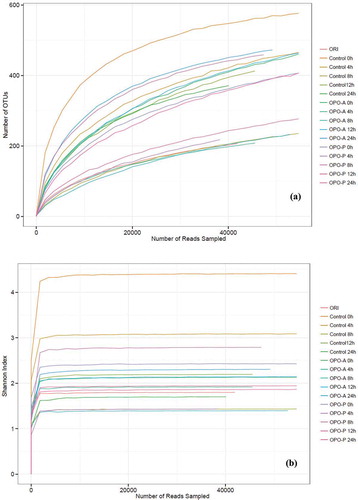
Differences in intestinal microbial composition and diversity play important roles in the physiological functions in humans. The experiment consisted of 48 samples in total (16 groups, n = 3 for each group). In light of the high-throughput sequencing analysis, after the original reads were filtered and clustered with 97% similarity, an average of 63675 reads per sample was obtained. ,) show the results for the refraction and Shannon index curves, respectively. Although the refractive curve continued to increase as the depth of sequencing increased, the Shannon index reached a stable level and was stable for all samples (,)). The results indicated that data size was sufficient to reflect most of the biometric information in each sample. Therefore, the results of the data were valid.
Figure 5. Rarefaction index curves (a) and Shannon index curves (b) of all studied samples.
Figura 5. Curvas de índice de rarefacción (a) y curvas de índice de Shannon (b) de todas las muestras estudiadas.
The complexity of the species diversity of the studied samples was analyzed by calculating α-diversity indexes, as shown in . The Shannon and Simpson indexes of the OPO-A and OPO-P groups were much higher than indexes of the control group fermentation process, except for 4 h in OPO-A group, indicating that OPO-A and OPO-P addition enhanced fecal microbiota community diversity. In addition, the Chao 1 and ACE indexes in the OPO-A fermentation system (4–24 h) were much higher than in the control group, indicating that OPO-A addition also enhanced fecal microbiota community richness.
Table 2. Richness and α-diversity of each studied sample.
Tabla 2. Riqueza y diversidad α de cada muestra estudiada.
3.5. Effects of OPO on fecal microbiota composition
Analysis of total bacterial sequences indicated that Actinobacteria, Proteobacteria, Firmicutes and Bacteroidetes were the abundant bacterial phyla in the original toddlers feces, as well as in the control, OPO-A and OPO-P fermented liquid systems, as shown in , and . More than 99.50% of the microbial community was mainly distributed in 39 genera of Actinobacteria, Firmicutes, Proteobacteria, Bacteroidetes and Verrucomicrobia. The Actinobacteria in all samples merely consisted of Bifidobacterium, whereas Proteobacteria included Enterobacter, Sutterella, Citrobacter and five other types of bacteria (i.e., Burkholderia, Bilophila, Burkholderiales, Proteus, and Haemophilus). Firmicutes included Streptococcus, Lachnospiraceae and 24 other types of bacteria. Bacteroidetes included Bacteroides, Rikenellaceae and Prevotella.
Table 3. Comparison (%) of bacterial clone libraries at the phylum and genus levels for the control, OPO-A and OPO-P fermentation systems at different fermentation time points.
Tabla 3. Comparación (%) de bibliotecas de clones bacterianos a nivel de phylum y género para el control y los sistemas de fermentación OPO-A y OPO-P en diferentes momentos de la fermentación.
Figure 6. Intestinal microbiota composition at the phylum level of the control, OPO-A and OPO-P fermentation systems at different fermentation time points.
Figura 6. Composición de microbiota intestinal a nivel de phylum del control, de sistemas de fermentación OPO-A y OPO-P en diferentes momentos de la fermentación.
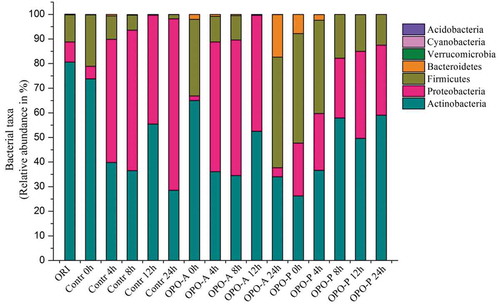
Additionally, at the genus level, Bifidobacterium was the most predominant genus in the control and OPO-A groups at beginning of fermentation (). The abundance of Bifidobacterium in both groups decreased sharp after 24 h of fermentation. However, for the OPO-P group, Streptococcus was the most predominant genus and Bifidobacterium was the second predominant genus at the beginning of fermentation, and the abundance of Bifidobacterium increased and the abundance of Streptococcus decreased obviously after 24 h of fermentation. During the entire fermentation process (24 h), the reduction proportion of the abundance of Bifidobacterium in OPO-A group was 31.00%, which is obviously lower than that of the control group (45.28%). However, in the OPO-P group, the abundance of Bifidobacterium increased by 32.79% during the entire process. These results suggest that OPO-A and OPO-P increased the abundance of Bifidobacterium compared with Control group.
Proteobacteria was another dominant bacterial community in the control, OPO-A and OPO-P fermentation systems (). At the genus level, Enterobacter were the most abundant bacteria among the Proteobacteria during the fermentation process. The abundance of Enterobacter was only 0.21% in the original toddlers feces, but this abundance rapidly grew during the fermentation process and became another dominant bacterial community in the Control, OPO-A and OPO-P groups. In addition, it was found that the addition of OPO-A or OPO-P had a significant effect on the abundance of Enterobacter during the fermentation process. After 24 h of fermentation, the abundance of Enterobacter in the OPO-A and OPO-P groups was 1.52% and 28.32%, respectively, which was much lower than the abundance in the control group (67.27%).
Streptococcus and Lachnospiraceae were the most abundant bacteria in Firmicutes. As shown in , the abundance of Streptococcus in the control, OPO-A and OPO-P groups increased obviously during the early fermentation stages and then decreased during the later period of fermentation (12–24 h). The abundance of Streptococcus in the OPO-A group was higher than that in the control group, but the abundance in both of these groups was much lower than that in the OPO-P group (). The abundance of Lachnospiraceae significantly decreased after 12 h of fermentation in all three groups. However, the abundance of Lachnospiraceae in the OPO-P group was much lower than that in the control and OPO-A groups.
4. Discussion
OPO has been shown to exert many attractive benefits effect on human health, and it is widely supplemented as a nutritional ingredient in infant milk powders. However, no information has been reported regarding the effects of OPO on the composition and metabolic activity of the fecal microbiota. The present work found that OPO-A and OPO-P could be effectively utilized by the fecal microbiota and OPO was metabolized more slowly in the OPO-P group than OPO-A group. This phenomenon was consistent with the results of previous animal experiments (Zou, Jin, Guo, Xu, & Wang, Citation2016). shows that the change in pH was greater for OPO-P when OPO in OPO-A appeared to be utilized more fast than that in OPO-P, the observed results might be attributed to the presence of other nutrients, especially lactose, in the OPO-P group for the fecal microbiota to utilize for growth. However, in OPO-A group, no more carbon sources could be consumed by fecal microbiota other than OPO. It was consistent with the previous article that lactose supports the growth of intestinal microbes(Oliveira et al., Citation2015). Thus, lactose was used by fecal microbiota, and it produced large amounts of Lactic acid resulting in a sharp decrease in pH in the OPO-P group.
SCFAs are metabolite products of the intestinal microbiota that are present in the large intestine (Chen et al., Citation2018). It has been reported that the amount and relative abundance of SCFAs are strongly associated with human health status (Tan et al., Citation2014). Previous studies have demonstrated the important role of SCFAs in improving chronic inflammatory diseases, reducing inflammation levels, stimulating gastrointestinal motility, and protecting the intestinal mucosal barrier (Kasubuchi, Hasegawa, Hiramatsu, Ichimura, & Kimura, Citation2015; Richards, Yap, McLeod, Mackay, & Mariño, Citation2016; Xie et al., Citation2017). In addition, early studies showed that SCFAs (for example, acetic acid) could be utilized as sources of energy and nutrients by epithelial intestinal cells. (Schwiertz et al., Citation2010). Ríos-Covián et al. (Citation2016) reported that acetic acid is a key factor in inhibiting enteropathogens. The present work demonstrated that total SFCA and acetic acid contents, were increased after OPO supplementation during the fermentation process (). It suggested that OPO could be metabolized by the fecal microbiota and then contributed to the improved production of SCFAs. The total SFCA and acetic acid contents only in the OPO-P group continually increased during the fermentation process, yet the other two groups showed a parabolic trend. These results indicated that SCFAs were stared to consume by microorganisms during the later period of fermentation, when most of the nutrients in Control and OPO-A groups had already been consumed by the fecal microbiota (12–24 h). However, the OPO-P group contained other nutrients, such as lactose and proteins, which could be utilized as energy sources by the fecal microbiota for the production of SCFAs.
According to the results obtained in this study, the addition of OPO-P significantly improved the production of lactic acid by fecal microorganisms during the whole fermentation process, the addition of OPO-A improved the production of lactic acid only at the beginning of 4 h fermentation. (). Lactic acid is one of the major metabolites of Bifidobacterium and Lactobacillus (Chen et al., Citation2018). At the same time,the abundance of Bifidobacterium in the OPO-P group significantly increased during the entire process; specifically, it increased to 32.79% after 24 h of fermentation. At 4 h of fermentation, the reduction proportion of the abundance of Bifidobacterium in OPO-A group was 28.85%, which was Slightly lower than that of the control group (34.13%). These results imply that OPO supplementation is beneficial for the growth of Bifidobacterium, and it is beneficial for Bifidobacterium to be the dominant community. It is consistent with the clinical trial performed by Yao et al. (Citation2014) who demonstrated that administration of an infant formula enriched with OPO increased Bifidobacteria in a clinical trial in infants. In addition, previous studies demonstrated that lactic acid could play a useful role in the release of hormones, regulation of the activity of various enzymes, and control of the metabolic balance of the body (Brooks, Citation2009; Langevin, Crossan, Rosado, Arends, & Patel, Citation2011). The production of lactic acid is a beneficial indicator of the interaction between dietary factors and microorganisms to evaluate the probiotic effects of diets (Philp, Macdonald, & Watt, Citation2005; Vulevic, Rastall, & Gibson, Citation2004).
In addition, as depicted in , the production of lactic acid in the OPO-P group was much higher than that in the OPO-A and control groups due to the utilization of lactose in the OPO-P fermentation system by the fecal microbiota and its subsequent transfer to lactic acid. The accumulation of large amounts of lactic acid reduced the pH dramatically in OPO-P, which implied that a large number of acid-resistant bacteria that produced lactic acid were distributed in the OPO-P group. The decline in pH resulting from OPO-P supplementation may inhibit the proliferation of nondesirable and pathogenic microorganisms and could contribute to the proliferation of beneficial bacteria in the intestine. It has been shown that the proper reduction of pH values contributes to gastrointestinal health (Ma et al., Citation2017).
Interestingly, the present study found that SCFA and lactic acid contents increased during the early fermentation stage and then decreased during the later period of fermentation, both in the control and OPO-A groups (). This might be due to the accumulation of lactic acid and SCFAs in the fermentation system as metabolites during the early stage. However, SCFAs and lactic acid were consumed and utilized by microorganisms as carbon sources or energy sources due to the growth of intestinal microorganisms and insufficient nutrients in the culture medium during the later period of fermentation. The variations in lactic acid in the OPO-P group were consistent with those in the other two groups. However, the SFCA content in the OPO-P group increased at all fermentation time points. This phenomenon observed be ascribed to the preferential utilization of lactic acid by intestinal microorganisms relative to SCFAs; thus, sufficient amounts of SCFAs were continually accumulated in the OPO-P group throughout the entire fermentation period.
The Chao 1 index and ACE index were calculated to estimate the community richness in samples, and the community diversity in samples was estimated by the Shannon index and the Simpson index, which was also reported in previous investigations (Chen et al., Citation2018; Xie et al., Citation2017). As shown in , OPO enhanced the diversity of the intestinal microbiota. The diversity of the intestinal microbiota has been shown to be closely correlated to human health (Li et al., Citation2016; Xie et al., Citation2017). Le Chatelier et al. (Citation2013) stated that the intestinal microbial diversities of lean individuals were greater than those of obese individuals (Le Chatelier et al., Citation2013). Thus, the results of this study implied that OPO might exert effect by regulating the fecal microbiota to individuals.
Previous work demonstrated that carbohydrates (such as polysaccharides, fructooligosaccharides and galactooligosaccharides) and phenolic compounds promote the growth of Bifidobacterium (Danneskiold-Samsøe et al., Citation2018). In this study, we found that OPO-P was beneficial for the growth of Bifidobacterium, and this effect was insignificant
with OPO-A. The larger Bifidobacterium-promoting effect of OPO-P observed above was partially due to the presence of lactose in OPO-P. Additionally, OPO and lactose might be able to act synergistically or additively to promote the proliferation of Bifidobacterium, which should also be considered. Lactic acid and acetic acid were the major metabolites of Bifidobacterium reported in previous studies (Danneskiold-Samsøe et al., Citation2018). It is well known that Bifidobacterium are among the most important bacterial communities associated with human health (especially for infants) and provide health-stimulating effects in the large intestine (Griffiths et al., Citation2004; Holscher et al., Citation2012). For example, Bifidobacterium provides nutritional value for the production of vitamins and improves intestinal barrier function to reduce endotoxins in the intestine as well (Sjögren et al., Citation2009; Wang et al., Citation2006). Its health-stimulating mechanisms involve several actions, such as the production of beneficial metabolites, modulation of the immune response, adhesion to the gut epithelium, and enhancement of the intestinal barrier (Xie et al., Citation2017; Zhu et al., Citation2018). The health-stimulating effects of the nutrient fortifier OPO might partially depend on its ability to promote the proliferation of Bifidobacterium in the human intestine. These results are of great interest because this investigation is the first to report the ability of OPO to promote the growth of Bifidobacterium. Further investigation and evidence are indispensable to illustrate the mechanisms by which OPO addition positively promotes Bifidobacterium growth.
Many studies have shown that Proteobacteria is the largest bacterial phylum; however, many Proteobacteria, such as Escherichia coli, Salmonella, Vibrio cholerae and Helicobacter pylori, are pathogenic bacteria. These types of pathogenic bacteria have been shown to easily cause diarrhea in humans and animals (Morais & Jacob, Citation2006; Shin, Whon, & Bae, Citation2015; Sivieri, Bianchi, Tallarico, & Rossi, Citation2011). The present results demonstrated that OPO-A and OPO-P Reduced reduced the growth rate of Enterobacter. In addition, interestingly, the present work found that OPO-P supplementation could reduce the abundance of Lachnospiraceae. It is well documented that decreased levels of Lachnospiraceae are closely related to reductions in the risk of obesity in humans (Neyrinck, Schüppel, Lockett, Haller, & Delzenne, Citation2016).
5. Conclusions
The results obtained in the present study first demonstrated that OPO-A and OPO-P significantly modulated the composition and functional capacity of the toddlers fecal microbiota. This study reported that OPO-A and OPO-P could be utilized by the toddlers fecal microbiota and contributed to the production of SCFAs and lactic acid. The total SCFAs, especially acetic acid content, increased after OPO supplementation in most fermentation time point. These effects were more pronounced after the addition of OPO-P. Additionally, lower pH was present in the OPO-P fermentation system relative to the OPO-A and control groups during the studied fermentation process (24 h). Furthermore, During the entire fermentation process (24 h), the reduction proportion of the abundance of Bifidobacterium in OPO-A group was 31.00%, which is obviously lower than that of the control group (45.28%). However, in the OPO-P group, the abundance of Bifidobacterium increased by 32.79% during the entire process. In addition, OPO addition enhanced bacterial diversity.Thus, the present results demonstrated that OPO-A and OPO-P exerted a positive, pivotal effect on the toddlers fecal microbiota, which might provide scientific basis for development of OPO sustained release microcapsules which could be digested and used directly in the large intestine. Our further research objective is to determine interactions between OPO and the fecal microbiota, to develop appropriate OPO sustained release microcapsules products. How much OPO could escape from absorption and could reach the colon when administered with infant formula and modulate microbiota, to which extent the use of sustained release microcapsules could help in this objective would also be determined in the future.
Author contributions
Each author has made a substantial contribution to the conception of the work or has drafted the work or substantively revised it. A.H. and Z.L. conceived the study; Y.X. and A.H. analyzed the literature; A.H. wrote the original draft; Y.X. and Z.L. reviewed the original draft; and Y.X. and A.H. edited the final draft. All authors had primary responsibility for the final content and approved the final manuscript.
Acknowledgments
The authors would like to thank the staff of Shanghai Personal Biotechnology Co., Ltd. for their valuable assistance with the high-throughput sequencing analysis.
Disclosure statement
There are no conflicts of interest to declare.
Additional information
Funding
References
- Bokulich, N. A., Subramanian, S., Faith, J. J., Gevers, D., Gordon, J. I., Knight, R., … Caporaso, J. G. (2013). Quality-filtering vastly improves diversity estimates from Illumina amplicon sequencing. Nature Methods, 10, 57–59. doi:10.1038/nmeth.2276
- Brooks, G. A. (2009). Cell-cell and intracellular lactate shuttles. Journal of Physiology, 587, 5591–5600. doi:10.1113/jphysiol.2009.178350
- Chao, A. (1984). Nonparametric estimation of the number of classes in a population. Scandinavian Station Theory Applied, 11, 265–270. doi:10.2307/4615964
- Chao, A., & Shen, T. J. (2004). Nonparametric prediction in species sampling. Journal of Agricultural, Biological, and Environmental Statistics, 9, 253–269. doi:10.1198/108571104X3262
- Chao, A., & Yang, M. C. K. (1993). Stopping rules and estimation for recapture debugging with unequal failure rates. Biometrika, 80, 193–201. doi:10.1093/biomet/80.1.193
- Chen, G., Xie, M., Wan, P., Chen, D., Ye, H., Chen, L., … Liu, Z. (2018). Digestion under saliva, simulated gastric and small intestinal conditions and fermentation in vitro by human intestinal microbiota of polysaccharides from Fuzhuan brick tea. Food Chemistry, 244, 331–339. doi:10.1016/j.foodchem.2017.10.074
- Choque Delgado, G. T. C., & Tamashiro, W. M. D. S. C. (2018). Role of prebiotics in regulation of microbiota and prevention of obesity. Food Research International, 113, 183–188. doi:10.1016/j.foodres.2018.07.013
- Clemente, J. C., Ursell, L. K., Parfrey, L. W., & Knight, R. (2012). The impact of the gut microbiota on human health: An integrative view. Cell, 148, 1258–1270. doi:10.1016/j.cell.2012.01.035
- Conlon, M. A., & Bird, A. R. (2014). The impact of diet and lifestyle on gut microbiota and human health. Nutrients, 7, 17–44. doi:10.3390/nu7010017
- Danneskiold-Samsøe, N. B., Dias de Freitas Queiroz Barros, H., Santos, R., Bicas, J. L., Cazarin, C. B. B., Madsen, L., … Maróstica Júnior, M. R. (2018). Interplay between food and gut microbiota in health and disease. Food Research International. doi:10.1016/j.foodres.2018.07.043
- DeSantis, T. Z., Hugenholtz, P., Larsen, N., Rojas, M., Brodie, E. L., Keller, K., … Andersen, G. L. (2006). Greengenes, a chimera-checked 16S rRNA gene database and workbench compatible with ARB. Applied and Environmental Microbiology, 72, 5069–5072. doi:10.1128/AEM.03006-05
- Edgar, R. C. (2010). Search and clustering orders of magnitude faster than BLAST. Bioinformatics, 26, 2460–2461. doi:10.1093/bioinformatics/btq461
- Griffiths, E. A., Duffy, L. C., Schanbacher, F. L., Qiao, H., Dryja, D., Leavens, A., … Ogra, P. L. (2004). In vivo effects of bifidobacteria and lactoferrin on gut endotoxin concentration and mucosal immunity in Balb/c mice. Digestive Diseases and Sciences, 49, 579–589. doi:10.1023/b:ddas.0000026302.92898.ae
- Guncheva, M., Zhiryakova, D., Radchenkova, N., & Kambourova, M. (2008). Acidolysis of tripalmitin with oleic acid catalyzed by a newly isolated thermostable lipase. Journal of the American Oil Chemists’ Society, 85, 129–132. doi:10.1007/s11746-007-1175-9
- He, J., & Giusti, M. M. (2010). Anthocyanins: Natural colorants with health-promoting properties. Annual Review of Food Science and Technology, 1, 163–187. doi:10.1146/annurev.food.080708.100754
- Holscher, H. D., Czerkies, L. A., Cekola, P., Litov, R., Benbow, M., Santema, S., … Tappenden, K. A. (2012). Bifidobacterium lactis Bb12 enhances intestinal antibody response in formula-fed infants: A randomized, double-blind, controlled trial. JPEN. Journal of Parenteral and Enteral Nutrition, 36, 106S–117S. doi:10.1177/0148607111430817
- Jiménez, M. J., Esteban, L., Robles, A., Hita, E., González, P. A., Muñío, M. M., & Molina, E. (2010). Production of triacylglycerols rich in palmitic acid at position 2 as intermediates for the synthesis of human milk fat substitutes by enzymatic acidolysis. Process Biochemistry, 45, 407–414. doi:10.1016/j.procbio.2009.10.018
- Kasubuchi, M., Hasegawa, S., Hiramatsu, T., Ichimura, A., & Kimura, I. (2015). Dietary gut microbial metabolites, short-chain fatty acids, and host metabolic regulation. Nutrients, 7, 2839–2849. doi:10.3390/nu7042839
- Kemperman, R. A., Gross, G., Mondot, S., Possemiers, S., Marzorati, M., van de Wiele, T., … Vaughan, E. E. (2013). Impact of polyphenols from black tea and red wine/grape juice on a gut model microbiome. Food Research International, 53, 659–669. doi:10.1016/j.foodres.2013.01.034
- Langevin, F., Crossan, G. P., Rosado, I. V., Arends, M. J., & Patel, K. J. (2011). Fancd2 counteracts the toxic effects of naturally produced aldehydes in mice. Nature, 475, 53–58. doi:10.1038/nature10192
- Le Chatelier, E., Nielsen, T., Qin, J., Prifti, E., Hildebrand, F., Falony, G., … Pedersen, O. (2013). Richness of human gut microbiome correlates with metabolic markers. Nature, 500, 541–546. doi:10.1038/nature12506
- Lee, J. H., Son, J. M., Akoh, C. C., Kim, M. R., & Lee, K. T. (2010). Optimized synthesis of 1,3-dioleoyl-2-palmitoylglycerol-rich triacylglycerol via interesterification catalyzed by a lipase from Thermomyces lanuginosus. New Biotechnology, 27, 38–45. doi:10.1016/j.nbt.2009.10.006
- Li, D., Wang, P., Wang, P., Hu, X., & Chen, F. (2016). The gut microbiota: A treasure for human health. Biotechnology Advances, 34, 1210–1224. doi:10.1016/j.biotechadv.2016.08.003
- Li, W., Wang, K., Sun, Y., Ye, H., Hu, B., & Zeng, X. (2015). Influencesc of structures of galactooligosaccharides and fructooligosaccharides on the fermentation in vitro by human intestinal microbiota. Journal of Functional Foods, 13, 158–168. doi:10.1016/j.jff.2014.12.044
- Li, Y., Mu, H., Andersen, J. E. T., Xu, X., Meyer, O., & Ørngreen, A. (2010). New human milk fat substitutes from butterfat to improve fat absorption. Food Research International, 43, 739–744. doi:10.1016/j.foodres.2009.11.006
- Liu, Y., Gibson, G. R., & Walton, G. E. (2016). An in vitro approach to study effects of prebiotics and probiotics on the faecal microbiota and selected immune parameters relevant to the elderly. PloS One, 11(9), e0162604. doi:10.1371/journal.pone.0162604
- Ma, G., Kimatu, B. M., Zhao, L., Yang, W., Pei, F., & Hu, Q. (2017). In vivo fermentation of a Pleurotus eryngii polysaccharide and its effects on fecal microbiota composition and immune response. Food and Function, 8, 1810–1821. doi:10.1039/c7fo00341b
- Magoč, T., & Salzberg, S. L. (2011). Flash: Fast length adjustment of short reads to improve genome assemblies. Bioinformatics, 27, 2957–2963. doi:10.1093/bioinformatics/btr507
- Morais, M. B., & Jacob, C. M. (2006). The role of probiotics and prebiotics in pediatric practice. Jornal De Pediatria, 82, S189–S197. doi:10.2223/JPED.1559
- Mu, H. (2010). Production and nutritional aspects of human milk fat substitutes. Lipid Technology, 22, 126–129. doi:10.1002/lite.201000025
- Nash, V., Ranadheera, C. S., Georgousopoulou, E. N., Mellor, D. D., Panagiotakos, D. B., McKune, A. J., … Naumovski, N. (2018). The effects of grape and red wine polyphenols on gut microbiota - A systematic review. Food Research International, 113, 277–287. doi:10.1016/j.foodres.2018.07.019
- Neyrinck, A. M., Schüppel, V. L., Lockett, T., Haller, D., & Delzenne, N. M. (2016). Microbiome and metabolic disorders related to obesity: Which lessons to learn from experimental models? Trends in Food Science and Technology, 57, 256–264. doi:10.1016/j.tifs.2016.08.012
- Oliveira, D. L., Wilbey, R. A., Grandison, A. S., & Roseiro, L. B. (2015). Milk oligosaccharides: A review. International Journal of Dairy Technology, 68(3), 305-321. doi:10.1111/1471-0307.12209
- Philp, A., Macdonald, A. L., & Watt, P. W. (2005). Lactate – A signal coordinating cell and systemic function. Journal of Experimental Biology, 208, 4561–4575. doi:10.1242/jeb.01961
- Richards, J. L., Yap, Y. A., McLeod, K. H., Mackay, C. R., & Mariño, E. (2016). Dietary metabolites and the gut microbiota: An alternative approach to control inflammatory and autoimmune diseases. Clinical and Translational Immunology, 5, e82. doi:10.1038/cti.2016.29
- Ríos-Covián, D., Ruas-Madiedo, P., Margolles, A., Gueimonde, M., De Los Reyes-Gavilán, C. G. D. L., & Salazar, N. (2016). Intestinal short chain fatty acids and their link with diet and human health. Frontiers in Microbiology, 7, 185. doi:10.3389/fmicb.2016.00185
- Robles, A., Jiménez, M. J., Esteban, L., González, P. A., Martín, L., Rodríguez, A., & Molina, E. (2011). Enzymatic production of human milk fat substitutes containing palmitic and docosahexaenoic acids at sn-2 position and oleic acid at sn-1,3 positions. LWT - Food Science and Technology, 44, 1986–1992. doi:10.1016/j.lwt.2011.05.022
- Schippa, S., & Conte, M. P. (2014). Dysbiotic events in gut microbiota: Impact on human health. Nutrients, 6, 5786–5805. doi:10.3390/nu6125786
- Schwiertz, A., Taras, D., Schäfer, K., Beijer, S., Bos, N. A., Donus, C., & Hardt, P. D. (2010). Microbiota and scfa in lean and overweight healthy subjects. Obesity, 18, 190–195. doi:10.1038/oby.2009.167
- Shannon, C. E. (1948a). A mathematical theory of communication. Bell System Technical Journal, 27, 379–423. doi:10.1002/j.1538-7305.1948.tb01338.x
- Shannon, C. E. (1948b). A mathematical theory of communication. Bell System Technical Journal, 27, 623–656. doi:10.1002/j.1538-7305.1948.tb00917.x
- Shannon, P., Markiel, A., Ozier, O., Baliga, N. S., Wang, J. T., Ramage, D., … Ideker, T. (2003). Cytoscape: A software environment for integrated models of biomolecular interaction networks. Genome Research, 13, 2498–2504. doi:10.1101/gr.1239303
- Shin, N. R., Whon, T. W., & Bae, J. W. (2015). Proteobacteria: Microbial signature of dysbiosis in gut microbiota. Trends in Biotechnology, 33, 496–503. doi:10.1016/j.tibtech.2015.06.011
- Simpson, E. H. (1949). Measurement of diversity. Nature, 163, 688–689. doi:10.1038/163688a0
- Sivieri, K., Bianchi, F., Tallarico, M. A., & Rossi, E. A. (2011). Fermentation by gut microbiota cultured in a simulator of the human intestinal microbial ecosystem is improved by probiotic Enterococcus faecium CRL 183. Functional Foods in Health and Disease, 1, 389–402. doi:10.31989/ffhd.v1i10.119
- Sjögren, Y. M., Tomicic, S., Lundberg, A., Böttcher, M. F., Björkstén, B., Sverremark-Ekström, E., & Jenmalm, M. C. (2009). Influence of early gut microbiota on the maturation of childhood mucosal and systemic immune responses. Clinical and Experimental Allergy, 39, 1842–1851. doi:10.1111/j.1365-2222.2009.03326.x
- Sonnenburg, J. L., & Bäckhed, F. (2016). Diet-microbiota interactions as moderators of human metabolism. Nature, 535, 56–64. doi:10.1038/nature18846
- Sun, C., Wei, W., Su, H., Zou, X., & Wang, X. (2018). Evaluation of sn −2 fatty acid composition in commercial infant formulas on the Chinese market: A comparative study based on fat source and stage. Food Chemistry, 242, 29–36. doi:10.1016/j.foodchem.2017.09.005
- Tan, J., McKenzie, C., Potamitis, M., Thorburn, A. N., Mackay, C. R., & Macia, L. (2014). The role of short-chain fatty acids in health and disease. Advances in Immunology, 121, 91–119. doi:10.1016/B978-0-12-800100-4.00003-9
- Tomás-Barberán, F. A., Selma, M. V., & Espín, J. C. (2016). Interactions of gut microbiota with dietary polyphenols and consequences to human health. Current Opinion in Clinical Nutrition and Metabolic Care, 19, 471–476. doi:10.1097/MCO.0000000000000314
- Ventura, M., O’Toole, P. W., De Vos, W. M., & Van Sinderen, D. (2018). Selected aspects of the human gut microbiota. Cellular and Molecular Life Sciences: CMLS, 75, 81–82. doi:10.1007/s00018-017-2669-8
- Vernocchi, P., Del Chierico, F. D., & Putignani, L. (2016). Gut microbiota profiling: Metabolomics based approach to unravel compounds affecting human health. Frontiers in Microbiology, 7, 1144. doi:10.3389/fmicb.2016.01144
- Vulevic, J., Rastall, R. A., & Gibson, G. R. (2004). Developing a quantitative approach for determining the in vitro prebiotic potential of dietary oligosaccharides. FEMS Microbiology Letters, 236, 153–159. doi:10.1016/j.femsle.2004.05.036
- Wang, Z., Xiao, G., Yao, Y., Guo, S., Lu, K., & Sheng, Z. (2006). The role of bifidobacteria in gut barrier function after thermal injury in rats. Journal of Trauma, 61, 650–657. doi:10.1097/01.ta.0000196574.70614.27
- Xie, M., Chen, G., Wan, P., Dai, Z., Hu, B., Chen, L., … Sun, Y. (2017). Modulating effects of dicaffeoylquinic acids from ilex kudingcha on intestinal microecology in vitro. Journal of Agricultural and Food Chemistry, 65, 10185–10196. doi:10.1021/acs.jafc.7b03992
- Yang, J., & Yu, J. (2018). The association of diet, gut microbiota and colorectal cancer: What we eat may imply what we get. Protein and Cell, 9, 474–487. doi:10.1007/s13238-018-0543-6
- Yang, T., Xu, X., He, C., & Li, L. (2003). Lipase-catalyzed modification of lard to produce human milk fat substitutes. Food Chemistry, 80, 473–481. doi:10.1016/S0308-8146(02)00315-1
- Yao, M., Lien Eric, L., Capeding Maria, R. Z., Fitzgerald, M., Ramanujam, K., Yuhas, R., … DeRusso Patricia, A. (2014). Effects of term infant formulas containing high sn-2 palmitate with and without oligofructose on stool composition, stool characteristics, and bifidogenicity. JPGN, 59, 440–448.
- Zhang, X., Zhu, X., Sun, Y., Hu, B., Sun, Y., Jabbar, S., & Zeng, X. (2013). Fermentation in vitro of EGCG, GCG and EGCG3”me isolated from oolong tea by human intestinal microbiota. Food Research International, 54, 1589–1595. doi:10.1016/j.foodres.2013.10.005
- Zhu, G., Ma, F., Wang, G., Wang, Y., Zhao, J., Zhang, H., & Chen, W. (2018). Bifidobacteria attenuate the development of metabolic disorders, with inter- and intra-species differences. Food and Function, 9, 3509–3522. doi:10.1039/c8fo00100f
- Zou, X., Jin, Q., Guo, Z., Xu, X., & Wang, X. (2016). .Preparation and characterization of human milk fat substitutes based on triacylglycerol profiles. Journal of the American Oil Chemists’ Society, 93, 781–792. doi:10.1007/s11746-016-2816-7