
 ?Mathematical formulae have been encoded as MathML and are displayed in this HTML version using MathJax in order to improve their display. Uncheck the box to turn MathJax off. This feature requires Javascript. Click on a formula to zoom.
ABSTRACT
Within this study, phytochemical, fatty acid and proximal composition of six Indonesian brown rice cultivars (Inpari 42, Inpari 43, Situ Bagendit, IPB3 S, Inpari 17, and Inpara 3) were reported. The range of moisture, ash, crude fat, crude protein, and total carbohydrates content of six varieties of brown rice were 11–12%, 1.3–1.4%, 2–3%, 7–11%, and 84–89%, respectively. Fatty acid composition of brown rices was dominated by unsaturated fatty acids. The phenolic contents and IC50 of all cultivars varied from 47 to 70 mg GAE/100 g and 28–47 mg/mL, respectively. Inpari 17 had the highest phenolic content as well as antioxidant activity, whereas IPB 3 S variety exhibited the lowest in both γ-oryzanol content of brown rices ranged from 37 to 55 mg/100 g. The highest content of γ-oryzanol was observed in Inpara 3. In conclusion, six varieties of Indonesian brow rice might be considered as the potent sources of bioactive compounds and antioxidant, especially in Inpari 17 variety.
Resumen
El presente estudio se propuso informar sobre la composición fitoquímica, de ácidos grasos y proximal de seis cultivares de arroz integral indonesio (Inpari 42, Inpari 43, Situ Bagendit, IPB3S, Inpari 17 e Inpara 3). Se constató que el grado de contenido de humedad, cenizas, grasa bruta, proteína bruta y total de carbohidratos de seis variedades de arroz integral fue de 11-12%, 1.3-1.4%, 2-3%, 7-11% y 84-89%, respectivamente. En la composición de ácidos grasos de los arroces integrales predominan los ácidos grasos insaturados. El contenido fenólico y el IC50 de todos los cultivares variaron entre 47-70 mg GAE/100g y 28-47 mg/mL, respectivamente. El Inpari 17 presentó el mayor contenido fenólico y la mayor actividad antioxidante, mientras que la variedad IPB 3S exhibió el contenido más bajo de ambos factores. El contenido de γ-orizanol de los arroces integrales varió entre 37-55 mg/100g. El mayor contenido de γ-orizanol se observó en el Inpara 3. Tales resultados permiten concluir que estas seis variedades de arroz integral indonesio podrían considerarse fuentes potentes de compuestos bioactivos y antioxidantes, destacándose en este sentido la variedad Inpari 17.
1. Introduction
Carbohydrates are the primary macronutrients which play an essential function as an energy source in the human diet (Thiranusornkij et al., Citation2018). One of the main sources of carbohydrate which is consumed by half of the population in the world is rice. Rice contributes to about 22% of total energy intake and provides approximately 700 Cal/day-person for three billion people in the world (Verma & Srivastav, Citation2017; Vetha Varshini et al., Citation2013). In Indonesia, rice is a strategic commodity, as a primary food crop cultivated, and also as a staple food for more than 240 million people (Murdifin et al., Citation2015).
Consistent observational evidence recommends that consumption of whole grain is a part of an ideal diet that is related to reduced risk of cardiovascular disease, metabolic health issues such as type II diabetes, colon cancers, as well as weight gain (Brownlee et al., Citation2018; Upadhyay et al., Citation2018). Brown rice or unpolished rice is a part of whole grain in which inedible outer layer of the paddy is removed, while the whole kernel is still intact. Brown rice contains plentiful nutrients such as minerals, essential amino acids, unsaturated fatty acids, tocopherols, and tocotrienols (Kalman, Citation2014; Thomas et al., Citation2015). Furthermore, brown rice is also rich in bioactive compounds such as phenolic compounds, γ-oryzanol, and dietary fibers, as well as antioxidants (Ohtsubo et al., Citation2005; Pascual et al., Citation2013; Thomas et al., Citation2015; Tuncel & Yılmaz, Citation2011). Hereby, a number of researches have shown that brown rice has many health benefits, such as antioxidative properties, anti-hyperglycemia, anti-hypocholesterolaemia, and cardioprotective effects (Mir et al., Citation2017).
There are more than hundred varieties of paddy which are already cultivated in Indonesia. These varieties span between local and national varieties, including pigmented and non-pigmented cultivars. In the local varieties, the paddy has been cultivated from generation-to-generation. On the other side, national varieties are those that have been developed, registered and released by the government. Nowadays, the researches related to the development of new types of paddy in Indonesia are continuing in order to obtain desired superior varieties. National superior variety usually refers to the developed strain breeding with one or more special benefits, such as high yield, resistance to any pest and disease, tolerant to environmental stress, etc. Since consumers become more aware of the potential benefits obtained from daily diets, the selection of the rice varieties having enhanced nutritional traits or containing higher amount of bioactive compounds is of importance (Kaushik et al., Citation2015; Mahender et al., Citation2016). Inpari 42 and Inpari 43 as low amylose content rice varieties, Situ Bagendit as intermediate amylose content rice variety, and Inpari 17 and Inpara 3 as high amylose content rice varieties are some superior varieties that are developed by the Indonesian Center for Rice Research, Subang, Indonesia. Additionally, IPB 3 S (intermediate amylose content rice variety) is the rice variety developed by IPB University released in 2014, and it has high potential yield up to 11 tonnes/ha. Since these rice varieties are recently developed, such physicochemical characteristics of these might be contributive for the development of rice-based functional food products. Thus, this research was aimed at evaluating the physicochemical characteristics of the selected brown rice varieties from Indonesia.
2. Material and methods
2.1. Sample preparation
Six Indonesian rice cultivars were used in this research. Inpari 42, Inpari 43, Situ Bagendit (SB), Inpari 17, and Inpara 3; were obtained from Indonesian Center for Rice Research, Subang, West Java, whereas var. IPB 3 S was purchased from seed center IPB University. All samples were dehulled using dehusking machine (Satake, Japan) and graded by OSK 10291 R testing rice grader (KW 0.25, rpm 28, Ogawa Seiki.Co.Ltd, Japan). Rice grains were ground to fine flour using waring blender (Miyako, Indonesia) and sieved using 40 Tyler mesh. The obtained brown rice flour of six cultivars was packed and stored at −20°C for further analyses.
2.2. Chemical composition
Proximate composition of brown rice flour was determined using standard methods of [AOAC] Association of Official Analytical Chemistry (Citation2005) and crude protein content by Kjeldahl method was obtained using conversion factor (nitrogen-to-protein) of 5.95. Additionally, total carbohydrates were calculated as weight difference between sample and the summation of total weight from moisture, protein, fat and ash.
2.3. Extraction of phenolic compounds
Phenolic compounds were extracted according to Chen et al. (Citation2016) with slight modification. The rice flour (approximately 1.5 g) was extracted with 20 mL of ethanol 80% (v/v) for 30 min at room temperature. The mixture was then centrifuged at 4000 g (Hermle Z 383 K, Wehingen, Germany) at 4°C for 30 min. The supernatant was collected in a dark bottle and stored at 4°C for further analysis.
2.4. Determination of total phenolic content
Phenolic content was analysed in duplicate following the Folin–Ciocalteau method (Qiu et al., Citation2010; Singleton & Rossi, Citation1965). Briefly, a 0.2 mL of sample extract was mixed with 1.8 mL of Folin-Ciocalteau reagent (freshly prepared) which was previously diluted for 10-fold. The mixture was added to 1.8 mL of 60 g/L Na2CO3, and mixed thoroughly by vortex mixer. After reacting for 90 min, the mixture then analysed using spectrophotometer (Thermo ScientificTM GENESYSTM 150 UV-Visible) at 725 nm. The obtained concentration was compared to the standard curve of gallic acid, and expressed as mg gallic acid equivalent per 100 g dry sample (mg GAE/100 g).
2.5. Determination of antioxidant activity
The antioxidant activity was measured in duplicate using DPPH scavenging activity originally developed by Brand-Williams et al. (Citation1995) with modification. Serial concentrations of phenolic extracts of rice (1.0 mL) were mixed with 3.0 mL of freshly prepared 140 µM DPPH solution (Sigma Aldrich, Germany) and incubated in the darkroom for 60 min. The mixture was analysed using spectrophotometer (Thermo ScientificTM GENESYSTM 150 UV-Visible) at 515 nm. Ascorbic acid was used as control. DPPH scavenging activity was calculated using the following formula (Equationeq. 1)(eq. 1)
(eq. 1) :
2.6. Determination of γ-aminobutyric acid (GABA)
GABA content was determined in duplicate following Zhang et al. (Citation2014). About 1.0 g of rice flour was added with 5 mL of deionized water in a plastic tube. The mixture was oscillated and the extraction was performed for 1 h, then centrifuged and finally filtered. Half millilitre of the extract was added to the mixture of 0.2 mL borate buffer (pH 9), 1.0 mL of 6% phenol reagent (w/v) and 0.4 mL of 9% sodium hypochlorite. The tube was placed into boiling water bath for 10 min, and cooled immediately in ice water for 20 min. The sample was measured by means of spectrophotometer (Thermo ScientificTM GENESYSTM 150 UV-Visible) at 645 nm. Standard curve of GABA (ACROS, USA) was prepared at different concentrations to determine GABA concentrations of the samples.
2.7. Determination of γ-oryzanol
The analysis of γ-oryzanol was measured duplicate by partial extraction method described by Lilitchan et al. (Citation2008). Two identical rice flour samples (1.0 g) were extracted with different volumes of isopropanol (4.0 mL and 8.0 mL) and centrifuged for 10 min at 1200 g. The absorbance of the supernatant was measured using a spectrophotometer (Thermo ScientificTM GENESYSTM 150 UV-Visible) at 326 nm. The γ-oryzanol contents of the samples were compared to the standard curve of γ-oryzanol (Merck, Germany) and calculated as follows (Equationeq. 2)(eq. 2)
(eq. 2) :
where y is the concentration of γ-oryzanol in the rice sample, x1 is the concentration of γ-oryzanol in 4.0 mM extract, and x2 is the concentration of γ-oryzanol in 8.0 mL extract.
2.8. Determination of fatty acid compositions
Lipids were extracted from the rice flours according to the method described by Bligh and Dyer (Citation1959). Approximately 5.0 g of sample was mixed with distilled water, chloroform, and methanol to reach chloroform:methanol:water ratio of 1:2:0.8 (v/v/v), and followed by centrifugation at 1800 g for 10 min. To the sample was added chloroform and water containing 0.85% of KCl to reach the final ratio of chloroform:methanol:water of 2:2:1.8 (v/v/v). The mixture was centrifuged at 1800 g for 10 min and filtered to remove solids. The supernatant was allowed to separate into two phases. The lower chloroform phase was collected and evaporated by using nitrogen at 50°C.
Fatty acids derivatization and analysis were conducted based on previous study from our laboratory (Taufik et al., Citation2016). Lipid extract was added to 1.0 mL of internal standard containing 1 mg/mL heptadecanoic acid in hexane, and 1.5 mL of 0.5 N NaOH in methanol. The mixture was then mixed vigorously and heated at 95°C for 5 min. Samples were cooled by tap water, then 2.0 mL of BF3 methanol (14%, v/v) were added to each. Samples were then mixed for 10 s followed by heating at 95°C for 30 min and cooled in tap water. Then, 1.0 mL of hexane was added, and the mixture was thoroughly mixed for 1 min. Finally, the solution was added with 3.0 mL of saturated NaCl and the hexane layer transferred into the glass vial containing Na2SO4 anhydrous. The upper hexane layer was transferred to another vial and stored at – 20°C prior to analysis.
The analysis of fatty acids was performed by means of Gas Chromatography 7890A (Agilent Technologies, California, US) equipped with flame ionization detector (FID) and split less injector (1.0 µl). Temperature of injector and detector were set at 270°C and 280°C, respectively. The column was DB-23 (J and W Scientific, Folsom, CA) with dimension of 60 m × 0.25 mm, film thickness of 0.25 µm. The temperature program was set as follows: the initial temperature of 130°C and held for 2 min, followed by an increase to 170°C at 6.5°C/min and held for 5 min. Thereafter, it was increased to 215°C at 2.75°C/min and held for 12 min, followed by an increase to 230°C at 30°C/min and held for 30 min. The carrier gasses used were helium and nitrogen from ultra-high purity grade at flowing at 11.07 and 31.24 mL/min, respectively, for helium and nitrogen.
2.9. Determination of rice flour pasting properties
Pasting properties of six cultivars of brown rice flour were carried out using rapid visco analyzer (RVA). Approximately 3 g of flour (moisture content of 14%) was diluted in 25 g of distilled water, followed by heating and cooling cycle with constant stirring. Sample was heated at 50°C for 1 min to 95°C at 6°C/min and maintained for 5 min. The temperature reduced down to 50°C at 6°C/min, and then held at 50°C for 5 min. The measurement was carried out in duplicate and reported as mean ± SD.
2.10. Statistical analysis
Each datapoint was presented as mean ± standard deviation (SD). The analysis of the variance and significant differences amongst the samples were conducted by means of analysis of variance (ANOVA) and Duncan’s multiple range test. The SPSS software version 22 was done to perform these statistical analyses.
3. Results and discussion
3.1. Chemical composition
The proximate composition of six Indonesian brown rice varieties is shown in . The moisture contents of all varieties were 11.07–12.22%. The values are still in the range of optimum storage for bag storage of grains (14%) (Alaka et al., Citation2011; Verma & Srivastav, Citation2017). The values of ash content showed significant difference among all varieties, with a range of 1.29–1.44%. Crude fat contents of six cultivars of Indonesian brown rice were 2.24–3.04%. The highest fat content was from Inpari 17, whereas the lowest one was from Situ Bagendit and IPB 3 S. These levels of fat content are comparable to some brown rice in Pakistan and Ebonyl state ranged from 1% to 3% (Alaka et al., Citation2011; M. Zubair, Anwar, Ali et al., Citation2012). Protein contents of the samples were 7.36–10.99%. The accessibility of protein content from six brown rice varieties was appreciably high, i.e. more than 7%. This is comparable to some brown rice varieties such as three varieties from Malaysia (MRQ 74, MRQ 76, and MR 84), Chak-hao Angbaba from India, and commercial brown rice from America had the crude protein content around 5 – 12% (Abubakar, Yakasai, Zawawi & Ismail, Citation2017; Murdifin et al., Citation2015; Reddy et al., Citation2017; Xu et al., Citation2012). Total carbohydrates content also showed significant difference among the samples ranging from 84.76% to 89.06%.
Table 1. Chemical composition of six Indonesian brown rice varieties.
Tabla 1. Composición química de seis variedades de arroz integral indonesio
3.2. Phytochemical compounds
As a whole food, brown rice is a good source of nutrients and bioactive compounds as well as antioxidants which are beneficial to human health (Vetha Varshini et al., Citation2013). shows the total phenolic content (TPC), γ-oryzanol, and GABA content of six Indonesian rice varieties.
Table 2. Total phenolic content (TPC), γ-oryzanol, and GABA content of six Indonesian brown rice varieties.
Tabla 2. Contenido fenólico total (TPC), γ-orizanol, y contenido de GABA de seis variedades de arroz integral indonesio
It is evident from that TPCs in brown rice varieties were ranging from 47.07 to 70.22 mg GAE/100 g. The highest TPC was found in Inpari 17, while the lowest TPC was in IPB 3 S. Brown rice has plenty of phenolic content compared to the white rice (Tuncel & Yılmaz, Citation2011). Although the phenolic content of brown rice varied in the different varieties, it is worth noting that the difference may also rise from the extraction methods applied to the samples (M. Zubair, Anwar, Shahid et al., Citation2012). Several studies also reported that approximately 40–62% of TPC present in rice are in the bound fraction; thus, it might not be easily extracted by classical solvent extraction (Adom & Liu, Citation2002; Gong et al., Citation2017; Tuncel & Yılmaz, Citation2011). TPC of japonica brown rice var. Taikeng 9 using ethanol extract was 170 mg GAE/100 g (Chen et al., Citation2016), while Kaur et al. (Citation2017) extracted some Indian brown rice varieties using methanol 80% resulted in TPC ranging from 94 to 157 mg GAE/100 g.
The γ-oryzanol is one of bioactive compounds that is found in oil fraction of brown rice (Cho & Lim, Citation2016). γ-oryzanol consists of a set of 10 or more compounds with ester bonds between triterpenes and ferulic acid. The major compounds of γ-oryzanol found in brown rice are cycloartenyl ferulate, 24-methylene cycloartanyl ferulate, and campestanyl ferulate, composing around 90% of brown rice (Cáceres et al., Citation2017; Jayadeep & Malleshi, Citation2011). γ-oryzanol contents of the six rice cultivars in this study were around 37.86–55.02 mg/100 g (see ). Brown rice from Inpari 42, Inpari 43, and IPB 3 S had the lowest γ-oryzanol content (39.33 ± 0.62 mg/100 g, 37.86 ± 1.89 mg/100 g, and 39.39 ± 1.37 mg/100 g), while Inpara 3 had the highest γ-oryzanol content (55.02 ± 3.08 mg/100 g).
The amount of γ-oryzanol content obtained in this research is comparable to the previous research reported by Miller and Engell (Citation2006) which investigated 30 brown rice samples from various varieties cultivated at different locations (Italia, France, and Spain) during 2000–2002 seasons. The results revealed that γ-oryzanol content ranged from 26 to 63 mg/100 g. In addition, the variation of γ-oryzanol has also been reported previously in varieties of brown rice from different geographical locations, ranging from 1.2 mg/100 g in brown rice from Camargue area, France (Pereira-Caro et al., Citation2013) to 313 mg/100 g in brown rice from Taiwan (Huang & Ng, Citation2011). Eight brown rice cultivars in Southern Sarawak, Malaysia, had γ-oryzanol ranging from 9.9 to 27 mg/100 g (Kiing et al., Citation2009). Lower γ-oryzanol content is reported for brown rice SFL09 Indica variety 11.17 mg/100 g (Cáceres et al., Citation2017), three varieties in Brazil cultivated in several areas ranging from 15.1 to 22.8 mg/100 g (Pascual et al., Citation2013).
GABA content of brown rice ranged from 18.92 to 24.85 mg/100 g (refer to ). GABA is well known as nonprotein amino acid that acts as the main inhibitory neurotransmitter in the mammalian cortex since it was first found as an integral part of the mammalian central nervous system (Cho & Lim, Citation2018). Several studies reported that GABA content in brown rice from various cultivars is typically low. Japan brown rice cultivar Koshihikari had GABA content of 6.04 mg/100 g (Ohtsubo et al., Citation2005), Malaysian brown rice var. MR 220 had GABA content of 9 mg/100 g (Imam et al., Citation2012), while 10 varieties in India also showed lower GABA content ranging from 3.7 to 5.6 mg/100 g (Kaur et al., Citation2017). The variation of GABA content in brown rice might be related to several factors, such as varieties (Kaur et al., Citation2017), extraction methods (Schrauwen & Linskens, Citation1974) and analytical instruments (Ishikawa et al., Citation2009).
3.3. Antioxidant activity
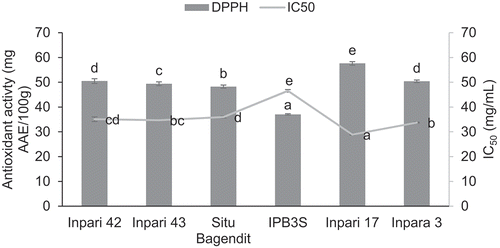
The antioxidant activities and IC50 values of six brown rice varieties are presented in . The brown rice, Inpari 17 variety showed the highest antioxidant activity (57.62 ± 0.78 mg AAE/100 g), while IPB 3 S had the lowest antioxidant activity (37.04 ± 0.29 mg AAE/100 g). The IC50 generally has a negative correlation with the antioxidant activity. Corresponding to this, Moongngarm et al. (Citation2012) reported that lowering IC50 value resulted in the higher antioxidant activity. Inpari 17 which had the highest antioxidant activity exhibited the lowest IC50 (28.89 mg/ml), whereas IPB 3 S indicated the highest IC50 value (46.54 ± 0.52 mg/ml). Another result reported by (Imam et al., Citation2012) on Malaysian brown rice variety MR220 extracted with ethanol 70% (v/v) had IC50 value of 6.82 mg/ml.
Figure 1. Antioxidant activity and IC50 of six Indonesian brown rice varieties.
Figura 1. Actividad antioxidante e IC50 de seis variedades de arroz integral indonesio
3.4. Fatty acid composition
shows the fatty acid profiles of the six Indonesian brown rice varieties. The compositions of fatty acid in the six brown rice samples are typically the same. The saturated fatty acids observed in the samples consist of myristic acid, palmitic acid, stearic acid, arachidic acid, and behenic acid, while unsaturated fatty acids consist of palmitoleic acid, oleic acid, linoleic acid, linolenic acid, and cis-11-eicosenoic acid. It is important to note that palmitic, oleic, and linoleic acid in all samples represented the major fatty acid composition of brown rice. These results are comparable to the other studies where major fatty acids in rice are palmitic, oleic, and linoleic acid (Monks et al., Citation2013; Thomas et al., Citation2015; M. Zubair, Anwar, Ashraf et al., Citation2012).
Table 3. Fatty acid profiles of six Indonesian brown rice varieties.
Tabla 3. Perfiles de ácidos grasos de seis variedades de arroz integral indonesio
The total saturated fatty acids () ranged from 22% to 25%, while unsaturated fatty acids ranged from 75% to 78%. The saturations of the fatty acids have drawn much attention because it related to the health benefits in humans. Linoleic acid, an unsaturated fatty acid, was observed as the predominating fatty acid composition in brown rice, followed by oleic acid which contributed more than 70% of the total fat contents. The abundance of unsaturated fatty acids in brown rice is considered beneficial because it will not lead to heart-related diseases (Thomas et al., Citation2015). On the other hand, it might raise other issues especially for the handling and storing of brown rice due to the higher unsaturated fatty acid content. The unsaturated fatty acids are susceptible to lipid oxidation which results in undesirable changes in organoleptic properties, due to the presence of off-flavors (Feng et al., Citation2019).
3.5. Pasting properties
The pasting profiles of six Indonesian brown rice varieties are presented in and . This profile is used to evaluate the behavior of the brown rice flour during heating, cooling, as well as stirring processes. Furthermore, the pasting properties are useful indicators for food product development. The parameters obtained from RVA consist of peak, trough, breakdown, setback, as well as pasting temperature. The results showed significant variations of these parameters amongst the samples.
Table 4. Pasting properties of six Indonesian brown rice varieties.
Tabla 4. Propiedades de pegado de seis variedades de arroz integral indonesio
Figure 2. Pasting profiles of six Indonesian brown rice varieties.
Figura 2. Perfiles de pegado de seis variedades de arroz integral indonesio
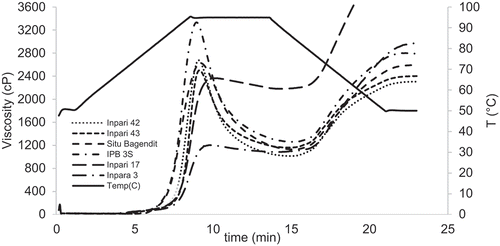
Gelatinization temperatures of the six brown rice varieties ranged from 81.7°C to 89.8°C. Brown rice from IPB 3 S var. had the lowest gelatinization temperature, while Inpara 3 had the highest gelatinization temperature. Peak viscosity (PV) of the brown rice flours varied between 1204 and 3336 cP. The highest and lowest PV was observed for IPB 3 S and Inpara 3, respectively. PV represents the ability of starch granule to bind to the water molecules by hydrogen bonding (Kraithong et al., Citation2018). The variation of PV also relates to the swelling power and the disruption rate of the starch granule (Rithesh et al., Citation2018). A higher PV indicates higher water binding and swelling power. After reaching the PV, the gelatinized starch showed a reduction in viscosity, and it is called the breakdown viscosity. Brown rice of Inpari 17 and Inpara 3 showed the lowest breakdown value, indicating that the gelatinized starch granule is more stable during cooking process (Thiranusornkij et al., Citation2018). In contrast, IPB 3 S had the highest breakdown viscosity. The high breakdown viscosity of the starch granules demonstrates the ease of starch granules to be broken after the maximum swelling at the peak viscosity (Varavinit et al., Citation2003).
The starch molecules are able to reassociate during cooling process resulting in the formation of gel; and thus, increasing viscosity. The final viscosity and setback observed in this study ranged from 2305 to 4898 cP and 1243 to 2717 cP, respectively. Inpari 42 showed the lowest final viscosity as well as setback value, while Inpari 17 showed the highest final viscosity and setback value compared to the other samples. Final viscosity is usually used as a quality parameter on starch gelling formation during cooling (Thomas et al., Citation2014), whereas setback represents the retrogradation indicators of pasting flours (Iwe et al., Citation2016).
The variations of pasting properties of brown rice are affected by rice flour constituents (Kraithong et al., Citation2018; Oko & Ugwu, Citation2011). It should be considered that high amylose content of brown rice tends to provide lower peak, trough, as well as breakdown viscosities. It also affects the increase in final viscosity, setback, and pasting temperature (Ye et al., Citation2016). Herein, pasting properties of brown rice from Inpari 17 and Inpara 3 might be affected by its high amylose content. Moreover, total starch, protein contents, lipids, and fibers also affected the pasting properties of the flours (Kraithong et al., Citation2018; Mir et al., Citation2017; Ye et al., Citation2016).
4. Conclusion
There were some differences in proximate and pasting properties of six brown rice varieties. Brown rice from six varieties showed crude protein content more than 7% with the highest content reported in var. Inpari 43 and Inpara 3. The highest fat content was observed in Inpari 17, however, there was no significant difference in fatty acid compositions among those varieties. The pasting properties showed that Inpari 17 and Inpara 3 had a lower breakdown and higher setback value. Amongst the six cultivars, Inpari 17 had the highest phenolic content as well as antioxidant activity, whereas IPB 3 S variety had the lowest one. The phenolic content in the rice varieties showed a strong correlation with their antioxidant activities. The highest and the lowest content of γ-oryzanol were observed in Inpara 3, and both of Inpari 42 and Inpari 43, respectively.
Acknowledgments
The authors would like to acknowledge The Ministry of Research, Technology, and Higher Education, and The Ministry of Education and Culture for supporting this research through Pendidikan Magister Menuju Doktor untuk Sarjana Unggul (PMDSU) scholarship program for the first author.
Disclosure Statement
No potential conflict of interest was reported by the authors.
Additional information
Funding
References
- Abubakar, B., Yakasai, H. M., Zawawi, N., & Ismail, M. (2017). Compositional analyses of white, brown and germinated forms of popular Malaysian rice to offer insight into the growing diet-related diseases. Journal of Food and Drug Analysis, 26(2), 706-715. https://doi.org/10.1016/j.jfda.2017.06.010
- Adom, K. K., & Liu, R. H. (2002). Antioxidant activity of grains. Journal of Agricultural and Food Chemistry, 50(21), 6182–6187. doi:10.1021/jf0205099
- Alaka, I., Ituma, J. O., & Ekwu, F. (2011). Physical and Chemical Properties of Some Selected Rice Varieties in Ebonyi State. Nigerian Journal of Biotechnology, 22, 40–46. https://www.ajol.info/index.php/njb/article/view/106805
- [AOAC] Association of Official Analytical Chemistry. (2005). Official methods of analysis of AOAC International 18th edition. AOAC International.
- Bligh, E. G., & Dyer, W. J. (1959). A rapid method of total lipid extraction and purification. Canadian Journal of Biochemistry and Physiology, 37(8), 911–917. https://www.nrcresearchpress.com/doi/10.1139/y59-099#.Xqbf9WgzZPY
- Brand-Williams, W., Cuvelier, M. E., & Berset, C. (1995). Use of a Free Radical Method to Evaluate Antioxidant Activity. LWT - Food Science and Technology, 28(1), 25–30. https://doi.org/10.1016/S0023-6438(95)80008-5
- Brownlee, I. A., Durukan, E., Masset, G., Hopkins, S., & Tee, E. S. (2018). An overview of whole grain regulations, recommendations and research across Southeast Asia. Nutrients, 10(6), 752. https://doi.org/10.3390/nu10060752
- Cáceres, P. J., Peñas, E., Martinez-Villaluenga, C., Amigo, L., & Frias, J. (2017). Enhancement of biologically active compounds in germinated brown rice and the effect of sun-drying. Journal of Cereal Science, 73, 1–9. https://doi.org/10.1016/j.jcs.2016.11.001
- Chen, H. H., Chang, H. C., Chen, Y. K., Hung, C. L., Lin, S. Y., & Chen, Y. S. (2016). An improved process for high nutrition of germinated brown rice production: Low-pressure plasma. Food Chemistry, 191, 120–127. https://doi.org/10.1016/j.foodchem.2015.01.083
- Cho, D. H., & Lim, S. T. (2016). Germinated brown rice and its bio-functional compounds. Food Chemistry, 196, 259–271. https://doi.org/10.1016/j.foodchem.2015.09.025
- Cho, D. H., & Lim, S. T. (2018). Changes in phenolic acid composition and associated enzyme activity in shoot and kernel fractions of brown rice during germination. Food Chemistry, 256(February), 163–170. https://doi.org/10.1016/j.foodchem.2018.02.040
- Feng, X., Tjia, J. Y. Y., Zhou, Y., Liu, Q., Fu, C., & Yang, H. (2019). (2020). Effects of Tocopherol Nanoemulsion Addition on Fish Sausage Properties and Fatty Acid Oxidation. LWT - Food Science and Technology, 118(October, 108737. https://doi.org/10.1016/j.lwt.2019.108737
- Gong, E. S., Luo, S. J., Li, T., Liu, C. M., Zhang, G. W., Chen, J., … Liu, R. H. (2017). Phytochemical profiles and antioxidant activity of brown rice varieties. Food Chemistry, 227, 432–443. https://doi.org/10.1016/j.foodchem.2017.01.093
- Huang, S.-H., & Ng, L.-T. (2011). Quantification of tocopherols, tocotrienols, and γ-oryzanol contents and their distribution in some commercial rice varieties in Taiwan. Journal of Agricultural and Food Chemistry, 59(20), 11150–11159. doi:10.1021/jf202884p
- Imam, M. U., Musa, S. N. A., Azmi, N. H., & Ismail, M. (2012). Effects of white rice, brown rice and germinated brown rice on antioxidant status of type 2 diabetic rats. International Journal of Molecular Sciences, 13(10), 12952–12969. https://doi.org/10.3390/ijms131012952
- Ishikawa, A., Oka, H., Hiemori, M., Yamashita, H., Kimoto, M., Kawasaki, H., & Tsuji, H. (2009). Development of a Method for the Determination of γ-Aminobutyric Acid in Foodstuffs. Journal of Nutritional Science and Vitaminology, 55(3), 292–295. https://doi.org/10.3177/jnsv.55.292
- Iwe, M. O., Onyeukwu, U., & Agiriga, A. N. (2016). Proximate, functional and pasting properties of FARO 44 rice, African yam bean and brown cowpea seeds composite flour. Cogent Food & Agriculture, 2(1), 1–10. https://doi.org/10.1080/23311932.2016.1142409
- Jayadeep, A., & Malleshi, N. G. (2011). Nutrients, composition of tocotrienols, tocopherols, and γ -oryzanol, and antioxidant activity in brown rice before and after biotransformation Nutrientes, composición de tocotrienoles, tocoferoles y γ -oryzanol, y actividad antioxidante del arroz integr. CyTA - Journal of Food, 9(1), 82–87. https://doi.org/10.1080/19476331003686866
- Kalman, D. S. (2014). Amino Acid Composition of an Organic Brown Rice Protein Concentrate and Isolate Compared to Soy and Whey Concentrates and Isolates. Foods, 3(3), 394–402. https://doi.org/10.3390/foods3030394
- Kaur, M., Asthir, B., & Mahajan, G. (2017). Variation in Antioxidants, Bioactive Compounds and Antioxidant Capacity in Germinated and Ungerminated Grains of Ten Rice Cultivars. Rice Science, 24(6), 349–359. https://doi.org/10.1016/j.rsci.2017.08.002
- Kaushik, P., Andújar, I., Vilanova, S., Plazas, M., Gramazio, P., Herraiz, F. J., … Prohens, J. (2015). Breeding vegetables with increased content in bioactive phenolic acids. Molecules, 20(10), 18464–18481. https://doi.org/10.3390/molecules201018464
- Kiing, S. C., Yiu, P. H., Rajan, A., & Wong, S. C. (2009). Effect of germination on γ-oryzanol content of selected sarawak rice cultivars. American Journal of Applied Sciences, 6(9), 1658–1661. https://doi.org/10.3844/ajassp.2009.1658.1661
- Kraithong, S., Lee, S., & Rawdkuen, S. (2018). Physicochemical and functional properties of Thai organic rice flour. Journal of Cereal Science, 79, 259–266. https://doi.org/10.1016/j.jcs.2017.10.015
- Lilitchan, S., Tangprawat, C., Aryusuk, K., Krisnangkura, S., Chokmoh, S., & Krisnangkura, K. (2008). Partial extraction method for the rapid analysis of total lipids and γ-oryzanol contents in rice bran. Food Chemistry, 106(2), 752–759. https://doi.org/10.1016/j.foodchem.2007.06.052
- Mahender, A., Anandan, A., Pradhan, S. K., & Pandit, E. (2016). Rice grain nutritional traits and their enhancement using relevant genes and QTLs through advanced approaches. SpringerPlus, 5(1), 2086. https://doi.org/10.1186/s40064-016-3744-6
- Miller, A., & Engell, K.-H. (2006). Content of γ-Oryzanol and Composition of Steryl Ferulates in Brown Rice (Oryza sativa L.). Of European Origin. Journal of Agricultural and Food Chemistry, 54(21), 8127–8133. doi:10.1021/jf061688n
- Mir, S. A., Bosco, S. J. D., Shah, M. A., Santhalakshmy, S., & Mir, M. M. (2017). Effect of apple pomace on quality characteristics of brown rice based cracker. Journal of the Saudi Society of Agricultural Sciences, 16(1), 25–32. https://doi.org/10.1016/j.jssas.2015.01.001
- Monks, J. L. F., Vanier, N. L., Casaril, J., Berto, R. M., de Oliveira, M., Gomes, C. B., … Elias, M. C. (2013). Effects of milling on proximate composition, folic acid, fatty acids and technological properties of rice. Journal of Food Composition and Analysis, 30(2), 73–79. https://doi.org/10.1016/j.jfca.2013.01.009
- Moongngarm, A., Daomukda, N., & Khumpika, S. (2012). Chemical Compositions, Phytochemicals, and Antioxidant Capacity of Rice Bran, Rice Bran Layer, and Rice Germ. APCBEE Procedia, 2, 73–79. https://doi.org/10.1016/j.apcbee.2012.06.014
- Murdifin, M., Pakki, E., Rahim, A., Syaiful, S. A., Evary, Y. M., & Bahar, M. A. (2015). Physicochemical Properties of Indonesian Pigmented Rice (Oryza sativa Linn.) Varieties from South Sulawesi. Asian Journal of Plant Sciences, 14(2), 59–65. https://doi.org/10.3923/ajps.2015.59.65
- Ohtsubo, K., Suzuki, K., Yasui, Y., & Kasumi, T. (2005). Bio-functional components in the processed pre-germinated brown rice by a twin-screw extruder. Journal of Food Composition and Analysis, 18(4), 303–316. https://doi.org/10.1016/j.jfca.2004.10.003
- Oko, A. O., & Ugwu, S. I. (2011). The proximate and mineral compositions of five major rice varieties in Abakaliki, South-Eastern Nigeria. International Journal of Plant Physiology and Biochemistry, 3(2), 25–27. https://www.semanticscholar.org/paper/The-proximate-and-mineral-compositions-of-five-rice/6183cb4dfc2b01c194a6ad4e629eaadd7dd40879
- Pascual, C., de, S. C. I., Massaretto, I. L., Kawassaki, F., Barros, R. M. C., Noldin, J. A., & Marquez, U. M. L. (2013). Effects of parboiling, storage and cooking on the levels of tocopherols, tocotrienols and γ-oryzanol in brown rice (Oryza sativa L.). Food Research International, 50(2), 676–681. https://doi.org/10.1016/j.foodres.2011.07.013
- Pereira-Caro, G., Cros, G., Yokota, T., & Crozier, A. (2013). Phytochemical Profiles of Black, Red, Brown, and White Rice from the Camargue Region of France. Journal of Agricultural and Food Chemistry, 61(33), 7976–7986. doi:10.1021/jf401937b
- Qiu, Y., Liu, Q., & Beta, T. (2010). Antioxidant properties of commercial wild rice and analysis of soluble and insoluble phenolic acids. Food Chemistry, 121(1), 140–147. https://doi.org/10.1016/j.foodchem.2009.12.021
- Reddy, C. K., Kimi, L., Haripriya, S., & Kang, N. (2017). Effects of Polishing on Proximate Composition, Physico- Chemical Characteristics, Mineral Composition and Antioxidant. Properties of Pigmented Rice, 24(5), 241–252. https://doi.org/10.1016/j.rsci.2017.05.002
- Rithesh, B. N., Ramchander, S., Rajeswari, S., Uma, D., Robin, S., & Jeyaprakash, P. (2018). Characterization of Physio-Chemical Properties of Starch among Traditional and Commercial Varieties of Rice (Oryza sativa L.) using Rapid Visco Analyser. International Journal of Current Microbiology and Applied Sciences, 7(10), 1490–1503. https://doi.org/10.20546/ijcmas.2018.710.167
- Schrauwen, J. A. M., & Linskens, H. F. (1974). Influence of the extraction conditions on the recovery of free amino acids in plant material. Acta Bot. Neerl., 23(1), 42–47. https://onlinelibrary.wiley.com/doi/10.1111/j.1438-8677.1974.tb00915.x
- Singleton, V. L., & Rossi, J. A. (1965). Colorimetry of Total Phenolics with Phosphomolybdic-Phosphotungstic Acid Reagents. American Journal of Enology and Viticulture, 16, 144–158. Retrieved from http://sci-hub.cc/http://www.ajevonline.org/content/16/3/144.short
- Taufik, M., Lioe, H. N., & Yuliana, N. D. (2016). Evaluation of Major Fatty Acids Determination in Palm Oil by Gas Chromatography-Flame Ionization Detection. Jurnal Agritech, 36(3), 308–316. https://doi.org/10.22146/agritech.16603
- Thiranusornkij, L., Thamnarathip, P., Chandrachai, A., & Kuakpetoon, D. (2018). Physicochemical Properties of Hom Nil (Oryza sativa) Rice Flour as Gluten Free Ingredient in Bread. Foods, 7(10), 1–13. https://doi.org/10.3390/foods7100159
- Thomas, R., Bhat, R., & Kuang, Y. (2015). Composition of amino Acids, fatty acids, minerals and dietary fiber in some of the local and import rice varieties of Malaysia. International Food Research Journal, 22(3), 1148–1155. http://www.ifrj.upm.edu.my/22%20(03)%202015/(38).pdf
- Thomas, R., Bhat, R., Kuang, Y. T., & Abdullah, W. N. W. (2014). Functional and pasting properties of locally grown and imported exotic rice varieties of malaysia. Food Science and Technology Research, 20(2), 469–477. https://doi.org/10.3136/fstr.20.469
- Tuncel, N. B., & Yılmaz, N. (2011). Gamma-oryzanol content, phenolic acid profiles and antioxidant activity of rice milling fractions. European Food Research and Technology, 233(October), 577–585. https://doi.org/10.1007/s00217-011-1551-4
- Upadhyay, A., Karn, S. K., & Rice, B. (2018). Brown Rice: Nutritional Composition and Health Benefits. J. Food Sci. Technol. Nepal, 10, 48–54.
- Varavinit, S., Shobsngob, S., Varanyanond, W., Chinachoti, P., & Naivikul, O. (2003). Effect of amylose content on gelatinization, retrogradation and pasting properties of flours from different cultivars of thai rice. Starch/Staerke, 55(9), 410–415. https://doi.org/10.1002/star.200300185
- Verma, D. K., & Srivastav, P. P. (2017). Proximate Composition, Mineral Content and Fatty Acids Analyses of Aromatic and Non-Aromatic Indian Rice. Rice Science, 24(1), 21-31. https://doi.org/10.1016/j.rsci.2016.05.005
- Vetha Varshini, P., Azhagu Sundharam, K., & Vijay Praveen, P. (2013). Brown Rice -Hidden Nutrients. Journal of Bioscience and Technology, 4 (1), 503–507. Retrieved from www.jbstonline.com
- Xu, J., Zhang, H., Guo, X., & Qian, H. (2012). The impact of germination on the characteristics of brown rice flour and starch. Journal of the Science of Food and Agriculture, 92(2), 380–387. https://doi.org/10.1002/jsfa.4588
- Ye, L., Wang, C., Wang, S., Zhou, S., & Liu, X. (2016). Thermal and rheological properties of brown flour from Indica rice. Journal of Cereal Science, 70, 270–274. https://doi.org/10.1016/j.jcs.2016.07.007
- Zhang, Q., Xiang, J., Zhang, L., Zhu, X., Evers, J., van der Werf, W., & Duan, L. (2014). Optimizing soaking and germination conditions to improve gamma-aminobutyric acid content in japonica and indica germinated brown rice. Journal of Functional Foods, 10, 283–291. https://doi.org/10.1016/j.jff.2014.06.009
- Zubair, M., Anwar, F., Ali, S., & Iqbal, T. (2012). Proximate composition and minerals profile of selected rice (Oryza sativa L.). Varieties of Pakistan. Asian Journal of Chemistry, 24(1), 417–421. http://www.asianjournalofchemistry.co.in/User/ViewFreeArticle.aspx?ArticleID=24_1_91
- Zubair, M., Anwar, F., Ashraf, M., & Uddin, M. K. (2012). Characterization of high-value bioactives in some selected varieties of Pakistani rice (Oryza sativa L.). International Journal of Molecular Sciences, 13(4), 4608–4622. https://doi.org/10.3390/ijms13044608
- Zubair, M., Anwar, F., & Shahid, S. A. (2012). Effect of extraction solvents on phenolics and antioxidant activity of selected varieties of Pakistani rice (Oryza sativa). International Journal of Agriculture and Biology, 14(6), 935–940. https://www.ncbi.nlm.nih.gov/pmc/articles/PMC3344234/