
ABSTRACT
The effect of blackberry juice processed with microwaves and ultrasound on the biochemical and histopathological profile of Wistar rats fed with high-sucrose+cholesterol diet was evaluated. Rats were divided in five groups: control group (standard diet, protein 18.6%, fat 6.2%, carbohydrate 44.2%, n = 7), S group (standard diet+30% sucrose solution), S + C group (standard diet+30% sucrose solution+1 g/kg cholesterol, n = 7). S + J group (standard diet+30% sucrose solution+ 4.2 mL/kg juice, n = 7), S + C + J group (standard diet+30% sucrose solution+1 g/kg cholesterol+ 4.2 mL/kg of juice, n = 8). Non-processed blackberry juice was not tested. Supplementation with blackberry juice decreased levels of glucose in the serum (17%). Also, it reduced the abdominal and pericardial adipose tissue (P = .001) as well as liver, heart and kidney weight (p < .05). Abdominal adipose tissue and liver histology showed that the juice reduced adipocyte hypertrophy and simple steatosis. Blackberry juice processed with microwaves and ultrasound has potential as bioactive food.
RESUMEN
El propósito de este trabajo fue evaluar el efecto del jugo de zarzamora procesado con microondas y ultrasonido en parámetros bioquímicos, tejido adiposo y esteatosis simple de ratas Wistar alimentadas con una dieta alta en sacarosa + colesterol. Las ratas Wistar fueron divididas en cinco grupos: un grupo control (dieta estándar, proteína 18.6%, grasa 6.2%, carbohidrato 44.2%, n=7), grupo S (dieta estándar+solución de sacarosa al 30%, n=7), grupo S+C (dieta estándar+solución de sacarosa al 30%+colesterol 1g/kg, n=7), grupo S+J (dieta estándar+solución de sacarosa+jugo 4.2 mL/kg, n=7), grupo S+C+J (dieta estándar+solución de sacarosa al 30%+colesterol 1 g/kg+ jugo 4.2 mL/kg, n=8). El jugo disminuyó los niveles de glucosa en sangre (17%). También redujo el peso del tejido adiposo abdominal, pericárdico (P= .001) e hígado, riñón y corazón (p < .05). La histología del tejido adiposo abdominal y del hígado mostró que el jugo es capaz de reducir la hipertrofia del adipocito y la esteatosis simple. El jugo de zarzamora procesado con microondas y ultrasonido tiene potencial como alimento bioactivo.
1. Introduction
Nowadays, an increasingly common sedentary lifestyle and the consumption of carbohydrate- and fat-rich foods are recognized as risk factors in the development of obesity and type-II diabetes. Among the alterations caused by high-carbohydrate and high-cholesterol diets are the accumulation of abdominal fat, hyperlipidemia, hyperinsulinemia, and non-alcoholic fatty liver disease (Ragab et al., Citation2015; Toida et al., Citation1996). Accumulating evidence indicates that dietary compounds such as anthocyanins possess beneficial properties against diseases related to a high-sucrose and high-fat diet, for example, obesity, dyslipidemia and visceral fat (Azzini et al., Citation2017; Wu et al., Citation2018). Berries such as blueberries, cranberries and blackberries are recognized as a rich source of these bioactive compounds. Given the beneficial effects of these compounds and the increasing demand of consumers for food with health-promoting effects, there is an interest in the food industry to develop bioactive juice based on berries with added health benefits, in addition to supplying nutrients. Furthermore, there is a strong consumer demand for juices with minimum processing and no additives. However, a key factor in the development of berries-based bioactive juice is the use of technologies that result in products with a high phenolics content (such as anthocyanins), which can guarantee a beneficial effect on health. Studies on the effects of processing with conventional technologies on polyphenols of berries juice reported a degradation of these compounds, potentially affecting their biological properties. A previous work indicated a lower weight gain and abdominal fat of rats administered with organic grape juice as compared to animals that were given conventional juice; this could be due to the lower content of phenolic compounds in processed grape juice (Dos et al., Citation2018).
Recently, it was reported that the use of microwaves and ultrasound produces a safe blackberry juice with an increased content of bioactive antioxidant compounds, such as anthocyanins as compared to non-processed blackberry juice (Pérez-Grijalva et al., Citation2018). The novelty of this research was the application of microwaves in combination with ultrasound, resulting in an attractive way to obtain high-quality products containing bioactive compounds, such as anthocyanins. The enhancement of bioactive compounds given by microwaves and ultrasound resulted in promissory bioactive food for the juice industry. However, when applying novel technologies in the development of food products with extra benefits, it is important to properly evaluate their health effects. Although there are some reports on the in vivo activity of berry juices (Dos et al., Citation2018), the information about the biological properties of berries-based juice processed with microwaves or/and ultrasound is scarce. Given the above, the present study evaluated only the biological properties of blackberry juice processed with microwaves and ultrasound (Pérez-Grijalva et al., Citation2018), limiting this research to the analysis of blackberry juice processed with microwaves and ultrasound. So, the aim of the present work was to evaluate the effect of blackberry juice on the biochemical and histopathological profile of Wistar rats fed with high-sucrose and high-cholesterol diets.
2. Material and methods
2.1. Material
Blackberries (Rubus americanus) were bought from a local market in the city of Xalapa, Veracruz (Mexico). Blackberries were harvested in Jalacingo, State of Veracruz (Mexico) during springtime. The fruits that were free of external injury and ripe enough for consumption, showing homogeneous color, were selected and stored at – 20ºC. The fruits were mashed and the resulting purée was placed on petri dishes (10 cm diameter x 1 cm height) and heated in a microwave oven at 433 W potency during 60 s (Panasonic, 2450 MHz). Afterwards, the sample was centrifuged (Hettich Universal 32 R, 30 min, 10°C) at 3500 rpm and processed in an ultrasonic homogenizer (CPX 750 model, Sonics and Materials, Inc., Newtown, USA) according to the methodology previously described by Pérez-Grijalva et al. (Citation2018). The total polyphenols and monomeric anthocyanin content of blackberry juice processed with microwaves and ultrasound were described in a previous publication (Pérez-Grijalva et al., Citation2018).
2.2. Animals and experimental design
Male Wistar rats (n = 37), 21 days old, recently weaned, were provided by Harlan Teklad Inc., USA. All experimental procedures were performed according to international ethical guidelines based in the National Institutes of Health “Guide for the Care and Use of Laboratory Animals” (National research Council R. 1978) and official Mexican Guidelines for the Use and Care of Laboratory Animals (NOM-062-ZOO, Citation1999). The project was reviewed by a research committee to make sure it conformed to said standards. All efforts were made to minimize animal discomfort during the study. For the experimental model, the animals were divided into the following groups: control group (C, n = 8) fed with standard-chow diet based on the T2018.15 diet (Harlan Teklad Inc., 18.6% protein, 6.2% fat, carbohydrate 44.2%,), sucrose group (S, n = 14) administrated with a standard-chow diet plus solution of 30% sucrose ad libitum; and sucrose + cholesterol group (S + C, n = 15) which was given a standard-chow diet plus solution of 30% sucrose ad libitum and cholesterol (1 g/kg once daily via oral) during a period of 12 weeks. After 12 weeks and before starting the experimental juice supplementation, animals were checked for serum glucose, triglycerides, total cholesterol, and high-density lipoprotein cholesterol. Then, animals in groups S and S + C that showed serum elevation of glucose, triglyceride, and cholesterol levels were divided into five groups, receiving one of the following diets for four more weeks (): (a) S group that received standard-chow diet plus high-sucrose diet; (b) S + J group that received the standard-chow diet plus 30% sucrose in drinking water and blackberry juice. c) S + C group that received standard-chow diet plus high-sucrose+high cholesterol diet; d) S + C + J group fed with a standard-chow diet, high sucrose+high-cholesterol diet and blackberry juice. The final group was the control, which received a standard-chow diet and drinking water without sucrose. The blackberry juice (4.2 mL/kg) was administered by orogastric cannulation once a day. This juice provides 94% of anthocyanins and 33% of polyphenols intake (Clifford, Citation2000; Scalbert and Williamson, Citation2000). Only blackberry juice processed with microwaves and ultrasound was included in the study (Pérez-Grijalva et al., Citation2018). One limitation of this study is that non-processed blackberry juice was not tested.
Figure 1. Experimental group: Control group (C) fed with a standard diet and water ad libitum; group fed with a standard diet and plus 30% sucrose in drinking water (S); group fed with high-carbohydrate diet and administrated with blackberry juice processed with microwaves and ultrasound 4.2 mL/kg (S + J), group fed with standard diet, 30% sucrose in drinking water and cholesterol 1 g/kg (S + C) and administrated with blackberry juice processed with microwaves and ultrasound 4.2 mL/kg (S + C + J). Non-processed blackberry juice was not tested.
Figura 1. Grupo experimental: Grupo control (C) alimentado con una dieta estándar y agua ad libitum; grupo alimentado con una dieta estándar y con sacarosa al 30% (S); grupo alimentado con sacarosa al 30% y administrado con jugo de zarzamora procesado con microondas y ultrasonido 1 g/kg (S + J), grupo alimentado con dieta estándar, sacarosa al 30% y colesterol (1 g/kg, S + C) y un grupo administrado con dieta estándar, sacarosa al 30%, colesterol (1 g/kg) y jugo de zarzamora procesado con microondas y ultrasonido 4.2 mL/kg (S + C + J). El jugo de zarzamora sin procesar no fue incluido en el estudio
After 4 weeks, animals were anesthetized with sodium pentobarbital (120 mg/kg of weight) and euthanized according to Mexican standards (NOM-062-ZOO, Citation1999). Serum glucose was measured by the glucose oxidase method (Barham & Trinder, Citation1972) and serum triglycerides were determined by colorimetric analysis using a peroxide-coupled method (McGowan et al., Citation1983). Total cholesterol was evaluated in the serum using an enzymatic assay (Assmann, Citation1979). Serum high-density lipoprotein (HDL) was analyzed with phosphotungstic acid in the presence of Mg2+ (Finley et al., Citation1978), while livers, hearts, kidneys, spleen, abdominal, pericardial, and epididymal fatty tissue were extracted and weighed. For the histology of liver and adipose tissue, the organs were covered in paraffin and cut with a microtome. Paraffin sections were deparaffinized in xylene for 3 min, and rehydrated through graded ethanol solutions (80%, and 90% 96% ethanol). Cuts were fixed onto slides and stained primarily with hematoxylin and counterstained with eosin for light microscopic analysis.
2.3. Statistical analysis
The weight of organs and fatty tissue, as well as the serum biochemical parameters were analyzed using Generalised Linear Model (GLM) we fit unifactorial one-way ANOVA, were Poisson error distributions (which assumes that the variance is equal to the mean), also we used log link with GLM (Bolker et al. Citation2009; Crawley, Citation1993), which means that there is no normal distribution in the response variables used in the study. A priori and as suggested by Zar (Citation1999), the Shapiro–Wilk test was performed to verify the assumption of normal error distribution in each response variable, with its corresponding set of statistical hypotheses and the differences between the distribution of observed and expected frequencies for all variables (P < .0001), and there was no homogeneity of variances verified with the Levene test (P < .0001). So when violating the assumptions of the parametric ANOVA test, we opted for a Poisson error distribution model for the variables that had an adjustment of equality of observed and expected frequencies (P = .05). The multiple comparisons were carried whit test for pair-wise comparisons between means, which are plotted are their standard error bars as indicated (Cumming et al., Citation2007). All analyses were performed using Statistica 7 StatSoft Inc. Tulsa, OK, USA.
3. Results and discussion
3.1. Biochemical parameters, adipose tissue and organs
In the present study, the administration of blackberry juice resulted a decrease of serum glucose in group S + J as compared to S group (17%, (); however, it was not statistically significant (p = .14). It is noteworthy that data point out that the consumption of blackberry juice does not increase glycemic levels in the blood. Glucose decrease in animals consuming blackberry juice is attributed to the presence of anthocyanins. Previous studies suggest that anthocyanin-rich extracts can modify lipid and glucose metabolism (Guo et al., Citation2011; Seymour et al., Citation2011), since these compounds may alter the activity of the PPARγ (peroxisome proliferator-activated receptor gamma), resulting in an increased expression of the adiponectin gene, which plays a very important role in adipocyte distribution and insulin resistance (Seymour et al., Citation2011). On the other hand, in the present study serum triglycerides, total cholesterol, and HDL cholesterol concentrations were not influenced by the blackberry juice consumption (P= .56, P = .49 y P = .78, respectively) (); this finding is in agreement with a previous study in which mice with a high-fat diet were supplemented with purple maize (Tsuda et al., Citation2003).
Figure 2. Serum glucose, triglycerides, total cholesterol and HDL cholesterol concentrations in control and experimental groups. Control group (C) fed with a standard diet and water ad libitum; group fed with a standard diet and plus 30% sucrose in drinking water (S); group fed with high-carbohydrate diet and administrated with blackberry juice processed with microwaves and ultrasound 4.2 mL/kg (S + J), group fed with standard diet, 30% sucrose in drinking water and cholesterol 1 g/kg (S + C) and administrated with blackberry juice processed with microwaves and ultrasound 4.2 mL/kg (S + C + J). Non-processed blackberry juice was not tested. Each graph represents the result of the adjustment of the univariate ANOVA model and multiple comparisons were performed using an alpha value 0.05. Different letters on the bars indicate the differences between the average values (standard error).
Figura 2. Concentraciones de glucosa, triglicéridos, colesterol total y colesterol-HDL en suero en grupo control y experimental. Grupo experimental: Grupo control (C) alimentado con una dieta estándar y agua ad libitum; grupo alimentado con una dieta estándar y con sacarosa al 30% (S); grupo alimentado con sacarosa al 30% y administrado con jugo de zarzamora procesado con microondas y ultrasonido 4.2 mL/kg (S + J), grupo alimentado con dieta estándar, sacarosa al 30% y colesterol (1 g/kg, S + C) y un grupo administrado con dieta estándar, sacarosa al 30%, colesterol (1 g/kg) y jugo de zarzamora procesado con microondas y ultrasonido 4.2 mL/kg (S + C + J). El jugo de zarzamora sin procesar no fue incluido en el estudio. Cada gráfica representa el resultado del ajuste del modelo de ANOVA unifactorial y las comparaciones múltiples fueron realizadas utilizando un valor de alfa 0.05. Letras diferentes sobre las barras indican las diferencias entre los valores promedios (± error estándar)
The administration of a high-sucrose diet (S) and sucrose + cholesterol (S + C) resulted in an increase of the adipose abdominal, pericardial and epidydimal tissues as compared to the control (). Rats supplemented with blackberry juice showed less adipose abdominal and pericardial tissue (P = .001). A previous study reported that rats fed with a high-fat diet and supplemented with an extract rich in cyanidin-3-glucoside (C3 G) showed less accumulation of adipose tissue, revealing the anti-obesity effect of this anthocyanin (Tsuda, Citation2008).
Figure 3. Abdominal, epididymal and pericardial adipose tissue weight in control and experimental groups. Control group (C) fed with a standard diet and water ad libitum; group fed with a standard diet and plus 30% sucrose in drinking water (S); group fed with high-carbohydrate diet and administrated with blackberry juice processed with microwaves and ultrasound 4.2 mL/kg (S + J), group fed with standard diet, 30% sucrose in drinking water and cholesterol 1 g/kg (S + C) and administrated with blackberry juice processed with microwaves and ultrasound (S + C + J). Non-processed blackberry juice was not tested. Each graph represents the result of the adjustment of the univariate ANOVA model and multiple comparisons were performed using an alpha value 0.05. Different letters on the bars indicate the differences between the average values (standard error).
Figura 3. Peso de tejido adiposo abdominal, epididimal y pericárdico en el grupo control y experimental. Grupo experimental: Grupo control (C) alimentado con una dieta estándar y agua ad libitum; grupo alimentado con una dieta estándar y con sacarosa al 30% (S); grupo alimentado con sacarosa al 30% y administrado con jugo de zarzamora procesado con microondas y ultrasonido 4.2 mL/kg (S + J), grupo alimentado con dieta estándar, sacarosa al 30% y colesterol (1 g/kg, S + C) y un grupo administrado con dieta estándar, sacarosa al 30%, colesterol (1 g/kg) y jugo de zarzamora procesado con microondas y ultrasonido 4.2 mL/kg (S + C + J). El jugo de zarzamora sin procesar no fue incluido en el estudio. Cada gráfica representa el resultado del ajuste del modelo de ANOVA unifactorial y las comparaciones múltiples fueron realizadas utilizando un valor de alfa 0.05. Letras diferentes sobre las barras indican las diferencias entre los valores promedios (± error estándar)
Regarding the weight of the organs, in the present study, significant differences were observed between the weight of the liver (χ2 = 28, P = .00001), kidney, heart and spleen (ρ < 0.05) of control group and S and S + C groups (). It is well known that the liver is one of the main organs affected by obesity, hyperglycemia and dyslipidemia, since hepatocytes store the excess of fat characteristic of these pathologies, increasing the size and weight of the liver and resulting in non-alcoholic fatty liver disease. In the present study, non-alcoholic fatty liver disease was also discovered by visual observation and histology techniques ()). Recent studies point out that the addition of cholesterol to high-fat diet results in non-alcoholic fatty liver disease because cholesterol modifies the hepatic lipid metabolism at the molecular level (Ichimura et al., Citation2015). The administration of blackberry juice caused significant differences (ρ < 0.05) in the weight of the liver, heart and kidney among group S and S + J. In other words, the organs of rats that received the juice weighted less than their counterparts.
Figure 4. Liver, heart, kidney and spleen weight in control and experimental groups. Control group (C) fed with a standard diet and water ad libitum; group fed with a standard diet and plus 30% sucrose in drinking water (S); group fed with high-carbohydrate diet and administrated with blackberry juice processed with microwaves and ultrasound 4.2 mL/kg (S + J), group fed with standard diet, 30% sucrose in drinking wáter and cholesterol 1 g/kg (S + C) and administrated with blackberry juice processed with microwaves and ultrasound 4.2 mL/kg (S + C + J). Non-processed blackberry juice was not tested. Each graph represents the result of the adjustment of the univariate ANOVA model and multiple comparisons were performed using an alpha value 0.05. Different letters on the bars indicate the differences between the average values (standard error).
Figura 4. Peso de hígado, corazón, riñón y páncreas del grupo control y experimental. Grupo experimental: Grupo control (C) alimentado con una dieta estándar y agua ad libitum; grupo alimentado con una dieta estándar y con sacarosa al 30% (S); grupo alimentado con sacarosa al 30% y administrado con jugo de zarzamora procesado con microondas y ultrasonido 4.2 mL/kg (S + J), grupo alimentado con dieta estándar, sacarosa al 30% y colesterol (1 g/kg, S + C) y un grupo administrado con dieta estándar, sacarosa al 30%, colesterol (1 g/kg) y jugo de zarzamora procesado con microondas y ultrasonido 4.2 mL/kg (S + C + J). El jugo de zarzamora sin procesar no fue incluido en el estudio. Cada gráfica representa el resultado del ajuste del modelo de ANOVA unifactorial y las comparaciones múltiples fueron realizadas utilizando un valor de alfa 0.05, Letras diferentes sobre las barras indican las dierencias entre los valores promedios (± error estándar)
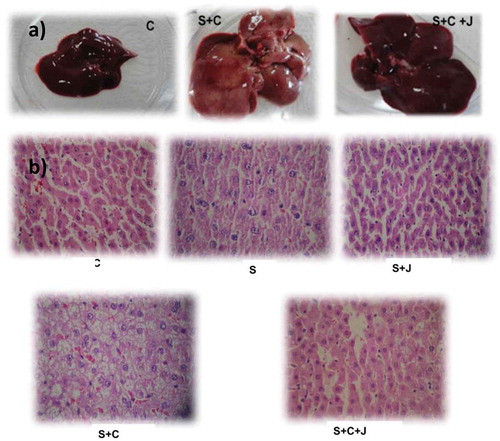
Figure 5. Livers extracted (a) and photomicrograph (b) showing rat liver of control and experimental groups. Control group (C) fed with a standard diet and water ad libitum; group fed with a standard diet and plus 30% sucrose in drinking water (S); group fed with high-carbohydrate diet and administrated with blackberry juice processed with microwaves and ultrasound 4.2 mL/kg (S + J), group fed with standard diet, 30% sucrose in drinking water and cholesterol 1 g/kg (S + C) and administrated with blackberry juice (S + C + J) processed with microwaves and ultrasound 4.2 mL/kg. Non-processed blackberry juice was not tested.
Figura 5. Hígados extraídos and micrografía del hígado del grupo control y experimental. Grupo experimental: Grupo control (C) alimentado con una dieta estándar y agua ad libitum; grupo alimentado con una dieta estándar y con sacarosa al 30% (S); grupo alimentado con sacarosa al 30% y administrado con jugo de zarzamora (S + J) procesado con microondas y ultrasonido 4.2 mL/kg, grupo alimentado con dieta estándar, sacarosa al 30% y colesterol (1 g/kg, S + C) y un grupo administrado con dieta estándar, sacarosa al 30%, colesterol (1 g/kg) y jugo de zarzamora procesado con microondas y ultrasonido 4.2 mL/kg (S + C + J). El jugo de zarzamora sin tratar no fue incluido en el estudio
Interestingly, we can see that blackberry juice consumption modulates one or more targeted functions related with high-sucrose and high-cholesterol diet, which could be attributed to the presence of phenolic compounds. The phenolic compounds identified in experimental blackberry juice processed with microwaves and ultrasound (Rubus americanus) were caffeic, ferulic, gallic and p-cumaric acids as well as flavonols like quercetin and catechin. In addition, cyanidin and pelargonidin were also identified (Pérez-Grijalva et al., Citation2018).
On the hand, the beneficial effect of blackberry juice could also be attributed to its content of bioactive compounds. Several studies indicate that an adequate intake of polyphenol compounds can induce beneficial health effects, for example, the administration of cranberry juice with high levels of anthocyanins (5.9 mg/kg) caused an increase in organ antioxidant capacity in an animal model. For the present study, if we consider the anthocyanins recommended intake to be 2.5 mg/kg/day, 4.2 mL of this juice provides 3.5 mg of anthocyanins mg/kg/day (Clifford, Citation2000; Pérez-Grijalva et al., Citation2018). In contrast, non-processed blackberry juice provides 1.2 mg/kg/day of the recommended amounts of anthocyanins, the data of anthocyanin analysis have been described in detail elsewhere (Pérez-Grijalva et al., Citation2018). Given the above, in the present study, only blackberry juice processed with non-conventional technologies was used; however, further studies are required to clarify the biological properties of non-processed blackberry juice (Pérez-Grijalva et al., Citation2018). Despite the limitation of the study, other studies have reported that the administration of blackberry juice with low levels of anthocyanins (2.6 mg/kg) exerted no significant effects on anxiety-like behavior (Fernández-Demeneghi et al., Citation2019). In addition, an interventional study on obese men and women who received twice daily a smoothie with blueberry (45 g of powder contained 668 mg of anthocyanins) for 6 weeks improved insulin sensitivity (Stull et al., Citation2010). It can be noted that the concentration of monomeric anthocyanins previously reported for non-processed blackberry juice was 290 mg C3GE/L (Pérez-Grijalva et al., Citation2018).
3.2. Histology of the liver and abdominal adipose tissue
With the aim of evaluating the effect of blackberry juice on liver and abdominal adipose tissue, a histological analysis was carried out. Liver histology ()) revealed normal hepatocytes in rats from group C, while rats in group S and S + C showed enlarged hepatocytes due to the intracellular accumulation of triglycerides (simple steatosis), which is the first stage in the non-alcoholic fatty liver disease. This agrees with the report by Yang et al. (Citation2012), who observed simple steatosis in rats fed a high-fat and sucrose diet. It was also observed that steatosis improved significantly in rats treated with blackberry juice (groups S + J and S + C + J) ()). Recent studies showed that anthocyanin-rich foods improve hepatic steatosis (Guo et al., Citation2012) and suppress lipogenesis (Tsuda, Citation2008). In addition, previous data indicate that cyanidin significantly reduced cellular lipid concentrations in lipid-loaded steatotic hepatocytes, this compound has been identified in blackberry juice by our group (Pérez-Grijalva et al., Citation2018).
As mentioned above, in the current study non-processed blackberry juice was not tested; however, a previous work reported that blueberry juice with anthocyanin concentration of 0.98 mg mL in combination with probiotics alleviated non-alcoholic fatty liver disease (Zhu et al., Citation2018). According to a previous work reported by our group, the anthocyanin concentration in blackberry juice processed with microwaves and ultrasound was 0.83 mg/mL, while non-processed blackberry juice provides 0.29 mg/mL of anthocyanins (Pérez-Grijalva et al., Citation2018).
On the other hand, several studies suggest a relationship between adipose tissue and liver diseases (Parke, Citation2018). According to several studies, there is a relationship between body mass index, degree of steatosis, and the severity of the hepatic lesion. However, distribution of body fat seems to be more relevant to the development of steatosis than the total adipose mass. Other studies indicate that the fatty infiltration of the liver is correlated to abdominal fat (Silveira et al., Citation2013). Therefore, in the present study histology of abdominal fatty tissue was made (). Hypertrophy, which is an increase in the size of adipocytes, was observed as a result of diets high in cholesterol and sucrose; however, it was less evident in groups S + J and S + C + J, suggesting that polyphenols help normalize the size of adipocytes. The experimental blackberry juice had a high content of total polyphenols and monomeric anthocyanins according to the study by our research group (Pérez-Grijalva et al., Citation2018). We are aware of the limitations of our study regarding the lack of an experimental group administrated with non-processed blackberry; however, it is noteworthy that previous studies on the supplementation of blueberry juice and mulberry juice with high levels of polyphenols (6.39 mg GAE/mL and 33.14 mg GAE/mL, respectively) attenuated lipid accumulation in 57BL/6 mice were fed a high-fat diet (Wu et al., Citation2013). In contrast, non-processed blackberry juice provides 1.6 mg/mL of polyphenols according to data reported by our research group (Pérez-Grijalva et al., Citation2018).
Figure 6. Histological analysis of abdominal adipose tissue in control and experimental groups. Control group (C) fed with a standard diet and water ad libitum; S group fed with a standard diet and plus 30% sucrose in drinking water (S); S + J group fed with high-carbohydrate diet and administrated with blackberry juice processed with microwaves and ultrasound 4.2 mL/kg, S + C group fed with standard diet, 30% sucrose in drinking water and cholesterol 1 g/kg and administrated with blackberry juice processed with microwaves and ultrasound 4.2 mL/kg (S + C + J). Non-processed blackberry juice was not tested.
Figura 6. Análisis histológico del tejido adiposo abdominal del grupo control y experimental. Grupo experimental: Grupo experimental: Grupo control (C) alimentado con una dieta estándar y agua ad libitum; grupo alimentado con una dieta estándar y con sacarosa al 30% (S); grupo alimentado con sacarosa al 30% y administrado con jugo de zarzamora procesado con microondas y ultrasonido 4.2 mL/kg (S + J), grupo alimentado con dieta estándar, sacarosa al 30% y colesterol (1 g/kg, S + C) y un grupo administrado con dieta estándar, sacarosa al 30%, colesterol (1 g/kg) y jugo de zarzamora procesado con microondas y ultrasonido 4.2 mL/kg (S + C + J). El jugo de zarzamora sin tratar no fue incluido en el estudio
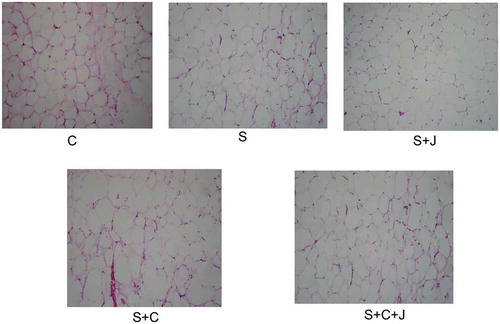
In addition, it has been reported that anthocyanins enter adipocyte tissue and enhance adiponectin and leptin secretion (Felgines et al., Citation2009). A similar result was reported by Tsuda (Citation2008), who demonstrated that the administration of cyanidin-3-glucoside to animals fed with a high-fat diet suppressed the storage of fat in the adipose tissue and hypertrophy of the same.
4. Conclusion
This work showed that blackberry juice consumption may reduce metabolic risks associated with a high-sucrose and high cholesterol diet. Blackberry juice decreased serum glucose, abdominal and liver, weight. Additionally, abdominal adipose tissue and liver histology showed that the juice is capable of reversing adipocyte hypertrophy and simple steatosis. Therefore, blackberry juice processed with microwaves and ultrasound is a potential bioactive food with health benefits; however, future studies should consider non-processed blackberry juice in order to better understand its biological properties.
Disclosure statement
No potential conflict of interest was reported by the author(s).
Additional information
Funding
References
- Assmann, G. (1979). HDL-cholesterol precipitant. Randox Labs. Ltd. Crumlin Co. Antrim, N. Ireland. Internist, 20, 559–564.
- Azzini, E., Giacometti, J., & Russo, G. L. (2017). Antiobesity effects of anthocyanins in preclinical and clinical studies. Oxidative Medicine and Cellular Longevity, (2017), 11. doi:10.1155/2017/2740364
- Barham, D., & Trinder, P. (1972). An improved colour reagent for the determination of blood glucose by the oxidase system. Analyst, 97(151), 142–145. https://doi.org/10.1039/an9729700142
- Bolker, B. M., Brooks, M. E., Clark, C. J., Geange, S. W., Poulsen, J. R., Stevens, M. H. H., & White, J. S. S. (2009). Generalized linear mixed models: A practical guide for ecology and evolution. Trends in Ecology & Evolution, 24(3), 127–135. https://doi.org/10.1016/j.tree.2008.10.008
- Clifford, M. N. (2000). Anthocyanins- nature, occurrence and dietary burden. Journal of Food Science and Agricultural, 80(7), 1063–1072. https://doi.org/10.1002/(SICI)1097-0010(20000515)80:71063::AID-JSFA60530CO2Qicporder
- Crawley, M. J. (1993). GLIM for Ecologists. Blackwell, Scientific Publications.
- Cumming, G., Fidler, F., & Vaux, D. L. (2007). Error bars in experimental biology. Journal of Cell Biology, 177(1), 7–11. https://doi.org/10.1083/jcb.200611141
- Dos,, Santos, L. D., Garbin.A., M., Teixeira, C., De Jesus, A., D Silva A, J. É., Martins, B. P., Pegas, H. J. A., Gomez, R., Dani, C., & Funchal, C. (2018). Biochemical and physiological parameters in rats fed with high-fat diet: The protective effect of chronic treatment with purple grape juice (Bordo Variety). Beverages, 4(4), 100. https://doi.org/10.3390/beverages4040100
- Felgines, C., Texier, O., Garcin, P., Besson, C., & Lamaison, J. L. (2009). Tissue distribution of anthocyanins in rats fed a blackberry anthocyanin-enriched diet. Molecular Nutrition & Food Research, 53(9), 1098–1103. https://doi.org/10.1002/mnfr.200800323
- Fernández-Demeneghi, R., Vargas-Moreno, I., Acosta-Mesa, H.-G., Puga-Olguín, A., Campos-Uscanga, Y., Romo-González, T., Guzmán-Gerónimo, R.-I., Patraca-Camacho, L., & Herrera-Meza, S. (2019). Effect of blackberry juice (Rubus fruticosus L.) on anxiety-like behaviour in Wistar rats. International Journal of Food Sciences and Nutrition, 70(7), 856–867. https://doi.org/10.1080/09637486.2019.1580680
- Finley, P. R., Schifman, R. B., Williams, R. J., & Lichti, D. A. (1978). Cholesterol in high-density lipoprotein: Use of Mg2+/dextran sulfate in its enzymic measurement. Clinical Chemistry, 24(6), 931–933. https://doi.org/10.1093/clinchem/24.6.931
- Guo, H., Xia, M., Zou, T., Ling, W., Zhong, R., & Zhang, W. (2012). Cyanidin 3-glucoside attenuates obesity-associated insulin resistance and hepatic steatosis in high-fat diet-fed and db/db mice via the transcription factor FoxO1. Journal of Nutritional Biochemistry, 23(4), 349–360. https://doi.org/10.1016/j.jnutbio.2010.12.013
- Guo, H. L. D., Ling, W., Feng, X., & Xia, M. (2011). Anthocyanin inhibits high glucose induced hepatic mtGPAT1 activation and prevents fatty acid synthesis through PKCζ. Journal of Lipid Research, 52(5), 908–922. https://doi.org/10.1194/jlr.M013375
- Ichimura, M., Kawase, M., Masuzumi, M., Sakaki, M., Nagata, Y., Tanaka, K., Suruga, K., Tamaru, S., Kato, S., Tsuneyama, K., & Omagari, K. (2015). High-fat and high-cholesterol diet rapidly induces non-alcoholic steatohepatitis with advanced fibrosis in Sprague-Dawley rats. Hepatology Research, 45(4), 458–469. https://doi.org/10.1111/hepr.12358
- McGowan, M. W., Artiss, J. D., Strandbergh, D. R., & Zak, B. (1983). A peroxidase-coupled method for the colorimetric determination of serum triglycerides. Clinical Chemistry, 29(3), 538–542. https://doi.org/10.1093/clinchem/29.3.538
- NOM-062-ZOO. (1999). Mexican Official Norm. Especificaciones técnicas para la producción, cuidado y uso de los animales de laboratorio. Secretaría de Agricultura, Ganadería, Desarrollo Rural, Pesca y Alimentación. doi:10.1093/jn/130.8.2073S
- Parke, R. (2018). The role of adipose tissue in fatty liver diseases. Liver Research, 2(1), 35–42. https://doi.org/10.1016/j.livres.2018.02.002
- Pérez-Grijalva, B., Herrera-Sotero, M., Mora-Escobedo, R., Zebadúa-García, J. C., Silva Hernández, E., Oliart-Ros, R., Pérez-Cruz, C., & Guzmán-Gerónimo, R. (2018). Effect of microwaves and ultrasound on bioactive compounds and microbiological quality of blackberry juice. LWT-Food Science & Technology, 87(1), 47–53. https://doi.org/10.1016/j.lwt.2017.08.059
- Pérez-Grijalva, P., Herrera-Sotero, M., Mora-Escobedo, R., Zebadúa-García, J. C., Silva-Hernández, E., Oliart-Ros, R., Pérez-Cruz, P., & Guzmán-Gerónimo, R. I. (2018). Effect of microwaves and ultrasound on bioactive compounds and microbiological quality of blackberry juice. LWT-Food Science and Technology, 87(1), 47–53. doi:10.1155/2017/2740364
- Ragab, M. M. S., Elghaffar, S. K. A., El-Metwally, T. H., Badr, G., Mahmoud, M. H., & Hossam, M. O. (2015). Effect of a high fat, high sucrose diet on the promotion of non-alcoholic fatty liver disease in male rats: The ameliorative role of three natural compounds. Lipid in Health and Disease, 14(83), 83–93. https://doi.org/10.1186/s12944-015-0087-1
- Scalbert, A., & Williamson, G. (2000). Dietary intake and bioavailability of polyphenols. Journal of Nutrition, 130(8), 2073S–2085S. https://doi.org/10.1093/jn/130.8.2073S
- Seymour, E., Tanone, I., Urcuyo-Llanes, D., Lewis, S., Kirakosyan, A., Kondoleon, M., Kaufman, P., & Bolling, S. (2011). Blueberry intake alters skeletal muscle and adipose tissue peroxisome proliferator-activated receptor activity and reduces insulin resistance in obese rats. Journal of Medicinal Food, 14(12), 1511–1518. doi:10.1089/jmf.2010.0292
- Silveira, L. S., Monteiro, P. A., Antunes, B. M., Seraphim, P. M., Fernandes, R. A., Christofaro, D. G., & Freitas, J. I. F. (2013). Intra-abdominal fat is related to metabolic syndrome and non-alcoholic fat liver disease in obese youth. Pediatrics, 13(113), 1–6. doi:10.1186/1471-2431-13-115
- Stull, A. J., Cash, K. C., Johnson, W. D., Champagne, C. M., & Cefalu, W. T. (2010). Bioactives in blueberries improve insulin sensitivity in obese, insulin-resistant men and women. Journal of Nutrition, 140(10), 1764–1768. https://doi.org/10.3945/jn.110.125336
- Toida, S., Takahashi, M., Shimizu, H., Sato, N., Shimomura, Y., & Kobayashi, I. (1996). Effect of high sucrose feeding on fat accumulation in the male Wistar rat. Obesity Research, 4(6), 561–568. https://doi.org/10.1002/j.1550-8528.1996.tb00270.x
- Tsuda, T. (2008). Regulation of adipocyte function by anthocyanins; possibility of preventing the metabolic syndrome. Journal of Agricultural and Food Chemistry, 56(3), 642–646. https://doi.org/10.1021/jf073113b
- Tsuda, T., Horio, F., Uchida, K., Aoki, H., & Osawa, T. (2003). Dietary cyanidin 3-0-beta D-glucoside rich purple corn color prevents obesity and ameliorates hyperglycemia in mice. Journal of Nutrition, 133(7), 2125–2130. https://doi.org/10.1093/jn/133.7.2125
- Wu, T., Gao, Y., Guo, X., Zhang, M., & Gong, L. (2018). Blackberry and blueberry anthocyanin supplementation counteract high-fat-diet-induced obesity by alleviating oxidative stress and inflammation and accelerating energy expenditure. Oxidative Medicine and Cellular Longevity, 2018, 9. https://doi.org/10.1155/2018/4051232
- Wu, T., Tang, Q., Gao, Z., Yu, Z., Song, H., Zheng, X., & Chen, W. (2013). Blueberry and mulberry juice prevent obesity development in C57BL/6 mice. PloS One, 8(10), e77585. https://doi.org/10.1371/journal.pone.0077585
- Yang, Z., Miyahara, H., Takeo, J., & Katayama, M. (2012). Diet high in fat and sucrose induces rapid onset of obesity-related metabolic syndrome partly through rapid response of genes involved in lipogenesis, insulin signalling and inflammation in mice. Diabetology & Metabolic Syndrome, 4(32), 32–41. https://doi.org/10.1186/1758-5996-4-32
- Zar, J. H. (1999). Biostatistical Analysis. Prentice Hall.
- Zhu, J., Zhou, M., Zhao, X., Mu, M., & Cheng, M. (2018). Blueberry, combined with probiotics, alleviates non-alcoholic fatty liver disease via IL-22-mediated JAK1/STAT3/BAX signaling. Food Function, 9(12), 6298–6306. https://doi.org/10.1039/C8FO01227J