
 ?Mathematical formulae have been encoded as MathML and are displayed in this HTML version using MathJax in order to improve their display. Uncheck the box to turn MathJax off. This feature requires Javascript. Click on a formula to zoom.
ABSTRACT
Dehydration effect on chicken breast physicochemical properties at different temperatures (45, 55, and 65°C) was determined using an electric oven at natural convection and a forced convective dehydrator. Protein content increased from 21.01% and 32.42% (raw and cooked chicken, respectively) to up to 80%. A low-fat content (2.55%) resulted in cooked chicken samples at 65°C in a forced convective dehydrator. The color difference (∆E) of the cooked chicken breast was found to be higher (19.39 to 21.36) in the oven. The highest dehydration time for raw and cooked chicken breast in a forced convection dryer at 45°C, 55°C and 65°C were 7 h, 6 h and 5 h, and 6 h, 4 h, and 3 h, respectively. Page, modified page, and logarithmic models were that the best represented the experimental data with r2 values ranged from 0.9999 to 0.9928.
RESUMEN
El efecto de la deshidratación sobre las propiedades fisicoquímicas de pechuga de pollo a diferentes temperaturas (45, 55, y 65°C) fue determinada utilizando un horno eléctrico con convección natural y un deshidratador de convección forzada. El contenido de proteínas incrementó de 21.01% y 32.42% (pollo crudo y cocido, respectivamente) hasta 80%. Un contenido bajo en grasa (2.55%) resultó en muestras de pollo cocido a 65°C en el deshidratador de convección forzada. La diferencia de color (∆E) de la pechuga de pollo cocida fue mayor (19.39 a 21.36) en el horno. El tiempo de deshidratación más alto para la pechuga de pollo cruda y cocida en el secador de convección forzada a 45°C, 55°C y 65°C fueron 7 h, 6 h y 5 h, y 6 h, 4 h, y 3 h, respectivamente. Los modelos de Page, Page modificado y logarítmico fueron los que mejor representaron los datos experimentales con valores de r2 que oscilaron entre 0.9999 y 0.9928.
1. Introduction
Chicken is a source of lean, low-fat protein, and hence healthier in comparison with other types of meat. Moreover, it is less expensive, fast-growing, tasteful, and as a result, the most popular kind of food. Worldwide, meat consumption is estimated at approximately 93,804 million tons per year, and in Mexico, consumption reached 8.8 million tons; of this amount, 47% represents chicken meat and it is the most consumed protein in the country (Consejo Mexicano de la Carne, Citation2018). The quality of chicken is commonly examined using samples from the chicken breast, depending on the physical and chemical characteristics, freshness being the most critical factor (Hii et al., Citation2014; Taheri-Garavand et al., Citation2019). In the poultry industry, different methods have been used to extend the shelf life of chicken meat; the most useful are modified atmosphere packaging (Hulankova et al., Citation2018), refrigeration and freezing (Fabre et al., Citation2014), irradiation (Moreno-Temprado, Citation2005; Sajid-Arshad et al., Citation2019; Suárez, Citation2001), additives (Aymerich et al., Citation2000; Demir et al., Citation2005). Despite that, different microorganisms such as bacteria, parasites, viruses can cause diseases in consumers (Sajid-Arshad et al., Citation2019). Bacteria are responsible for more than 90% of diseases (Secretaría de Agricultura, Ganadería, Desarrollo Rural, Pesca y Alimentación, Citation2013). According to Fuente-Salcido and Barboza Corona (Citation2010), food safety risks can be minimized by following some essential storage, preparation and cooking practices. Chicken meat is a perishable food and, therefore, should not be kept at room temperature for more than two hours (Charlton et al., Citation2008). Drying is a method used in food products, and it offers benefits not only as a method of preservation, but also reduces packaging and transportation costs by reducing weight and volume (Pilatowsky-Figueroa & García-Valladares, Citation2017). Currently, dried meat products can be easily incorporated into food formulations and preparation; for example, cubes of dried meat, flours, snacks, instant food, or cookies. Dehydrated chicken meat could be incorporated in the preparation of food in zones where the chicken meat is not easy to obtain as hospitals in rural areas for patient food, school breakfast, and in government programs to reduce child malnutrition. In addition to this, it is intended to introduce dehydrated chicken meat as a nutritious snack ready for eating. Nowadays, the industrial manufacturing of dried chicken meat products is performed by hot air drying (Ran et al., Citation2019), freeze-drying (Ramírez Nava, Citation2006), superheated steam drying (Sa-adcom et al., Citation2011), microwave-assisted freeze-drying (Duan et al., Citation2010), and spray-drying (Kurozawa et al., Citation2009). The qualities of dried meats are also greatly affected by drying techniques, especially in terms of color, texture, shrinkage, porosity, and rehydration capacity (Hii et al., Citation2014). Although limited studies have been performed on dehydration of chicken meat (Hii et al., Citation2014; Kurozawa et al., Citation2011; Ran et al., Citation2019), the effect of dehydration temperature and natural or convective drying on physicochemical properties such as fat content, protein content and color parameters at the end of the dehydration process has been largely overlooked. In this context, the present work was aimed to study the influence of the dehydration kinetics on the physicochemical properties of chicken breast such as protein and fat content. The dehydration temperature domain established was 45°C, 55°C and 65°C, to avoid possible deterioration due to high temperature exposition and the possibility of integrating solar drying in future work.
2. Material and methods
2.1. Raw material
The chicken breast was obtained from a selected farm chicken meat producer located in the state of Morelos, México. The physicochemical properties of raw and cooked chicken breast meat are shown in . The chicken breast was cooked for 15 minutes in boiling water to eliminate any harmful bacteria for food safety prior to dehydration. After cooking, the chicken breast was cut in thin strips of 10 cm long x 0.3 cm thickness x 1.3 cm width approximately.
Table 1. Characterization of chicken breast.
Tabla 1. Caracterización de pechuga de pollo.
2.2. Drying process
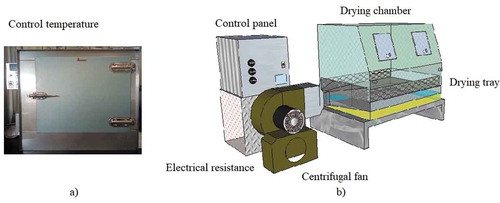
An electric oven at natural convection (Model RIOSA HCFD-48x48, adjustable temperature 5–220°C, ±0.1°C, 14 Amperes) and a forced convection dehydrator designed and evaluated in the Instituto de Energías Renovables UNAM, México, with air velocity at 3, 4.5, and 6 m/s, were established in order to determine the effect of temperature and air velocity on the dehydration kinetics. The schematic diagrams of the dryers have been shown in . The chicken breast was dehydrated at three different temperatures, 45, 55, and 65°C (range of temperatures that occur in solar-dried products) not only to preserve the quality of the meat but also to consider solar drying temperatures in future studies.
Figure 1. Schematic illustration of electric oven at natural convection and forced convective dehydrator.
Figura 1. Ilustración esquemática de horno eléctrico a convección natural y deshidratador de convección forzada.
2.3. Analytical methods
The meat moisture content was measured using a thermobalance (OHAUS, MB45, with a readability 0.001 g) at 105°C, which contained a chicken sample of approximately 3 g. The weight loss was registered on an Ohaus balance (1,500 g capacity with a readability of 0.01 g). The water activity (aw) of the dried samples was determined at 25°C using a Rotronic water activity meter (Higrolab C1). The color of the samples was measured by a portable colorimeter (High-Quality Colorimeter NR60CP). The color parameter was determined by reflectance and expressed in terms of the parameters L* (whiteness-darkness), a*(redness-greenness), b*(yellowness-blueness), H*(hue angle) property of color, and C* (Chroma) saturation or intensity. The protein content was determined by the standard Kjeldahl method, using a Hanon Instrument device (digester and distiller SH420) and multiplying the nitrogen value by the factor of 6.25 (NMX-F-068-S-Citation1980). The fat content of chicken breast was determined by the Soxhlet extraction method (Domínguez-Niño et al., Citation2016). All analytical determinations were conducted in triplicate.
2.4. Moisture ratio calculation
In order to observe the dehydration behavior of the chicken breast, the dimensionless moisture ratio (Mr) was calculated and fitted into different models (Table S1), using the following equation:
where M is the moisture content of breast chicken during the dehydration process, Mo is the initial moisture content of the product, and Me is the equilibrium moisture content. The fit of the models to experimental results was evaluated with the coefficient (r2), the reduced chi-square (χ2), and the root means square error (RMSE). The model that best represents the drying process must have higher values of r2, and lower values of χ2, and RMSE.
3. Results and discussions
3.1. Physicochemical characterization of chicken breast
The results indicate that moisture content and water activity values were higher in the raw than cooked chicken breast, because water is forced out as the meat is cooked. Özcan and Bozkurt (Citation2015) reported similar findings during the study of the physical and chemical properties of meat using different cooking methods. Their results demonstrated that moisture content values of samples regularly decreased with time during the processing from 75.39 to 51.64%. The initial moisture content and water activity values of raw and cooked chicken breast measured as 77.19% and 0.98, and 67.58% and 0.96, respectively. According to Norbrillinda et al. (Citation2016) and Luna-Solano et al. (Citation2019), perishable food has high moisture content and water activity values; therefore, food is susceptible to microorganism growth and chemical degradation. The fat content of raw and cooked chicken breast was 0.60 and 0.18%, respectively (). The fat content in raw chicken breast tends to be higher than in cooked breast because of dripping of fat during the processing (Liao et al., Citation2010). According to the literature, chicken breast meat has a lower fat content and is generally perceived as a healthier meat option by consumers (Hii et al., Citation2014; Liao et al., Citation2010; Ran et al., Citation2019). On the other hand, the color parameters revealed that raw chicken breast tends to yellowness, due to that it has a b, and hue value of 19.14 and 60.55°. The hue angle measures the property of the color; an angle of 0° indicates a red hue, and the angle of 90° indicates a yellow hue (Krishnaiah et al., Citation2014). During cooking, it was observed an increase in lightness and hue angle from 47.77 to 55.93° and from 60.55 to 67.56°. The increase of lightness value could be due to the evaporation of moisture from the sample. According to Bak et al. (Citation2019), heat treatment results in fading of color, and beef becomes brownish, whereas pork and poultry become brighter due to cooking pressure. On the other hand, cooking time caused a decrease in a, and b parameter from 10.80 to 7.75 and 19.14 to 18.76, respectively. Similar behavior was reported by Özcan and Bozkurt (Citation2015) during the study of the physical and chemical properties of meat. However, the opposite effect was observed by Del Olmo et al. (Citation2010) who reported an increase in a and b color parameters of chicken breast fillets. Finally, Chroma indicates color saturation, which is proportional to its intensity. The Chroma parameter tended to decrease slightly from 21.98 to 20.30 during cooking.
3.2. Dehydration kinetics of raw and cooked chicken meat
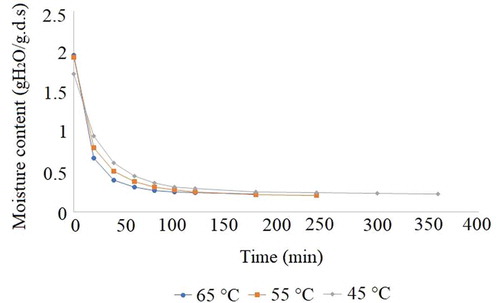
The initial moisture content of raw chicken meat for dehydration kinetics in an electric oven at natural convection at 65, 55, and 45°C was 72.05, 71.98 and 72.8 % (w.b.), respectively. The highest dehydration time obtained for raw chicken meat in the electric oven was 12 h at 45°C while the drying time at 55 and 65°C were 8 h and 6 h, respectively (). According to the literature, the moisture content decreases with the increment in drying temperature and drying time (Kumar et al., Citation2015; Mujumdar, Citation2014). The final moisture content for raw chicken samples, dehydrated at 65°C, 55°C and 45°C was 0.19, 0.20, and 0.21 g H2O/g.d.s, respectively. The typical exponential falling trend, as has been observed in many reports on the drying of food products () (Hii et al., Citation2014; López-Vidaña et al., Citation2019; Muñoz-López et al., Citation2018; Ran et al., Citation2019). The dehydration kinetic of cooked chicken breast in the electric oven was shown in . It was evident that the initial moisture content of the cooked chicken breast was found to be lower (64.89, 65.52, and 65.27%) compared to the raw chicken breast. The lower moisture content in the cooked breast was due to the decrease in moisture holding capacity and shrinkage that expelled the inner moisture of the meat to the surface during cooking (Hii et al., Citation2014; Özcan & Bozkurt, Citation2015). The final moisture content for dehydrated cooked chicken samples dehydrated at 65°C, 55°C and 45°C was 0.23, 0.21, and 0.23 g H2O/g.d.s, respectively. The dehydration kinetics obtained for raw chicken meat dehydrated in a forced convection dehydrator at 45°C, 55°C and 65°C have been shown in . The highest dehydration time resulted at 45°C (7 h) while the dehydration time at 55 and 65°C were 6 and 5 h, respectively. On the other hand, the dehydration kinetics for cooked chicken breast, show the dehydration times at 45°C, 55°C, and 65°C were 6, 4 and 3 h, respectively (). The initial moisture content of raw and cooked chicken breast for their dehydration in a forced convective dehydrator at 65°C, 55°C and 45°C were 75.43, 77.13, 74.08%, and 66.07, 65.8, and 63.25%, respectively. According to the results, the lower dehydration time was observed using a forced convective dehydrator.
Figure 2. Dehydration kinetics of raw chicken breast in electric oven at natural convection.
Figura 2. Cinética de deshidratación de pechuga de pollo cruda en horno eléctrico a convección natural.
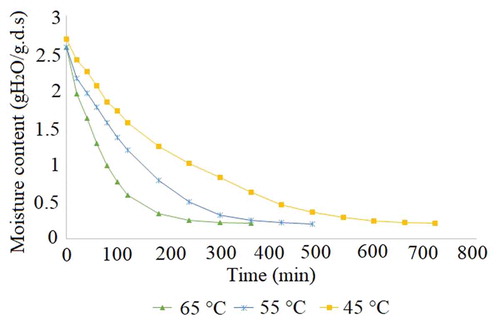
Figure 3. Dehydration kinetics of cooked chicken breast in electric oven at natural convection.
Figura 3. Cinética de deshidratación de pechuga de pollo cocida en horno eléctrico a convección natural.
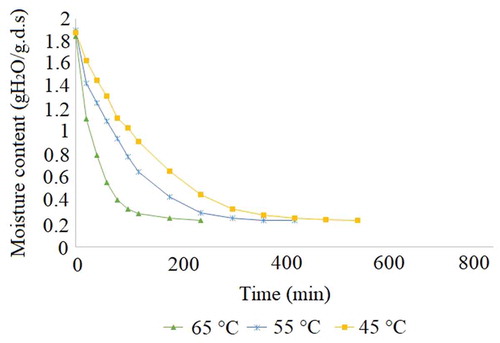
Figure 4. Dehydration kinetics of raw chicken breast in forced convective dehydrator.
Figura 4. Cinética de deshidratación de pechuga de pollo cruda en deshidratador de convección forzada.
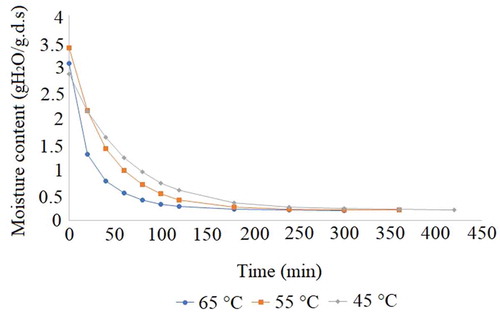
Figure 5. Dehydration kinetics of cooked chicken breast in forced convective dehydrator.
Figura 5. Cinética de deshidratación de pechuga de pollo cocida en deshidratador de convección forzada.
3.3. Fitting of drying models
Table S2 and Table S3 present the models that best fit in each dehydration condition. These models had the highest values of r2 and lower values of χ2 and RMSE. In all experimental dehydration conditions for all models that best fit each dehydration condition, r2 values ranged from 0.9999 to 0.9928, χ2 maximum of 0.0010, and RMSE of 0.0281, indicating a good fit (Akgun & Doymaz, Citation2005). Therefore, these models adequately predict the drying kinetics of chicken breast (Figure S1-S4). As seen from the data in Table S2 and Table S3, the Page and Logarithmic models were the most suitable models to describe dehydration processes followed by modified Page, Henderson and Pabis. Hence, Page and Logarithmic models could be used to explain the dehydration behavior of chicken breast. According to the literature, it is essential to model the dehydration kinetics to carry out the engineering design of the drying processes and evaluate the effects of the variables considered (Clemente et al., Citation2014; López-Vidaña et al., Citation2020).
3.4. Moisture content
The experimental data of dehydrated chicken breast in the electric oven at natural convection from the raw sample have been shown in . The moisture content decreased with the increment in dehydration temperature. According to the results, moisture content tended to decrease from 9.34% to 6.6% as the dehydration temperature increased from 45°C to 65°C. Using a high temperature leads to shorter dehydration time to reach the equilibrium moisture content, which indicates that a higher drying rate was obtained using a higher dehydration temperature. On the other hand, shows the final moisture content of chicken breast in the electric oven at natural convection from cooked samples; the lowest moisture content is achieved in chicken samples at 65°C. The drying rate increased as the temperature increased from 45 to 65°C which leads to more moisture evaporation. The moisture content decreased from 6.18 to 3.82% in the electric oven as the dehydration temperature increased from 45 to 65°C. The initial moisture content of raw and cooked chicken breast was reduced from 72.60 and 67.58% to 6.6 and 3.82%, respectively in the electric oven. Therefore, chicken breast samples were considered stable because moisture content was reduced below 10% (Hu et al., Citation2013; Luna-Solano et al., Citation2019). Our findings are consistent with the results obtained during the drying of chicken meat by Hii et al. (Citation2014), who showed that moisture content decreased when the drying temperature increased from 60 to 80°C. In addition, Kurozawa et al. (Citation2011) observed a significant effect of drying temperature on moisture loss of chicken meat by spray drying. The effect on the drying rate increase when higher temperatures are applied (from 120 to 180°C). The experimental data of dehydrated chicken breast in a forced convection dryer from raw samples are shown in . It was evident that moisture content decreased from 8.66 to 7.21%, with the increment in dehydration temperature from 45 to 65°C. On the other hand, the same effect of temperature was observed in the final moisture content of cooked samples; in this case, the moisture decreased from 6.31% to 4.93% at dehydration temperature of 45°C and 65°C in a forced convective dehydrator, respectively (). According to results, the lowest moisture content is observed in the electric oven at 65°C. The moisture content values in both processes were below 10%. According to Tarisin et al. (Citation2014), products are stable when their moisture content is reduced to values less than or equal to 10%.
Table 2. Experimental data of raw chicken breast dehydrated in electric oven at natural convection.
Tabla 2. Datos experimentales de pechuga de pollo cruda deshidratada en horno eléctrico a convección natural.
Table 3. Experimental data of cooked chicken breast dehydrated in electric oven at natural convection.
Tabla 3. Datos experimentales de pechuga de pollo cocida deshidratada en horno eléctrico a convección natural.
Table 4. Experimental data of raw chicken breast dehydrated in a forced convective dehydrator.
Tabla 4. Datos experimentales de pechuga de pollo cruda deshidratada en un deshidratador de convección forzada.
Table 5. Experimental data of cooked chicken breast dehydrated in a forced convective dehydrator.
Tabla 5. Datos experimentales de pechuga de pollo cocida deshidratada en un deshidratador de convección forzada.
3.5. Water activity
Drying of food removes and decrease water activity to reduce the risk of microbial development and to diminish enzymatic reactions and chemical degradations (Naidu et al., Citation2012). The water activity tends to decrease slightly as the dehydration temperature increase from 45 to 65°C in the electric oven at natural convection (). At higher temperatures, the water evaporation rate is higher, influencing the moisture content and, consequently, water activity in the product (Vahidhosseini et al., Citation2016). This result was expected because, under these conditions, the dried product had the lowest final moisture content. The initial water activity value of raw and cooked chicken breast in the electric oven at natural convection was reduced from 0.98 and 0.96 () to 0.488 and 0.443 (, ), respectively. According to the technical literature, xerophilic molds and osmophilic yeast typically grow between 0.60 and 0.65 water activity (Troller & Christian, Citation1980). Therefore, the present findings imply that the dried chicken breast may have a longer shelf life as there is less free water available for biochemical reactions (Villegas-Santiago et al., Citation2020). The water activity values were lower in the cooked chicken breast than water activity in raw chicken breast (). These water activity values are desirable in food products because bacterial or yeast and molds growth stopped (Tarisin et al., Citation2014). The variation of water activity during the drying of meat produced in a laboratory dryer by refractance was reported by Rostami et al. (Citation2018), their study demonstrated that applying drying temperatures from 80°C to 100°C on meat slices resulted in water activity values of 0.298 ± 0.001. The water activity values of raw and cooked chicken breast in a forced convection dryer have been shown in and . As seen from the results, the lowest water activity resulted in cooked chicken samples. The water activity tends to decrease from 0.497 to 0.445 and from 0.469 to 0.417 as dehydration temperature increase from 45 to 65°C, respectively. As mentioned before, these water activity values are desirable in food products because bacterial or yeast and molds growth stopped.
3.6. Color parameters
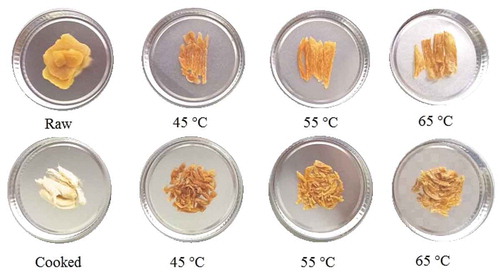
The total color difference is a parameter that is extensively used to evaluate the variation between the raw material and dehydrated samples, which is desirable to be small. It is affected by the luminosity and a, and b parameters. The effect of dehydration temperatures on the final color of chicken breast dehydrated in electric oven and forced convective dehydrator, have been shown in and . The color difference ranged from 13.66 to 10.80 (). According to the results, brightness difference ranged from −13.21 to −9.88; a decrease in lightness can be inferred during the dehydration process. On the other hand, the dried chicken breast tends to yellowness owing to the increment in a and b parameters, as seen from . Similar findings were reported by Domínguez-Niño et al. (Citation2016) during the study of the effect of fluidized bed drying on the physicochemical properties of fresh Mexican cheese. Their results demonstrated that the increment in drying temperature resulted in a decrement in lightness, an increment in a, and b parameters. Therefore, an increment in color difference was observed. The experimental data of dehydrated chicken breast from the cooked sample have been shown in . The color difference between the cooked chicken breast was found to be higher (19.39 to 21.36) compared to the raw chicken breast (). The increment in the color difference is because fat is forced to release during the dehydration process. Some authors have stated that the surface color of meat depends on the quantity of myoglobin present, on its chemical state, and also on the chemical and physical conditions of other components in the meat (Mastromatteo et al., Citation2011). The literature reported that chicken meat has 0.01–1.0 mg/g of myoglobin (Bak et al., Citation2019). and shows color difference values of raw and cooked chicken breast in a forced convective dehydrator, as seen from results the lowest color difference ranged from 6.28 to 6.69 in raw chicken samples, while the color difference in cooked chicken samples ranged from 12.02 to 18.22. It was observed that the best visual aspect resulted in chicken breast samples dehydrated in a forced convection dryer ( and ).
Figure 6. Samples of raw and cooked chicken breast at different dehydration temperatures in electric oven.
Figura 6. Muestras de pechuga de pollo cruda y cocida a diferentes temperaturas de deshidratación en horno eléctrico.
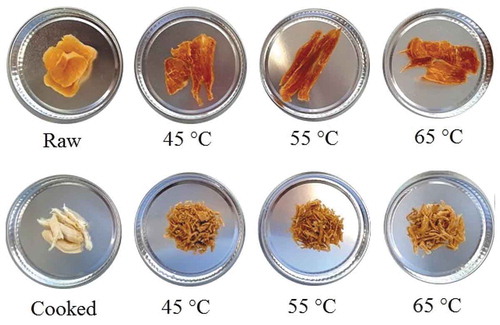
Figure 7. Samples of raw and cooked chicken breast at different dehydration temperatures in forced convective dehydrator.
Figura 7. Muestras de pechuga de pollo cruda y cocida a diferentes temperaturas de deshidratación en deshidratador de convección forzada.
3.7. Fat content
The experimental data of dehydrated chicken breast from raw and cooked samples, have been shown in and , respectively. According to results, the highest fat content was observed in the dehydrated chicken breast from cooked samples. One factor for this behavior is attributed to the release in fat due to the formation of cracks and the subsequent release of fat to the particle surface during the dehydration process (Vignolles et al., Citation2007). Some authors have reported the increment in fat content with the increment in dehydration temperature. O’Flynn et al. (Citation2014) reported a decrease in the moisture content and an increase in the fat and protein content in breakfast sausages. On the other hand, Aaslyng et al. (Citation2003) observed that at increasing temperatures, the water content of the meat had been shown to decrease, and the fat and protein content to increase, indicating that the main part of the cooking loss is water. The fat content in chicken breast samples increased from 3.27 to 5.62% at dehydration temperatures of 45 and 55°C, respectively; however, a decrease in fat content was observed in chicken samples at 65°C (). The same behavior was noted in the fat content of cooked chicken breast samples. An increment in fat content from 3.94 to 5.91% was observed as dehydration temperature increased from 45 to 55°C (). However, there was a decrease in fat content at 65°C. The same tendency occurred in the fat content of raw and cooked chicken breast in a forced convective dehydrator. The fat content increased from 2.44 to 4.61 at 45 and 55°C, respectively; however, fat content decreased at 65°C (). The same behavior was noted in the fat content of cooked chicken breast samples, the fat content tends to increase from 4.0 to 5.45% at 45 and 55°C but decreased to 2.55% at 65°C (). According to Kim et al. (Citation2009), at lower drying temperatures, a substantial amount of water is evaporated before a crust or skin forms, and therefore, the dissolved or dispersed components have more time to migrate within the food. However, at higher drying temperatures, the moisture is evaporated more quickly, and the surface solidifies sooner. Thus, less redistribution of components (less fat and protein migration to the surface) takes place before a crust or skin forms.
3.8. Protein content
The protein content of raw and cooked chicken breast was 21.03 and 30.02%, respectively (). The results are similar to the protein content in chicken breast reported by Liao et al. (Citation2010) and Ran et al. (Citation2019). According to the results, the protein content in cooked chicken breast tends to be higher than in raw breasts. After cooking, decreases in the moisture content and increases in the fat and protein content were observed by O’Flynn et al. (Citation2014) in the application of pressure treatment in breakfast sausages. The protein content in raw and cooked chicken breasts in the electric oven have been shown in and . During the dehydration process, an increment in protein content was observed. According to Caliskan and Dirim (Citation2013), during the dehydration process, the total solids content increases as the residual moisture decrease. Similar behavior was reported by Rant et al. (Citation2019); their results demonstrated an increment in protein content and fat concentration in meat under the influence of heat treatment. The protein content in raw and cooked chicken breast in a forced convective dehydrator ranged from 80.51% to 81.67% and from 81.43% to 83.11%, respectively ( and ). The high protein content of dried chicken breast makes it an excellent potential protein source for food industry applications. Kudre et al. (Citation2018) reported an initial protein content in the egg white of 10.6 % but at the end of the spray drying process, dehydrated chicken egg and air-dried quail egg white contained 90% and 93.96% protein, respectively. This result suggested that the protein content of chicken breast has not been affected by using low dehydration temperatures and can be combined with other dehydrated foods.
4. Conclusions
The moisture content and water activity of chicken samples were reduced sufficiently to ensure microbiological and chemical stability. The lowest color difference ranged from 6.28 to 6.69 in a forced convection dryer for raw samples, showing a better visual aspect than dehydrated samples in an electric oven where the color difference values ranged from 10.80 to 13.66 for raw samples and from 19.39 to 21.09 for cooked samples. According to the results, the short dehydration time was observed using a forced convective dehydrator (7 h) than in the natural convection (12 h) at 65°C. The fat content in chicken breast samples increased at dehydration temperatures of 45 and 55°C; however, a decrease in fat content was detected at 65°C in both processes. This behavior could be related to the less fat migration to the surface of food owing to the short dehydration time at 65°C. Protein content increased from 21.01% to 80% in raw chicken breast for both processes and from 32.42 to 84.65 and 83.11% for cooked breast in the oven and forced convective dehydrator. The high protein content of dried chicken breast makes it an excellent potential protein source for food industry applications. This result suggested that the protein content of chicken breast has not been affected by using low dehydration temperatures and can be used as a food ingredient. Dehydrated chicken breast meat is a food with high protein content and low in fat which can be combined with other dehydrated foods and be a principal ingredient in the preparation of different kinds of foods, it can be cooked directly and with additives as flavoring it can be eaten as a snack. Due to its easy handling and prior sanitary control, it can be distributed in rural areas and supply food to hospitals, schools, nursing homes, orphanages, to improve child nutrition and obviously in the domestic sector. The information obtained in this study can be used to estimate the dehydration conditions required to achieve certain final moisture content in a future process.
Supplemental Material
Download MS Word (693.1 KB)Acknowledgments
The authors are grateful to the Consejo Nacional de Ciencia y Tecnología (CONACYT), CÁTEDRA-CONACYT and the Instituto de Energías Renovables UNAM, México through the project tecnologías termosolares para el secado de alimentos y su integración en la industria mexicana; as well as the infrastructure used from the solar drying laboratory.
Disclosure statement
The authors reported no conflict of interest.
Supplementary material
Supplemental data for this article can be accessed on the publisher’s website.
References
- Aaslyng, M. D., Bejerholm, C., Ertbjerg, P., Bertram, H. C., & Andersen, H. J. (2003). Cooking loss and juiciness of pork in relation to raw meat quality and cooking procedure. Food Quality and Preference, 14(4), 277–288. https://doi.org/10.1016/S0950-3293(02)00086-1
- Akgun, N. A., & Doymaz, I. (2005). Modeling of olive cake thin-layer drying process. Journal of Food Engineering, 68(4), 455–461. https://doi.org/10.1016/j.jfoodeng.2004.06.023
- Aymerich, M. T., Garriga, M., Ylla, J., Vallier, J., Monfort, J. M., & Hugas, M. (2000). Application of enterocins as biopreservatives against Listeria innocua in meat products. Journal of Food Protection, 63(6), 721–726. https://doi.org/10.4315/0362-028X-63.6.721
- Bak, K. H., Bolumar, T., Karlsson, A. H., Lindahl, G., & Orlien, V. (2019). Effect of high-pressure treatment on the color of fresh and processed meats: A review. Critical Reviews in Food Science and Nutrition, 59(2), 228–252. https://doi.org/10.1080/10408398.2017.1363712
- Caliskan, G., & Dirim, S. N. (2013). The effects of the different conditions and the amounts of maltodextrin addition during spray drying of sumac extrac. Food and Bioproducts Processing, 91(4), 539–548. https://doi.org/10.1016/j.fbp.2013.06.004
- Charlton, K. E., Probst, Y., Tapsell, L. C., & Blackall, P. (2008). Food, health and nutrition: Where does chicken fit?. Australian Chicken Meat Federation.
- Clemente, G., Sanjuán, N., Cárcel, J. A., & Mulet, A. (2014). Influence of temperature, air velocity, and ultrasound application on drying kinetics of grape seeds. Drying Technology, 32(1), 68–76. https://doi.org/10.1080/07373937.2013.811592
- Consejo Mexicano de la Carne. (2018). Compendio estadístico 2018. Retrieved August 11, 2019, from. https://comecarne.org/
- Del Olmo, A., Morales, P., Ávila, M., Calzada, J., & Nuñez, M. (2010). Effect of single-cycle and multiple cycle high-pressure treatments on the colour and texture of chicken breast fillets. Innovative Food Science and Emerging Technologies, 11(3), 441–444. https://doi.org/10.1016/j.ifset.2010.01.012
- Demir, E., Sarica, S., Özcan, M. A., & Suicmez, M. (2005). The use of natural feed additives as alternatives for an antibiotic growth promoter in broiler diet. European Poultry Science, 69(3), 110–116. https://doi.org/10.1080/713655288
- Domínguez-Niño, A., Buendía-González, A. N., Cantú-Lozano, D., Andrade-González, I., & Luna-Solano, G. (2016). Efecto del secado por lecho fluidizado sobre las propiedades fisicoquímicas y microbiológicas de queso fresco mexicano. Revista Mexicana de Ingeniería Química, 15(3), 869–881. Retrieved from http://rmiq.org/iqfvp/Pdfs/Vol.%2015,%20No.%203/Alim9/Alim9.html
- Duan, X., Zhang, M., Mujumdar, A. S., & Wang, R. (2010). Trends in microwave-assisted freeze drying of foods. Drying Technology, 28(4), 444–453. https://doi.org/10.1080/07373931003609666
- Fabre, R., Perlo, F., Bonato, P., Tito, B., Teira, G., & Tissoco, O. (2014). Efecto de las condiciones de conservación sobre la calidad de pechugas de pollo. Ciencia, Docencia y Tecnología, 25(49), 143–153. Retrieved from https://www.redalyc.org/pdf/145/14532635006.pdf
- Fuente-Salcido, N. M., & Barboza Corona, J. E. (2010). Inocuidad y bioconservación de alimentos. Acta universitaria, 20(1), 43–52. https://doi.org/10.15174/au.2010.76
- Henderson, S. M., & Pabis, S. (1961). Grain drying theory II: Temperature effects on drying coefficients. Journal of Agricultural Engineering Research, 6(3), 169–174.
- Hii, C. L., Itam, C. E., & Ong, S. P. (2014). Convective air drying of raw and cooked chicken meats. Drying Technology, 32(11), 1304–1309. https://doi.org/10.1080/07373937.2014.924133
- Hu, Y., Que, T., Fang, Z., Liu, W., Chen, S., Liu, D., & Ye, X. (2013). Effect of different drying methods on the protein and product quality of hairtail fish meat gel. Drying Technology, 31(13–14), 1707–1714. https://doi.org/10.1080/07373937.2013.794831
- Hulankova, R., Borilova, G., Abdullah, F. A., & Buchtova, H. (2018). Microbiological quality of organic chicken meat during refrigerated storage in air and modified atmospheres. British Poultry Science, 59(5), 506–513. https://doi.org/10.1080/00071668.2018.1496399
- Kim, E. H. J., Dong-Chen, X., & Pearce, D. (2009). Surface composition of industrial spray-dried milk powders. 2. Effects of spray drying conditions on the surface composition. Journal of Food Engineering, 94(2), 169–181. https://doi.org/10.1016/j.jfoodeng.2008.10.020
- Krishnaiah, D., Nithyanandam, R., & Sarbatly, R. (2014). A critical review on the spray drying of fruit extract: Effect of additives on physicochemical properties. Critical Reviews in Food Science and Nutrition, 54(4), 449–473. https://doi.org/10.1080/10408398.2011.587038
- Kudre, T., Kumar-Bejjanki, S., Kanwate, B. W., & Sahkare, P. Z. (2018). Comparative study on physicochemical and functional properties of egg powders from Japanese quail and white Leghorn chicken. International Journal Food Properties, 21(1), 957–972. https://doi.org/10.1080/10942912.2018.1466320
- Kumar, V., Tewari, R., & Singh, K. (2015). Comparative studies of drying methods on yield and composition of the essential oil of Cymbopogon citratus. Journal of Essential Oil Bearing Plants, 18(744–750), 744–750. https://doi.org/10.1080/0972060X.2014.935069
- Kurozawa, L. E., Gomes-Morassi, A., Aparecida-Vanzo, A., Jin-Park, K., & Dupas-Hubinger, M. (2009). Influence of spray drying conditions on physicochemical properties of chicken meat powder. Drying Technology, 27(11), 1248–1257. https://doi.org/10.1080/07373930903267187
- Kurozawa, L. E., Jin-Park, K., & Dupas-Hubinger, M. (2011). Spray drying of chicken meat protein hydrolysate: Influence of process conditions on powder property and dryer performance. Drying Technology, 29(2), 163–173. https://doi.org/10.1080/07373937.2010.482711
- Liao, G. Z., Wang, G. Y., Xu, X. L., & Zhou, G. H. (2010). Effect of cooking methods on the formation of heterocyclic aromatic amines in chicken and duck breast. Meat Science, 85(1), 149–154. https://doi.org/10.1016/j.meatsci.2009.12.018
- López-Vidaña, E. C., César-Munguía, A. L., García-Valladares, O., Pilatowsky-Figueroa, I., & Brito-Orosco, R. (2020). Thermal performance of a passive, mixed-type solar dryer for tomato slices (Solanum lycopersicum). Renewable Energy, 147(Part 1), 845–855. https://doi.org/10.1016/j.renene.2019.09.018
- López-Vidaña, E. C., Pilatowsky-Figueroa, I., Antonio-Marcos, E. G., Navarro-Ocaña, A., Hernández-Vázquez, L., & Santiago-Urbina, J. A. (2019). Solar drying kinetics and bioactive compounds of blackberry (Rubus fruticosus). Journal of Food Process Engineering, 42(4), 1–9. https://doi.org/10.1111/jfpe.13018
- Luna-Solano, G., Viloria-Perez, D. G., Villegas-Santiago, J., Salgado-Cervantes, M. A., & Domínguez-Niño, A. (2019). Drying and extraction process of lemongrass (Cymbopogon citratus). Agrociencia, 53(3), 447–464. Retrieved from https://agrociencia-colpos.mx/index.php/agrociencia/article/view/1795/1792
- Mastromatteo, M., Incoronato, A. L., Conte, A., & Del Nobile, M. A. (2011). Shelf life reduced pork back-fat content sausages as affected by antimicrobial compounds and modified atmosphere packaging. International Journal of Food Microbiology, 150(1), 1–7. https://doi.org/10.1016/j.ijfoodmicro.2011.07.009
- Moreno-Temprado, R. (2005). Calidad de la carne de pollo. In Selecciones avícolas (pp. 423–430). Retrieved from https://seleccionesavicolas.com/pdf-files/2005/7/1644-calidad-de-la-carne-de-pollo-y-ii.pdf
- Mujumdar, A. S. (2014). Principles, classification, and selection of dryers. In A. S. Mujumdar (Ed.), Handbook of industrial drying (4th ed., pp. 4–30). CRC Press.
- Muñoz-López, C., Urrea-García, G. R., Jiménez-Fernández, M., Rodríguez-Jiménes, G. C., & Luna-Solano, G. (2018). Effect of drying methods on the physicochemical and thermal properties of mexican plum (Spondias purpurea L.). CyTA-Journal of Food, 16(1), 127–134. https://doi.org/10.1080/19476337.2017.1345984
- Naidu, M. M., Khanum, H., Sulochanamma, G., Sowbhagya, H. B., Hebbar, U. H., Prakash, M., & Srinivas, P. (2012). Effect of drying methods on the quality characteristics of fenugreek (Trigonellafoenum graecum) greens. Drying Technology, 30(8), 808–816. https://doi.org/10.1080/07373937.2012.666607
- NMX-F-068-S-1980. Alimentos. Determinación de proteínas. Foods. Determination of proteins. Normas mexicanas. Dirección General de normas. Retrieved from https://www.colpos.mx/bancodenormas/nmexicanas/NMX-F-068-S-1980.PDF
- Norbrillinda, M. T., Mahanom, H., Elyana, N. N., & Farina, N. I. (2016). Optimization of spray drying process of Sargassum muticum color extract. Drying Technology, 34(14), 1735–1744. https://doi.org/10.1080/07373937.2016.1204550
- O’Flynn, C. C., Cruz-Romero, M. C., Troy, D., Mullen, A. M., & Kerry, J. P. (2014). The application of high-pressure treatment in the reduction of salt levels in reduced-phosphate breakfast sausages. Meat Science, 96(3), 1266–1274. https://doi.org/10.1016/j.meatsci.2013.11.010
- Özcan, A. U., & Bozkurt, H. (2015). Physical and chemical attributes of a ready to eat meat product during the processing: Effects of different cooking methods. International Journal of Food Properties, 18(11), 2422–2432. https://doi.org/10.1080/10942912.2014.982256
- Page, G. E. (1949). Factors influencing the maximum rates of air-drying shelled corn in thin layers M.S. Thesis. Department of Mechanical Engineering, Purdue University
- Pilatowsky-Figueroa, I., & García-Valladares, O. (2017). Aplicaciones térmicas de la energía solar en los sectores residencial, servicio e industrial (1st ed.). Universidad Nacional Autónoma de México.
- Ramírez Nava, J. B. (2006). Liofilización de alimentos. ReCiTeIA, 6(2), 1–39. Retrieved from https://www.researchgate.net/publication/259620189_Liofilizacion_de_alimentos
- Ran, X. L., Zhang, M., Wang, Y., & Liu, Y. (2019). A comparative study of three drying methods on drying time and physicochemical properties of chicken powder. Drying Technology, 37(3), 373–386. https://doi.org/10.1080/07373937.2018.1458734
- Rant, W., Rant, A. R., Świątek, M., Niżnikowski, R., Ślęzak, M., Szymańska, Ż., & Morales-Villacencio, A. (2019). The effect of cooking method on the physico-chemical characteristics and fatty acid composition in lamb longissimus dorsi muscle. Journal Food and Agriculture, 31(2), 118–124. https://doi.org/10.9755/ejfa.2019.v31.i2.1914
- Rostami, H., Dehnad, D., Jafari, S. M., & Tavakoli, H. R. (2018). Evaluation of physical, rheological, microbial, and organoleptic properties of meat powder produced by refractance window drying. Drying Technology, 36(9), 1076–1085. https://doi.org/10.1080/07373937.2017.1377224
- Sa-adcom, P., Swasdisevi, T., Nathakaranakule, A., & Soponronnarit, S. (2011). Drying kinetics using superheated steam and quality attributes of dried pork slices for different thickness, seasoning and fibers distribution. International Journal of Food Engineering, 104(1), 105–113. https://doi.org/10.1016/j.jfoodeng.2010.12.002
- Sajid-Arshad, M., Amjad, Z., Yasin, M., Saeed, F., Imran, A., Sohaib, M., Anjum, F. M., & Hussain, S. (2019). Quality and stability evaluation of chicken meat treated with gamma irradiation and turmeric powder. International Journal of Food Properties, 22(1), 154–172. https://doi.org/10.1080/10942912.2019.1575395
- Secretaría de Agricultura, Ganadería, Desarrollo Rural, Pesca y Alimentación. (2013). Carne de pollo mexicana. SAGARPA-CONACYT.
- Suárez, R. (2001). Conservación de alimentos por irradiación. Invenio, 4(6), 85–124. Retrieved from https://www.redalyc.org/pdf/877/87740608.pdf
- Taheri-Garavand, A., Fatahi, S., Omid, M., & Makino, Y. (2019). Meat quality evaluation based on computer vision technique: A review. Meat Science, 156(2019), 183–195. https://doi.org/10.1016/j.meatsci.2019.06.002
- Tarisin, M. S., Purpasi, I., Sahalan, A. Z., Mokhtar, M., Abdul-G, M. K., & Yaakob, Z. (2014). Drying of Citrus sinensis peels in an inert fluidized bed: Kinetics, microbiological activity, vitamin C, and limonene determination. Drying Technology, 32(5), 497–508. https://doi.org/10.1080/07373937.2013.838782
- Toǧrul, H. (2005). Simple modeling of infrared drying of fresh apple slices. Journal of Food Engineering, 71(3), 311–323. https://doi.org/10.1016/j.jfoodeng.2005.03.031
- Troller, J. A., & Christian, H. B. (1980). Water Activity and Food. Academic Press.
- Vahidhosseini, S. M., Barati, E., & Esfahani, A. (2016). Green’s Function Method (GFM) and mathematical solution for coupled equations of transport problem during convective drying. Journal of Food Engineering, 187(2016), 24–36. https://doi.org/10.1016/j.j.foodeng.2016.04.017
- Vignolles, M. L., Jeantet, R., Lopez, C., & Schuck, P. (2007). Free fat, surface fat and dairy powders: Interactions between process and product. A review. Lait, 87(3), 187–236. https://doi.org/10.1051/lait:2007010
- Villegas-Santiago, J., Gómez-Navarro, F., Domínguez-Niño, A., García-Alvarado, M. A., Salgado-Cervantes, M. A., & Luna-Solano, G. (2020). Effect of spray-drying conditions on moisture content and particle size of coffee extract in a prototype dryer. Revista Mexicana de Ingeniería Química, 19(2), 767–781. https://doi.org/10.24275/rmiq/Proc767
- White, G. M., & Poneleit, C. G. (1981). Fully-exposed drying of popcorn. American Society of Agricultural Engineers, 24(2), 466–469. https://doi.org/10.13031/2013.34276