
 ?Mathematical formulae have been encoded as MathML and are displayed in this HTML version using MathJax in order to improve their display. Uncheck the box to turn MathJax off. This feature requires Javascript. Click on a formula to zoom.
ABSTRACT
Phospholipases have been used in different food processes, but mainly on degumming vegetable oils. More recently, the use of these enzymes has been extended to the manufacture of bread and dairy products. However, little is known on phospholipases effect on lecithin-based emulsions and how the emulsion size contributes to such effect. This work aimed to explore the effect of phospholipase type A1 (PLA1) on lecithin-based emulsions with different droplet size distribution. The PLA1 was able to hydrolyze lecithin phospholipids aggregated in (oil-in-water) emulsions, generating different lysophospholipids. The larger the particle size in the emulsion, the higher the enzymatic activity of PLA1. According to theoretical calculations, the lysophospholipids had higher hydrophile-lipophile balance (HLB) and had a lower critical packing parameter (p) than phospholipids. In consequence, the emulsions having more lysophospholipids were more prone to flocculate and to coalescence.
RESUMEN
Las fosfolipasas se utilizan en diferentes procesos alimenticios, principalmente en el desgomado de aceites vegetales. Recientemente, se ha extendido el uso de estas enzimas en la manufactura de pan y productos lácteos. Sin embargo, se conoce poco sobre el efecto que tienen las fosfolipasas sobre emulsiones que usan lecitina, y como el tamaño de las emulsiones contribuye en tal efecto. En este trabajo se exploró el efecto de la fosfolipasa tipo A1 (PLA1) sobre emulsiones a base de lecitina con diferente distribución de tamaño de partícula. La PLA1 fue capaz de hidrolizar los fosfolípidos de la lecitina que se agregaban en forma de emulsión (aceite en agua), generando diferentes lisofosfolípidos. Entre mayor era el tamaño de partícula en las emulsiones, mayor fue la actividad enzimática de la PLA1. Según los cálculos teóricos obtenidos, los lisofosfolípidos tuvieron un mayor balance hidrófilo-lipófilo (HLB) y un menor parámetro de empacado (p) en comparación que los fosfolípidos. En consecuencia, las emulsiones con lisofosfolípidos más propensas a flocular y a presentar coalescencia.
1. Introduction
Phospholipases have been used in different food processes, but mainly on degumming vegetable oils or modifying egg yolk’s emulsion properties. More recently, the use of these enzymes has been extended to the manufacture of bread and dairy products. In bread making, it has been reported that phospholipases elevate the loaf volume and bread softness. In the dairy industry, phospholipases have been used to raise the cheese yield (Clausen, Citation2001; Guerrand, Citation2017; De Maria et al., Citation2007). According to different authors, the phospholipase type 1 (PLA1) promotes water retention in the curd and decreases fat loss in the whey (Lilbæk et al., Citation2006; Trancoso-Reyes et al., Citation2014).
In the food industry, the most widely used emulsifier ingredient is lecithin. Lecithins are extracted from different natural sources like plant seeds (soybeans and rapeseeds), and egg yolk. However, lecithin extracted from soybean oil is the most common used for food emulsions. Lecithins contain a complex mixture of glycerophospholipids (), including phosphatidylcholine (PC), phosphatidylethanolamine (PE), phosphatidylinositol (PI), phosphatidylserine (PS), and phosphatidic acid (PA). Lecithin phospholipids have an amphiphilic structure that confers emulsifying, wetting, and self-assembly characteristics (Friberg et al., Citation2003; J. Li et al., Citation2015; David Julian McClements, Citation2015).
Table 1. Theoretical calculation on the hydrophile-lipophile balance (HLB), and the surfactant critical packing parameter (p) of phospholipids and their corresponding lysophospholipids.
Tabla 1. Cálculos teóricos del balance hidrófilo lipófilo (HLB), y de el valor crítico de empaque (p) de fosfolípidos y sus correspondientes lisofosfolípidos
Phospholipases are a ubiquitous group of hydrolases which have the property of hydrolyzing phospholipids (Wilton, Citation2008). These enzymes are classified based on their site of hydrolysis. The phospholipase type A1 (PLA1) attack the Sn1-acyl ester (3.1.1.32), the phospholipase type A2 (PLA2) acts on the Sn2-acyl ester (3.1.1.4), and the type B act on both the Sn1 and Sn2 position (PLB). Accordingly, phospholipid hydrolysis by PLA1 and PLA2 yields lysophospholipids and free fatty acids (). The biological role of these enzymes is to hydrolyze phospholipids to prevent membrane degradation and control the formation of phospholipid-derived signaling molecules. In nature, phospholipases share another particularity, being more active on aggregated phospholipids than on monomeric substrate. Unlike other esterases, phospholipases (and most lipases) show an enhanced activity at the lipid-water interface due to conformational changes in the enzyme resulting from the interfacial binding (Dowhan et al., Citation2008; Sandoval, Citation2012; Wilton, Citation2008). It has been suggested that the property described above is related with the low critical micelle concentration (CMC) of phospholipids in an aqueous milieu. Since a low CMC indicates that at very low concentrations (<10−9 M), phospholipids will self-assemble into liposomes, micelles, or hexagonal structures in water (Wilton, Citation2008).
Despite phospholipases are currently used in different industrial processes, it is not clear the effect these enzymes have on food emulsions, chiefly on lecithin-based emulsions. However, it can be hypothesized that phospholipases are able to hydrolyze phospholipids arranged in oil-in-water emulsions, modifying consequently the stability of emulsion. This work aimed to study phospholipase type A1 (PLA1) capability to hydrolyze phospholipids arranged in oil-in-water emulsions with different droplet size distribution.
2. Materials and methods
2.1. Materials
Extra virgin olive oil (Gallo, España), soybean lecithin (CTR Scientific, México), and deionized water (>18 MΩcm−1) obtained from ultra-pure water purification system (Thermo Scientific, D8611, Dubuque, IO) were employed for the preparation of all solutions. Emulsions were modified using the phospholipase A1 (3.1.1.32) from Thermomyces lanuginosus/Fusarium oxysporum and expressed in Aspergillus oryzae (LecitaseUltra ≥ 10 KLU/g, Sigma-Aldrich, Germany).
2.2. Preparation of emulsions
Emulsions were formed using olive oil, lecithin, and deionized water. First, a surfactant solution of water-lecithin was prepared in a glass baker by dissolving 2.5 g of soybean lecithin in 45 g of warm distilled water (40°C). Then, 2.5 g of oil was added in the water-lecithin solution formerly prepared to obtain a 5% O/W emulsion. The pH was adjusted (if necessary) to 6.8 with NaOH (1 N). Emulsions with different size distribution were induced by mechanical stirring or applying high power ultrasound. For the mechanical induced emulsions (MI), the mixture of water-lecithin-oil was stirred for two minutes at 40°C with a high-shear mixer (IKA T18 basic Ultra-turrax with S18N-10 G dispersing tool, Japan) at 7200, and 15500 rpm (MI-7200 and MI-15500). For the ultrasound-induced emulsions (USI), 15 milliliters of the water-lecithin-oil mixture were poured in a stainless-steel chamber. Water was pumped with a peristaltic bomb (EP1- Econo pump, Biorad, Hercules, CA) through the chamber’s jacket to prevent an increase in temperature during sonication. Sonication was applied for five minutes with an ultrasound processor (Branson Ultrasonic Corporation, Danbury, CT; model Sonifier 450 W) with a 12.7 mm diameter probe placed at 1.57 cm from the chamber bottom. Two ultrasound powers were used 8 W and 10 W, obtained by varying the vibrational amplitude of the probe at 40 and 70%, respectively. The ultrasound energy densities (Q) delivered in the water-lecithin-oil mixture were estimated with the calorimetric method described elsewhere (Sánchez-García et al., Citation2018). Sonication with an ultrasound power of 8 W generated a Q = 167 JmL−1 (USI-167), and the ultrasound power of 10 W had a Q = 200 JmL−1 (USI-200).
2.3. Enzymatic treatment of emulsions
Fifty milliliters of freshly prepared emulsions were poured in a glass baker and kept under gentle agitation at 40°C with a water bath. Then, 50 μL of phospholipase A1 (PLA1) was added in each emulsion and incubated at 40°C. The enzymatic activity of PLA1 was followed by measuring the release of free fatty acids with a pH-meter (Hanna Instruments HI4522, Rumania). The pH values were transformed into hydrogen ion (μmolar) concentration [H+], graphed, and fitted to the logistic model (EquationEq. 1)Eq. 1
Eq. 1 .
Where d[H+]/dt represents the change in hydrogen ion concentration (H+) with time (t), k represents the rate of hydrolysis (μmoles per minute) and the maximum concentration of H+. The enzymatic activity of PLA1 in the emulsions was expressed as lecitace units (LU), where one LU represented the release of one μmole of free fatty acids per minute. The protein concentration was measured using the Bradford reagent (Bradford, Citation1976).
Additionally, one and two dimensions thin-layer chromatographies (1D-TLC and 2D-TLC), were used to monitor the hydrolysis of phospholipids in the emulsions. During the enzymatic incubation, aliquots of 0.5 mL from each treatment were collected at different time intervals (i.e., 0, 5, 15, and 30 min). The aliquots were taken up in glass tubes with three milliliters of chloroform/methanol (1:1). Then, 10 µL from these glass tubes were applied to TLC plates of silica gel (60 F254, E. Merck Co., Darmstadt, Germany). The TLC was run using chloroform/methanol/acetic acid/water (65:40:8:3). The 2D-TLC used chloroform/methanol (2:1) as a mobile phase. Eluted compounds were detected by spraying 5% phosphomolybdic acid in ethanol, followed by heating at 100°C (Hossen & Hernandez, Citation2005).
2.4. Changes in viscosity during the enzymatic treatment of emulsions
Fifty milliliters of freshly prepared emulsions (see section 2.2) at 40°C were added with 50 μL of PLA1 (see section 2.3). Then, a sample of 1.3 mL was promptly placed in the rheometer (AR2000, TA Instruments, New Castle, DE) to follow the changes in viscosity during the enzymatic reaction. The rheometer conditions were as follows: temperature before and during the test = 40°C, geometry = aluminum plate of 40 mm diameter with a solvent trap (to prevent sample evaporation), fixed shear rate = 100−s, sample points 180, test duration = 60 minutes. Data were analyzed and graphed with the Rheology Advantage Data Analysis software (TA Instruments, New Castle, DE). Considering the time required to setting up the rheological experiments (1–2 min), the initial viscosity (ηinitial) was designed as the viscosity in the emulsions during the first 2 minutes of reaction. The final viscosity (ηfinal) was established as the viscosity in the emulsions after one hour of reaction.
2.5. Oil droplet size distribution
All emulsions treated or not with PLA1 were analyzed by optical microscopy. Briefly, a sample of 10 µL from each treatment (MI-700, MI-7200 MI-15500, USI-167, and USI-200) was placed in the microscope glass slide immediately after the dispersion took place. Samples were analyzed with an optical microscope (Bx41 Olympus Optical Co. Ltd., Tokyo) with a digital camera (KP-D50, Hitachi Kokusai Electronic Inc., Tokyo). Multiple images were taken from each sample and were analyzed with the Software Image Pro Plus v.7.0 (Media Cybernetics, Inc., USA) to estimate the size of oil droplets. Data collected were analyzed and graphed in boxplots to describe the oil droplet size distribution.
2.6. Theoretical calculations
The hydrophile-lipophile balance (HLB) for PC (18:2/18:2), PE (16:0/18:2), and PA (16:0/16:0), as well as their corresponding lysophospholipids (LPC, LPE, LPA), were calculated with Griffin’s equation (EquationEq. 2)(Eq. 2)
(Eq. 2) :
whereby M is the molecular mass of the entire molecule, and Mh is the molecular mass of the hydrophilic portion of the molecule (Lange et al., Citation2014). On the other hand, the surfactant critical packing parameter (p) for the PC, PE, LPC, LPE, and LPA were calculated using Equationequation 3(Eq. 3)
(Eq. 3) :
where a0 is the cross-sectional area of the hydrophilic group (Å2), v is the volume of the lipophilic group (Å3), and l is the length of the lipophilic group (Å) (Nagarajan, Citation2002). These parameters were calculated with the computational method described by Khalil and Zarari (Citation2014) but using the software UCSF-Chimera (v 1.13.1, National Institutes of Health, USA), and PyMOL (v 2.2.2, Schrodinger LLC, USA). Molecular structures were obtained from PubChem (PC = CID 5288075, PE = CID 46891780) and edited with ChemDraw (Version 3.1, Cambridge Scientific Computing, MA).
2.7. Statistical analysis
A factorial design (2 x 4) was used to assess the effect of adding phospholipase A1 (PLA1) in different oil-in-water emulsions. The first categorical factor (x1 = addition of PLA1) had two levels: with PLA1 and without PLA1 (controls). The second categorical factor (x2 = type of emulsion) involved 4 levels: MI-7200, MI-15500, USI-167, and USI-200. In total, eight treatments were performed, and each treatment was carried out in triplicate. Data collected were subject to analysis of variance (ANOVA) and multiple mean comparisons (Tukey-Kramer analysis) with the Minitab software 17 (Minitab Inc. State College, PA).
3. Results and discussion
3.1. Characterization of emulsions
All emulsion showed droplets with a spheroid-like structure, although their sizes varied with the method of emulsification (). Mechanical induced (MI) emulsions had a larger median (Q2) diameter (MI-7200 = 0.882 μm, MI-15000 = 0.636 μm) than ultrasound-induced (USI) emulsions (USI-167 = 91 nm, USI-200 = 67 nm). The droplet size distribution was also broader for MI emulsions than USI emulsions (). The USI emulsions had a diameter of < 100 nm and were monodisperse with a narrow size distribution (). The emulsions induced by high-intensity ultrasound have been reported to be less polydisperse and more stable than emulsions prepared with mechanical devices (Ghosh et al., Citation2013; P.-H. Li & Chiang, Citation2012). Ultrasound irradiation first generates local perturbations of the interface leading to the eruption of dispersed phase droplets into the continuous phase. During the stable cavitation, a water-in-oil or oil-in water-in-oil emulsion is formed inside the bulk oil phase. Then, the collapse of micro gas bubbles (transient cavitation) near the interface breaks up the emulsion, resulting in tiny oil-in-water droplets with a diameter < 100 nm (Canselier et al., Citation2002; Mahdi Jafari et al., Citation2006; Stepišnik Perdih et al., Citation2019).
Figure 1. Oil droplet size distribution of emulsions induced by mechanical stirring (MI) or by applying high ultrasound energy (USI) after 10 minutes of incubation with a phospholipase A1 (B), or without the addition of phospholipase (A).
Figura 1. Distribución de tamaño de las gotas de aceite en emulsiones inducidas por agitación mecánica (MI) o por la aplicación de ultrasonido de alta energía (USI) después de 10 minutos de incubación con un fosfolipasa A1 (B) o sin la adición de la fosfolipasa (A)
The MI emulsions had yellow-opaque color, whereas the USI emulsions exhibited a milky-opaque color (). The viscosity of emulsions during the first two minutes (ηinitial) was significantly different between emulsions with and without PLA1 (). These results pointed to the immediate effect of the PLA1 on lecithin-based emulsions, as was further confirmed with the enzyme activity curves (). The viscosity discrepancy between emulsions with and without PLA1 was more evident after one hour of incubation (ηfinal), mainly in the mechanical-induced emulsions. On the other hand, the viscosity of USI emulsions was significantly lower than observed in MI emulsions (), which makes sense since USI emulsions had smaller emulsion droplets than MI emulsions (). It has been reported that emulsions with a small particle size (10 to 100 nm) had lower viscosity than macro emulsions (1 to 20 mm) (Kale & Deore, Citation2017). Referring to the stability of emulsions with time, the rheological analysis showed that MI and USI emulsions (without enzyme) were reasonably stable within the first 60 minutes; the changes in viscosity (Δη) in both types of emulsions were in the order of 1–2 mPa.s (). Nevertheless, the stability of MI emulsions decreased after the first 24 hours (). The MI-7200 showed flocculation of micelles that eventually turned into coalescence at seven days, and into partial phase separation at 30 days of storage. The MI-15500 emulsion showed flocculation on the seventh day and progress to coalescence after 30 days but not turned into phase separation. The USI emulsions (USI-167 and USI-200) were stable during the 30 days of storage at 40°C ().
Table 2. Changes in viscosity (η) with time in mechanical- and ultrasound-induced emulsions (MI and USI) treated or not (control) with a phospholipase A1 (PLA1).
Tabla 2. Cambios en la viscosidad (η) con respecto al tiempo de las emulsiones inducidas mecánicamente y por ultrasonido (MI y USI) tratadas o no (control) con una fosfolipasa A1 (PLA1)
Figure 2. Stability of mechanical- and ultrasound-induced emulsions (MI and USI) treated or not with a phospholipase A1 (PLA1) and incubated at 40°C.
Figura 2. Estabilidad de las emulsiones inducidas mecánicamente o por ultrasonido (MI y USI) tratadas o no con una fosfolipasa A1 (PLA1) e incubada a 40°C
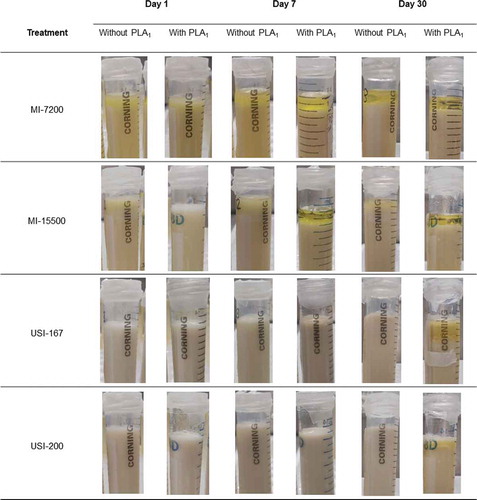
Figure 3. Enzymatic activity observed in mechanical- and ultrasound-induced emulsions (MI and USI) added with a phospholipase A1 (PLA1). The upper graphic shows the rate of free fatty acids released in each emulsion. The bottom graphic describes the enzymatic activity of PLA1 in each emulsion. Bars sharing the same letter had no significant difference in their mean values (p > 0.05).
Figura 3. Actividad enzimática observada en emulsions inducidas mecánicamente o por ultrasonido (MI y USI) tratadas o no con una fosfolipasa A1 (PLA1) e incubada a 40°C. La gráfica superior muestra la velocidad de liberación de ácidos grasos en cada tipo de emulsión. La gráfica del fondo describe la actividad enzimática de la PLA1 en cada emulsión. Las barras que comparten la misma letra no presentaron diferencia significativa en los valores de sus medias (p > 0.05)
According to the size, color, stability, and viscosity, the mechanical-induced (MI) emulsions can be considered conventional emulsions, whereas the ultrasound-induced (USI) emulsions were classified as nano-emulsions. A conventional emulsion is thermodynamically unstable and has droplet sizes ranging from 0.1 to 100 μm. Additionally, the conventional emulsions show a white and opaque color that comes from the light scatter. A nano-emulsion is considered a conventional emulsion containing very small droplets and is also a thermodynamically unfavorable system. The diameter of nano-emulsions varies between 10 to 100 nm. The relatively small droplet size compared to the wavelength of light means that they tend to be transparent or only slightly turbid when the particle diameter falls below about 60 nm. However, if the droplet diameter approaches 80 nm, the emulsion becomes turbid and milky. The nano-emulsions have in general lower viscosity than conventional emulsions (Kale & Deore, Citation2017; Khan et al., Citation2014; David Julian McClements, Citation2012; David Julian McClements & Rao, Citation2011).
3.2. Phospholipase activity on emulsions
The PLA1 showed activity in all the lecithin-based emulsions tested (), confirming the capability of this enzyme to hydrolyze aggregated phospholipids, as suggested by other authors (Dowhan et al., Citation2008; Sandoval, Citation2012; Wilton, Citation2008). The specific activity of PLA1 varied from 0.20 to 0.25 LU/mg of protein (). Other authors have reported activities of 0.8 and 1.6 LU/mg for lipases from P. fluorescens and M. miehei hydrolyzing phospholipid dispersions (Bourlieu et al., Citation2012). The kinetic behavior of PLA1 was sigmoidal in all the treatments, but the rates of hydrolysis (k) varied depending on the type of emulsion (). The conventional emulsions had higher rates of hydrolysis (kMI7200 = 0.254 μM min−1, and kMI15000 = 0.245 μM min−1) than the nano-emulsions (kUSI167 = 0.202 μM min−1, and kUSI200 = 0.227 μM min−1). These results suggest that nano-emulsions’ small surface may limit the amount of enzyme in the lipid-water interface, and therefore the hydrolysis of phospholipids.
According to the one-dimensional and two-dimensional TLC, the soybean lecithin presented PA, PE, PS, PI, and PC. The most abundant phospholipid was PC, followed by PE, PA, and PS (). These results were in agreement with those reported in the literature for soybean lecithin (Gunstone, Citation2011). The TLC analysis also confirmed the hydrolysis of lecithin phospholipids by incorporation of PLA1 into the emulsions (). Overall, the PA and the PE were the phospholipids more attacked by the PLA1 (). The PC was barely hydrolyzed in all the emulsions, and the PS was hydrolyzed only in the USI emulsions (). As the enzymatic reaction proceeded, the accumulation of lysophospholipids was evident, particularly those derived from the hydrolysis of PE (LPE). The extensive hydrolysis of PE could be related to its structure (e.g., the unsaturated fatty acid at the Sn1 position) or its arrangement at the emulsions’ interface, which facilitated the interaction with the PLA1.
Figure 4. Thin layer chromatography (TLC) of emulsion constituents (olive oil and lecithin) and phosphatidylcholine (PC) standard using one-dimensional TLC (1D-TLC), or two-dimensional TLC (2D-TLC). In 1D-TLC (a), lane 1 = phosphatidilcholine standard, lane 2 = soybean lecithin, lane 3 = extra virgin olive oil. In 2D-TLCs, the (b) shows an ultrasound induced emulsion (USI 200) without enzymatic treatment, the (c) shows the extra virgin olive oil, d) = soybean lecithin. NL: neutral lipids, FFA: free fatty acids, PA: phosphatidic acid, PE: phosphatidylethanolamine, PS: phosphatidylserine, PI: phosphatidylinositol, PC: phosphatidylcholine, LysoPLs: Lysophospholipids.
Figura 4. Cromatografía de capa fina (TLC) de los constituyentes de la emulsión (aceite de oliva y lecitina) y de un estándar de fosfatidilcolina (PC) utilizando TLC de una dimensión (1D-TLC), o TLC de dos dimensiones (2D-TLC). En el 1D-TLC (a) el carril 1 = estandar de fosfatidilcolina, carril 2 = lecitina de soya, carril 3 aceite de oliva extra virgen. En los 2D-TLC la (b) muestra una emulsión inducida por ultrasonido (USI200) sin ser tratada por fosfolipasas, el (c) muestra al aceite oliva extravirgen, y el (d) muestra a la lecitina de soya. NL: lípidos neutrales, FFA: ácidos grasos libres, PA: ácido fosfatídico, PE: fosfatidiletanolamina, PS: fosfatidilserina, PI: fosfatidilinositol, PC: fosfatidilcolina, LysoPLs: lisofosfolípidos
Figure 5. Hydrolysis of phospholipids and lipids during the incubation of mechanical- and ultrasound-induced emulsions (MI and USI) added with phospholipase A1. a) MI-7200; b) MI-15500; c) USI-167; d) USI-200. NL: neutral lipids, PA: phosphatidicacid, PE: phosphatidylethanolamine, PS: phosphatidylserine, PC: phosphatidylcholine, PI: phosphatidylinositol, LPE: lysophosphatidylethanolamine, LPS: lysophosphatidylserine, LPC: lysophosphatidylcholine, LPI: lysophosphatidylinositol.
Figura 5. Hidrólisis de fosfolípidos y lípidos durante la incubación de emulsions inducidas por acción mecánica o por ultrasonido (MI y USI) adicionadas con una fosfolipasa A1. a) MI-7200; b) MI-15500; c) USI-167; d) USI-200. NL: lípidos neutrales, FFA: ácidos grasos libres, PA: ácido fosfatídico, PE: fosfatidiletanolamina, PS: fosfatidilserina, PI: fosfatidilinositol, PC: fosfatidilcolina, LPE: lisofosfatidiletanolamina LPS: lisofosfatidilserina, LPC: lisofosfatidilcolina, LPI: lisofosfatidilinositol
3.3. Theoretical calculations of phospholipids and lysophospholipids
The hydrophile-lipophile balance (HLB) of lecithin phospholipids fell from 2.95 to 4.65 (). For instance, the PC had a calculated HLB value of 4.65, which agrees with the literature data (HLB = 4.5) for this phospholipid (Celli et al., Citation2020). The removal of one fatty acid at position Sn1 almost doubled the phospholipids’ HLB values (4.89 to 7.20), making the lysophospholipids more hydrophilic. A surfactant with low HLB value (3–5) is predominantly hydrophobic and partition into the oil phase. Additionally, when the surfactant has a low HLB value, this is surface-active but does not decrease the interfacial tension so much, which makes the emulsion stable. In contrast, a surfactant with an intermediate HLB value (7–9) partition into both the water and the oil phase with no particular preference. Therefore, this type of surfactant is prone to accumulate at the emulsion interface, decreasing the interfacial tension markedly and facilitating the coalescence among emulsion droplets (Claesson et al., Citation2001; Hasenhuettl & Hartel, Citation2008; David Julian McClements, Citation2015).
The ratio of lipophilic-group volume to lipophilic-group length (v/l) ranged between 28–40 Å2 for phospholipids, and 14–22 Å2 lysophospholipids. In agreement with these results, Nagarajan (Citation2002) described that surfactants with double tail usually show a ratio v/l of 42 Å2, and 21 Å2 for single tail surfactants. The critical packing parameter (p) oscillated between 0.35 to 0.25 for phospholipids and 0.14 to 0.17 for lysophospholipids (). The packing parameter gives an insight into the shape of amphiphilic molecules and their self-assembly structures. If p-values are greater than 0.333 (p > 1/3), the surfactants will form a cylinder or rod-like micelles. However, if p-values are smaller than 0.333 (p < 1/3), the surfactants will assemble spherical micelles (Khalil & Zarari, Citation2014; Nagarajan, Citation2002). Accordingly, and based on the results of , all the phospholipids and lysophospholipids (excepting the PA) might form spherical micelles. On the other hand, a total phase inversion would not be expected in the lecithin-based emulsions modified with the PLA1, since a packing parameter greater than one (p < 1) will be required to form reverse micelles (David Julian McClements, Citation2015).
3.4. Properties of emulsions treated with the phospholipase A1
All the emulsions treated with PLA1 showed a narrower oil droplet size distribution and a slightly lower viscosity than the emulsions non-added with the enzyme (, ). Both effects were more evident in the conventional emulsions than in the nano-emulsions. The stability of conventional emulsions and nano-emulsions was also affected by the addition of phospholipase A1. For instance, the emulsions added with PLA1 exhibited more prominent changes in viscosity (Δη) during the first hour of incubation than the emulsions non-treated with the enzyme (). The instability of emulsions with PLA1 turned even more evident at longer times (e.g., 1, 7, and 30 days). The conventional emulsions (MI-7200 and MI-15500) treated with PLA1 had partial phase separation on the seventh day, and the nano-emulsions (USI-167 and USI-200) presented an oiling ring or creaming on the thirtieth day. Such instability was not observed in the emulsions non-treated with PLA1 ().
As previously described, phospholipase A1 was very active on lecithin-based emulsions (). The hydrolysis of lecithin phospholipids generated different lysophospholipids but mainly lysophosphatidylethanolamine or LPE (). According to the theoretical calculations, the LPE had an HLB value of 6 (). Surfactants with intermediate HLB value (∼7) are prone to accumulate at the interface and to reduce the interfacial tension drastically. The much lower interfacial tension created by lysophospholipids also derives from their small molecular size (critical packing parameter) that speeds the diffusion and adsorption of these molecules at the emulsion interface (Dowhan et al., Citation2008; David Julian McClements, Citation2015). In general, lowering the interfacial tension can improve the emulsifying properties of a surfactant. When the interfacial tension is too low (∼0 mN/m), a thermodynamically stable emulsion can be formed. In this type of emulsion (referred to as microemulsion), the interfacial tension is almost zero (1x10⁻² – 1 × 10⁻³ mN/m), and the coalescence of droplets does not occur (Paul & Moulik, Citation2001; Salager et al., Citation2005). However, when the interfacial tension is low but not too low to form a thermodynamically stable emulsion, the emulsions droplets are prone to Ostwalt ripening or droplet coalescence, since little free energy is required to disrupt the interfacial layer (Hasenhuettl & Hartel, Citation2008; David Julian McClements, Citation2015). It has been reported that lysophospholipids decrease the interfacial tension to 32–49 mN/m(Stafford et al., Citation1989); this interfacial tension is lower than produced by phospholipids (51.8 mN/m) but is not too low to induce the formation of thermodynamically stable emulsions (Kabalnov et al., Citation1995). Consequently, the emulsions containing lysophospholipids are more unstable and susceptible to coalescence than emulsions with phospholipids. Correspondingly, it has been reported that lysophospholipids can disrupt the structure or perturb the stability of natural phospholipid membranes due to changes in interfacial tension and to the increased polarity and hydration of lysophospholipids (Stafford et al., Citation1989).
The larger the particle size in the emulsion, the higher the enzymatic activity of PLA1 (), and the higher the emulsion instability (). The largest emulsion droplets might accommodate more enzyme molecules at the interface than the smallest droplets. Accordingly, the droplets with the largest sizes inside each emulsion treatment were probably the most affected by the PLA1. Consequently, these large and unstable droplets could be the first and more abundant to flocculate and coalescence. Such effect is illustrated in , where it is observed that emulsions treated with the PLA1 narrowing their droplet size distribution, particularly the upper quartiles. The decrease in viscosity over time () also exhibited the aggregation and separation of large emulsion droplets destabilized by the PLA1.
4. Conclusion
It was evidenced that phospholipase A1 (PLA1) can hydrolyze lecithin phospholipids aggregated in (oil-in-water) emulsions. However, the hydrolysis of phospholipids by the PLA1 depended on the size of the emulsion droplets. The bigger the emulsion, the higher the enzymatic activity of PLA1. The hydrolysis of phospholipids generated lysophospholipids, which had higher HLB values and smaller molecular sizes. In consequence, the emulsions having lysophospholipids were more prone to flocculate and coalescence than phospholipid-based emulsions.
Author contributions
Dely Chávez collected test data and interpreted the results. Nestor Gutiérrez designed the study and drafted the manuscript. Blanca Sanchez helped to acquire and to interpret data from the microscope. Ivan Salmerón and León Hernández helped acquire and interpret data from the enzymatic reactions and thin layer chromatography analysis. David Chavez participated with the theoretical calculations. Sergio Martínez aided in drafting the manuscript.
Conflicts of Interest
The authors have declared that there is no conflict of interest.
Acknowledgments
The Mexican Nacional Council of Science and Technology (CONACYT) supported this research through the grant conceded to Dely R. Chávez-Garay.
Additional information
Funding
References
- Bourlieu, C., Rousseau, F., Briard-Bion, V., Madec, M. N., & Bouhallab, S. (2012). Hydrolysis of native milk fat globules by microbial lipases: Mechanisms and modulation of interfacial quality. Food Research International, 49(1), 533–544. https://doi.org/10.1016/j.foodres.2012.07.036
- Bradford, M. M. (1976). A rapid and sensitive method for the quantitation of microgram quantities of protein utilizing the principle of protein-dye binding. Analytical Biochemistry, 72(1–2), 248–254. https://doi.org/10.1016/0003-2697(76)90527-3
- Canselier, J. P., Delmas, H., Wilhelm, A. M., & Abismaïl, B. (2002). Ultrasound Emulsification—An Overview. Journal of Dispersion Science and Technology, 23(1–3), 333–349. https://doi.org/10.1080/01932690208984209
- Celli, G. B., Liu, Y., Dadmohammadi, Y., Tiwari, R., Raghupathi, K., Mutilangi, W., & Abbaspourrad, A. (2020, March 30). Instantaneous interaction of mucin with pectin- and carrageenan-coated nanoemulsions. Food Chemistry, 309, 125795. https://doi.org/10.1016/j.foodchem.2019.125795
- Claesson, P. M., Blomberg, E., & Poptoshev, E. (2001). Surface forces and emulsion stability. In S. Friberg, K. Larsson, & J. Sjoblom (Eds.), Food emulsions (pp. 269–309). Marcel Dekker.
- Clausen, K. (2001). Enzymatic oil-degumming by a novel microbial phospholipase. European Journal of Lipid Science and Technology, 103(6), 333–340.
- De Maria, L., Vind, J., Oxenbøll, K. M., Svendsen, A., & Patkar, S. (2007). Phospholipases and their industrial applications. Applied Microbiology and Biotechnology, 74(2), 290–300. https://doi.org/10.1007/s00253-006-0775-x
- Dowhan, W., Bogdanov, M., & Mileykovskaya, E. (2008). CHAPTER 1 - Functional roles of lipids in membranes. In D. E. Vance & J. E. Vance Eds., Biochemistry of Lipids, Lipoproteins and Membranes (5th ed., pp. 1–37). Elsevier. https://doi.org/10.1016/B978-044453219-0.50003-9
- Friberg, S., Larsson, K., & Sjoblom, J. (2003). Food emulsions (4th ed.). CRC Press.
- Ghosh, V., Mukherjee, A., & Chandrasekaran, N. (2013). Ultrasonic emulsification of food-grade nanoemulsion formulation and evaluation of its bactericidal activity. Ultrasonics Sonochemistry, 20(1), 338–344. https://doi.org/10.1016/j.ultsonch.2012.08.010
- Guerrand, D. (2017). Lipases industrial applications: Focus on food and agroindustries. OCL, 24(4), D403. https://doi.org/10.1051/ocl/2017031
- Gunstone, F. D. (2011). Vegetable oils in food technology; composition, properties and uses (Vol. 26, 2nd ed.). Blackwell Publishing.
- Hasenhuettl, G. L., & Hartel, R. W. (2008). Food emulsifiers and their applications (Vol. 19, 2nd ed.). Springer.
- Hossen, M., & Hernandez, E. (2005). Enzyme-catalyzed synthesis of structured phospholipids with conjugated linoleic acid. European Journal of Lipid Science and Technology, 107(10), 730–736. https://doi.org/10.1002/ejlt.200501190
- Kabalnov, A., Weers, J., Arlauskas, R., & Tarara, T. (1995). Phospholipids as emulsion stabilizers. 1. Interfacial tensions. Langmuir, 11(8), 2966–2974. https://doi.org/10.1021/la00008a020
- Kale, S. N., & Deore, S. L. (2017). Emulsion micro emulsion and nano emulsion: A review [Review Article]. Systematic Reviews in Pharmacy, 8(1), 39–47. https://doi.org/10.5530/srp.2017.1.8
- Khalil, R. A., & Zarari, A.-H. A. (2014, November 1). Theoretical estimation of the critical packing parameter of amphiphilic self-assembled aggregates. Applied Surface Science, 318, 85–89. https://doi.org/10.1016/j.apsusc.2014.01.046
- Khan, M. F., Sheraz, M. A., Ahmed, S., Kazi, S. H., & Ahmad, I. (2014). Emulsion separation, classification and stability assessment. Journal of Pharmaceutical Sciences, 2(2), 56–62. http://jpps.juw.edu.pk/index.php/jpps/article/view/53/36
- Lange, A., Hirata, T., & Plank, J. (2014, June). Influence of the HLB value of polycarboxylate superplasticizers on the flow behavior of mortar and concrete. Cement and Concrete Research, 60, 45–50. https://doi.org/10.1016/j.cemconres.2014.02.011
- Li, J., Wang, X., Zhang, T., Wang, C., Huang, Z., Luo, X., & Deng, Y. (2015). A review on phospholipids and their main applications in drug delivery systems. Asian Journal of Pharmaceutical Sciences, 10(2), 81–98. https://doi.org/10.1016/j.ajps.2014.09.004
- Li, P.-H., & Chiang, B.-H. (2012). Process optimization and stability of d-limonene-in-water nanoemulsions prepared by ultrasonic emulsification using response surface methodology. Ultrasonics Sonochemistry, 19(1), 192–197. https://doi.org/10.1016/j.ultsonch.2011.05.017
- Lilbæk, H. M., Broe, M. L., Høier, E., Fatum, T. M., Ipsen, R., & Sørensen, N. K. (2006). Improving the yield of mozzarella cheese by phospholipase treatment of milk. Journal of Dairy Science, 89(11), 4114–4125. https://doi.org/10.3168/jds.S0022-0302(06)72457-2
- Mahdi Jafari, S., He, Y., & Bhandari, B. (2006). Nano-emulsion production by sonication and microfluidization—A comparison. International Journal of Food Properties, 9(3), 475–485. https://doi.org/10.1080/10942910600596464
- McClements, D. J. (2012). Nanoemulsions versus microemulsions: Terminology, differences, and similarities [10.1039/C2SM06903B]. Soft Matter, 8(6), 1719–1729. https://doi.org/10.1039/C2SM06903B
- McClements, D. J. (2015). Food emulsions: Principles, practices, and techniques (3rd ed.). CRC press.
- McClements, D. J., & Rao, J. (2011). Food-grade nanoemulsions: formulation, fabrication, properties, performance, biological fate, and potential toxicity. Critical Reviews in Food Science and Nutrition, 51(4), 285–330. https://doi.org/10.1080/10408398.2011.559558
- Nagarajan, R. (2002). Molecular packing parameter and surfactant self-assembly: The neglected role of the surfactant tail. Langmuir, 18(1), 31–38. https://doi.org/10.1021/la010831y
- Paul, B. K., & Moulik, S. P. (2001). Uses and applications of microemulsions. Current Science, 80(8), 990–1001. www.jstor.org/stable/24105809
- Salager, J.-L., Antón, R. E., Sabatini, D. A., Harwell, J. H., Acosta, E. J., & Tolosa, L. I. (2005). Enhancing solubilization in microemulsions—State of the art and current trends. Journal of Surfactants and Detergents, 8(1), 3–21. https://doi.org/10.1007/s11743-005-0328-4
- Sánchez-García, Y. I., García-Vega, K. S., Leal-Ramos, M. Y., Salmeron, I., & Gutiérrez-Méndez, N. (2018, April). Ultrasound-assisted crystallization of lactose in the presence of whey proteins and κ-carrageenan. Ultrasonics Sonochemistry, 42, 714–722. https://doi.org/10.1016/j.ultsonch.2017.12.020
- Sandoval, G. (2012). Lipases and phospholipases: Methods and protocols. Springer.
- Stafford, R. E., Fanni, T., & Dennis, E. A. (1989). Interfacial properties and critical micelle concentration of lysophospholipids. Biochemistry, 28(12), 5113–5120. https://doi.org/10.1021/bi00438a031
- Stepišnik Perdih, T., Zupanc, M., & Dular, M. (2019, March). Revision of the mechanisms behind oil-water (O/W) emulsion preparation by ultrasound and cavitation. Ultrasonics Sonochemistry, 51, 298–304. https://doi.org/10.1016/j.ultsonch.2018.10.003
- Trancoso-Reyes, N., Gutiérrez-Méndez, N., Sepulveda, D. R., & Hernández-Ochoa, L. (2014). Assessing the yield, microstructure, and texture properties of miniature Chihuahua-type cheese manufactured with a phospholipase A1 and exopolysaccharide-producing bacteria. Journal of Dairy Science, 97(2), 598–608. https://doi.org/10.3168/jds.2013-6624
- Wilton, D. C. (2008). CHAPTER 11 - Phospholipases. In D. E. Vance & J. E. Vance Eds., Biochemistry of lipids, lipoproteins and membranes (5th ed., pp. 305–329). Elsevier. https://doi.org/10.1016/B978-044453219-0.50013-1