ABSTRACT
The present study was to investigate whether agavins supplementation might reduce obesity in mice fed with a high fat-high sucrose (HF-HS) diet. Mice were fed with a HF-HS diet with (HF-HS+A) or without agavins (HF-HS) supplementation. Body weight, white adipose tissue (WAT), biomarkers inflammation, gastrointestinal hormones, microbiota, and their excreted metabolites were evaluated. HF-HS+A mice significantly reduced body weight, WAT, and leptin levels compared to the HF-HS group. Furthermore, pro-inflammatory cytokines and insulin levels tended to be lower in the HF-HS+A group. Moreover, the genera Allobaculum, Akkermansia, and Sutterella, linked with positives effects on host health, were identified as possible biomarkers for agavins treatment; meanwhile, ethyl oleate, thymine, hypoxanthine, uracil, and some fatty acids were substantially enriched with agavins and negative associated with pro-inflammatory biomarkers. Collectively, these results demonstrate that agavins can ameliorates many of the harmful effects induced by intake of a diet with a high fat and sucrose content.
RESUMEN
El presente estudio se realizó para investigar si la suplementación con agavinas puede reducir la obesidad en ratones alimentados con una dieta alta en grasa y sacarosa (HF-HS). Los ratones fueron alimentados con una dieta HF-HS con un suplemento de agavinas (HF-HS+A) o sin dicho suplemento (HF-HS). Los parámetros evaluados fueronĄ peso corporal, tejido adiposo blanco (WAT), biomarcadores de inflamación, hormonas gastrointestinales, microbiota y metabolitos excretados. Se constató que, en comparación con el grupo HF-HS, en los ratones HF-HS+A se redujo significativamente el peso corporal, el WAT y los niveles de leptina. Además, en este grupo las citoquinas proinflamatorias y los niveles de insulina tendieron a ser menores. Más aún, los géneros Allobaculum, Akkermansia y Sutterella, relacionados con efectos positivos en la salud del huésped, fueron identificados como posibles biomarcadores para el tratamiento con agavinas. Por otra parte, el oleato de etilo, la timina, la hipoxantina, el uracilo y algunos ácidos grasos se enriquecieron sustancialmente con las agavinas y se asociaron negativamente con biomarcadores proinflamatorios. En conjunto, estos resultados demuestran que las agavinas pueden mitigar muchos de los efectos nocivos inducidos por la ingesta de una dieta con alto contenido en grasa y sacarosa.
1. Introduction
The increment prevalence of obesity and their comorbidities has become a serious public health economic burden. Commonly, an obesogenic environment and inadequate physical activity are the main causes of the epidemic of obesity and related metabolic disorders (Ogden et al., Citation2007). Nevertheless, nowadays in modern human life, the high fat diet intake plus consumption of sugar-sweetened beverages is very common. In general, these foods are particularly energy-dense promoting rapid weight gain compared to balanced diets (Christ et al., Citation2019). In animal obesity model, it is clear that the combination of fat and sugar has a more detrimental effect, especially on insulin resistance, than saturated fat or sugar alone (Masi et al., Citation2017), augmenting the risk for development of type 2 diabetes as well as cardiovascular and neurodegenerative diseases (de Mello NP et al., Citation2019; Ormazabal et al., Citation2018).
A plethora of studies, in mice, have demonstrated that in relation to a standard diet, high fat-high sucrose (HF-HS) diet consumption carry out not only to an increment of body weight and adipose tissue but also to higher glucose (Gao et al., Citation2020; Guimarães et al., Citation2020; Huang et al., Citation2020; Li et al., Citation2021; Rodríguez-Daza et al., Citation2020), cholesterol and triglyceride levels (Guimarães et al., Citation2020; Huang et al., Citation2020; Li et al., Citation2021), lipid accumulation in the liver (Guimarães et al., Citation2020; Li et al., Citation2021), lipopolysaccharides (LPS) and pro-inflammatory cytokines (Gao et al., Citation2020; Li et al., Citation2021), as well as to reduction of anti-inflammatory biomarkers (Li et al., Citation2021) and insulin sensitivity (Gao et al., Citation2020; Guimarães et al., Citation2020; Huang et al., Citation2020; Li et al., Citation2021; Rodríguez-Daza et al., Citation2020). Moreover, some of these pathophysiological effects, even can appear as early as 2 weeks, after HF-HS diet intake (Yang et al., Citation2012). In addition, HF-HS diet consumption can affect profoundly the gut microbiota composition, commonly increasing the Firmicutes/Bacteroidetes (F/B) ratio and the relative abundance of Proteobacteria (Gao et al., Citation2020; Huang et al., Citation2020; Li et al., Citation2021; Rodríguez-Daza et al., Citation2020), as well as the overgrowth of specific taxas such as Bilophila, Helicobacter (Gao et al., Citation2020), Oscillospira, Ruminococcus (Rodríguez-Daza et al., Citation2020) and Desulfovibrio (Li et al., Citation2021) (to mention some). The increment of F/B ratio is associated with obesity and elevated LPS circulating levels (Gao et al., Citation2020; Li et al., Citation2021). LPS is a strong activator of toll-like receptor 4 (TLR4) which induces the expression and secretion of pro-inflammatory cytokines such as tumor necrosis factor-α (TNF-α), interleukin (IL)-1 and (IL)-6 leading to insulin resistance and dysregulated glucose homeostasis (Cani et al., Citation2007; Shoelson et al., Citation2007).
Up to date, the main focus to target obesity and related comorbidities includes restriction of caloric intake and increase of physical activity as well as the use of medications, bariatric surgery, among others (Ogden et al., Citation2007); however, some of these options imply high costs and may originate adverse secondary effects. In the last years, the development of dietary strategies employing prebiotics, have arisen as a good alternative for preventing or treating obesity and its comorbidities associated (Choque Delgado & Wmdsc, Citation2018). In this regard, inulin is perhaps the most known prebiotic; and addition of them to a HF-HS diet, substantially decrease insulin and leptin levels and increase adiponectin concentrations in rats (Sugatani et al., Citation2008). Recently, Igarashi et al. (Citation2020) reported that inulin supplementation shifts the fecal microbiota composition of HF-HS diet-fed mice, decreasing the F/B ratio as well as the relative abundance of Proteobacteria.
On the other hand, agavins are a natural highly neo-branched fructans extracted from stems of Agave plants (Mancilla-Margalli & López, Citation2006). We previously reported that agavins supplementation can modulate the gut microbiota, with the enrichment of bacteria with huge probiotic potential such as Akkermansia in high fat diet-fed mice (Huazano-García et al., Citation2020). Besides, agavins not only induce changes on cecal microbiota composition but also shifts on microbial activity increasing SCFA levels (Huazano-García et al., Citation2017) and other metabolites (postbiotics) which could be exerting various positive metabolic effects on the host including glucose and lipid metabolism (Huazano-García et al., Citation2020). Since the combination of fat and sugar is an important inducer of metabolic alterations (Guimarães et al., Citation2020; Masi et al., Citation2017); in the present study, we feed mice with a high fat diet plus a high sucrose beverage (resembling to human diet) to investigate the capacity of agavins to ameliorates obesity under this dietary regimen.
2. Materials and methods
2.1. Animals
Ten male C57BL/6 mice (8 weeks old) were purchased from the Universidad Autonoma Metropolitana (Mexico City, Mexico). All mice were housed individually under temperature and humidity-controlled room with a 12-h light-dark cycles. Mice were adapted to the environment for 1 week and subsequently divided randomly in two groups and fed with a high fat diet (58Y1 Test Diet, Richmond, IN, USA) plus 30% (wt/vol) of sucrose (Sigma-Aldrich, Saint Louis, MO, USA) (HF-HS; n = 5) or supplemented with agavins (HF-HS+A; n = 5) for ten weeks. Sucrose and agavins were introduced as an extra caloric source by addition to the drinking water of mice.
The high-fat diet (58Y1 Test Diet) contained 61.6% calories from fat (31.7% lard and 3.2% soybean oil); 20.3% from carbohydrates (16.15% maltodextrin, 8.85% sucrose, and 6.46% powdered cellulose), and 18.1% from proteins. Agavins (BIOAGAVETM powder; code: 11200001) from Agave tequilana were purchased to Ingredion Mexico. According to information provided by the supplier, each 100 g of BIOAGAVETM contains 91.6 g of agavins (soluble fiber), 2.8 g of sugars, and 5.6% of moisture. Agavins were added in bottled water at a concentration of 0.38 g/mouse/day. The sucrose solution with or without agavins supplementation were freshly prepared daily. Clean drinking vessels were filled with an equal volume of the correspond solution. Water intake was monitored daily to ensure all animals of the same group were drinking an equivalent volume of fluid. Because excess calorie intake is considered to be an important contributor to metabolic syndrome development or obesity; then food and water were provided ad libitum throughout the experiment. Total energy intake was obtained by the sum of the energy coming from the 58Y1 diet along with sucrose and agavins added to drinking water.
At the end of the experimental period, mice in the postprandial state were anesthetized with a 60 mg/kg intraperitoneal dose of sodium pentobarbital to collect blood of portal vein. Subsequently, the mice were sacrificed by cervical dislocation. The cecum and adipose tissue were removed, rinsed with physiological saline and weighed. Cecum content was snap-frozen with liquid nitrogen and stored at −70°C until their use. The use of animals for this research was conducted according to the Mexican Norm (NOM-062-ZOO-1999) and approved by the Institutional Care and Use of Laboratory Animals Committee from Cinvestav-Mexico (CICUAL) protocol number: 0236–17.
2.2. Body weight gain, glucose, triglyceride, and cholesterol analysis
Body weight evolution was recorded every week along of experimental period. At the end of experimental period, blood samples from mice tails were taken in the postprandial state to measure glucose, triglycerides, and cholesterol. Blood glucose concentrations were obtained using a blood glucose meter (SD Check Gold, Mexico). Triglyceride and cholesterol analysis was carried out on serum samples using kits coupling enzymatic reaction (BioVision, Milpitas, CA, USA).
2.3. Hormones, cytokines, and lipopolysaccharides determinations
Upon sacrifice, portal blood was collected in tubes containing a dipeptidyl peptidase IV inhibitor (0.01 mL per mL of blood; Millipore, St. Louis, MO, USA) and centrifuged at 1600x g for 15 min at 4°C Serum was stored at −80°C until analysis. GLP-1 (active), insulin, and leptin concentrations were analysed employing a Mouse Diabetes Standard BioPlex Pro kit (Bio-Plex Pro Assay, Bio Rad, CA, USA); while interleukins (IL-1α, IL-1β, IL-6, IL-10) and TNF-α concentrations were quantified using a Mouse Cytokine BioPlex Pro kit (Bio-Plex Pro Assay, Bio Rad, CA, USA) and a BioPlex 200 instrument according to the manufacturer’s specification. LPS determinations were carried out employing a mouse LPS kit (MyBioSource, San Diego, CA, USA) following the manufacturer’s instructions.
2.4. DNA extraction and next generation sequencing
Cecal genomic DNA was extracted using a QIAamp PowerFecal DNA Kit (Qiagen, Hilden, Germany) according to the manufacturer’s instructions. Construction of a high-throughput sequencing library and Illumina-based sequencing using a MiSeq instrument were carried out by Genewiz (South Plainfield, NJ, USA). Amplicons were generated using a MetaVxTM Library Preparation kit (Genewiz, South Plainfield, NJ, USA). V3 and V4 regions of the bacterial 16S rDNA gene were amplified using forward primers containing the sequence “CCTACGGRRBGCASCAGKVRVGAAT” and reverse primers containing the sequence “GGACTACNVGGGTWTCTAATCC”. Sequencing was performed using a 2 × 150 paired-end (PE) configuration. The raw sequences generated in this study are available via the National Center for Biotechnology Information Sequence Read Archive (accession number: PRJNA772689).
2.5. Cecal microbiota analysis
Sequence data was processed and analysed on the QIIME2 software (v.2020.8) (Bolyen et al., Citation2019). DADA2 plugin within QIIME2 (Callahan et al., Citation2016), was used to quality filtering, dereplicating, and chimera filtering. First 18 nucleotides of forward and reverse reads were each trimmed to remove primers with ambiguous sequences. Forward reads were truncated at position 249 nt, and the reverse reads at position 241 nt based on the quality scores. We obtained a total of 1,990,271 high-quality sequences, with an average of 199,027 reads per sample, from 10 cecal samples (n = 5/group). Samples were rarefied at 91,885 sequences for alpha and beta diversity analyses. Alpha diversity was evaluated using Chao1 index (number of unique ASV) and Shannon diversity index (quantitative measure of community richness) (Gwinn et al., Citation2016). Differences in richness and diversity between non-supplemented control and agavins prebiotic were calculated by Kruskal-Wallis test. Beta diversity was assessed by calculating weighted UniFrac distance matrices. The distance matrices were graphically visualized by two-dimensional principal coordinates analysis (PCoA) plot. Results of the PCoA were then statistically tested by permutational multivariate analysis of variance (PERMANOVA) with 999 permutations. Generated ASV were assigned to taxonomy using the qiime feature-classifier classify-sklearn feature, using a naïve Bayes classifier (Pedregosa et al., Citation2011) trained on Greengenes v13.8 database at 99% similarity. Linear discriminant analysis (LDA) effect size (LEfSe) was used to identify taxa feature differentially expressed between non-supplemented control and agavins prebiotic (Segata et al., Citation2011). The threshold for the logarithmic LDA score was 3.0 with p < 0.05 for the factorial Kruskal-Wallis test.
2.6. Fecal metabolites analysis
At week ten of the experiment, feces from each mouse were collected, lyophilized, triturated, and homogenized to determine fecal metabolites profiles by Gas Chromatograph-Mass Spectrometry (GC/MS) as previous reported (Huazano-García et al., Citation2020). Fecal metabolites extraction was carried out using 100 mg of feces and 1 mL of chloroform/methanol (2:1). The extraction process was performed three times. Follow, the extracts were combined, and the solvent was evaporated. The residue was re-suspended in 1 mL of chloroform/methanol (2:1). An aliquot of 50 µL was taken and evaporated under nitrogen flux, after derivatized using N, O-Bis(trimethylsilyl)trifuoroacetamine with 1% trimethylchlorosilane (80 µL) and pyridine (20 µL) at 80°C for 25 min. Afterwards the system was at room temperature, isooctane was added to a final volume of 200 µL. Heptadecanoic acid was employed as an internal standard at a concentration of 3 mg/mL. One µL of the isooctane phase was injected, in a pulsed-splitless mode, onto a capillary column HP-5-MS, using He as the carrier gas at constant flow of 1 mL/min. Injector temperature was set to 260°C. The oven temperature began at 40°C (keep for 5 min) followed of an initial ramp temperature of 6 °C/min until 170°C then a second ramp of 12 °C/min until 290°C. The transfer line was maintained at 260°C. Mass spectrometer operated at 70 eV of electron energy, quadrupole and ion-source temperatures were 150 and 230°C respectively. All data were obtained scanning from 40–550 m/z. MassHunter Workstation software version B.0.0.6 (Agilent Technologies, Inc.) was used to collect all the data generated. Components mass spectra and retention times were obtained using the AMDIS (Automated Mass Spectral Deconvolution and Identification System) software. Fecal metabolites analysis was carried out in R 4.1.1 environment. Raw data were normalized and transformed. A principal component analysis (PCA) was applied to pre-processed dataset employing the ade4 package (Dray & Doufour, Citation2007); differences between cluster separations on PCA were confirmed by means of Mahalanobis distance (Md) and statistics significance by Hotelling’s T2 and F-test (Goodpaster & Kennedy, Citation2011). A hierarchical clustering analysis (HCA) was carried out on the PCA patterns through FactoMineR package (Le et al., Citation2008). Peaks with the lowest p-values (p < 0.05) on PCA1 and HCA were selected and annotated by comparing their respective extracted mass spectrum with the mass spectra of data of the NIST (National Institute of Standards and Technology, USA) library and software. A heatmap was performed with all the relevant information obtained for the metabolites analysis.
2.7. Statistical analysis
All statistical analyses, except microbiota and metabolites, were performed using GraphPad Prism 9.0 (GraphPad Software, La Jolla, CA, USA). Results are presented as mean ± SEM. Differences between groups were assessed by Student’s t-test. Differences were considered significant at p-value <0.05. Pearson correlation was applied to assess the relationship between differential microbial taxas (at genus level) and metabolites with hormones, inflammation biomarkers, and systemic effects using R environment.
3. Results
3.1. Agavins prebiotic significantly reduces body weight gain and white adipose tissue
At the end of the dietary intervention, body weight gain was notably lower in mice that received the agavins supplementation compared to the HF-HS group (p < 0.05; ). In addition, upon sacrifice, weighing of WAT demonstrated that agavins prebiotic lead to mice a significantly lower fat accumulation (p < 0.05; ). Moreover, energy intake (the sum of the energy from the solid food and drinking water) did not vary significantly between HF-HS and HF-HS+A group (65.63 ± 1.62 kJ and 67.14 ± 1.67 kJ, respectively), suggesting that reduction of body weight gain and WAT were not dependent of energy intake. On the other hand, glucose and triglycerides levels exhibited a trend to be lower (approximately 10% and 53%, respectively) in mice that receiving the agavins supplement with respect to non-supplemented control group (0.05 ≤ p value <0.10; ), while cholesterol levels were not significantly different between HF-HS and HF-HS+A treatments (4.31 ± 0.24 mM and 4.30 ± 0.11 mM, respectively).
Figure 1. Influence of agavins consumption on body weight, white adipose tissue (WAT), glucose and triglycerides levels in high fat-high sucrose diet fed mice. (A) Body weight evolution, (B) WAT, (C) Glucose, and (D) Triglycerides. Data are shown as average ± SEM (n = 5/group). Circles and triangles in bar plot represent individual rodents. Exact p-values indicates a trend to decrease (0.05 ≤ p value <0.10; unpaired t-test). Significance difference is indicated by * (p < 0.05; unpaired t-test). (HF-HS) non-supplemented control mice and (HF-HS+A) mice fed with agavins supplementation.
Figura 1. Influencia del consumo de agavinas el peso corporal, tejido adiposo blanco (WAT) y niveles de glucosa y triglicéridos en ratones alimentados con una dieta alta en grasa y sacarosa.(A) Evolución del peso corporal, (B) WAT, (C) Glucosa y (D) Triglicéridos. Los datos se muestran como la media ± SEM (n = 5/grupo). En el gráfico de barras los círculos y triángulos representan roedores individuales. Los valores de p exactos indican una tendencia a la disminución (0.05 ≤ valor p < 0.10; prueba t independiente). La diferencia significativa se indica con * (p < 0.05;prueba t independiente). (HF-HS) significa ratones control no suplementados y (HF-HS+A) significa ratones alimentados con un suplemento de agavinas.
3.2. Agavins intake remarkably increased GLP-1 and decreased leptin as well as pro-inflammatory cytokines levels
Portal GLP-1 levels showed a notably increment of about of 47% in the HF-HS+A group compared to the HF-HS group (p < 0.05; , whereas insulin levels in mice that received the agavins prebiotic tended to be lower in comparison with non-supplemented control group (0.05 ≤ p value <0.10; ). Moreover, HF-HS+A mice exhibited a noticeably reduction of about of 45% on leptin concentration with respect to HF-HS group (p < 0.05; ). In addition, a lower portal LPS concentration was observed in mice that received the agavins supplementation compared to the HF-HS group, but the difference did not reach statistical significance (). On the other hand, no significant difference was found for IL-1α levels between both treatments (); nevertheless, the pro-inflammatory cytokine IL-1β concentration exhibited an important reduction in mice that received the agavins treatment with respect to non-supplemented control (p < 0.05; . Additionally, IL-6 levels showed a trend towards a decrease in HF-HS+A group in comparison to HF-HS mice, however the values were not statistically significant (). Noteworthy, agavins intake led obese mice to a significant decrease of about 64% TNF-α concentration compared to HF-HS group (p < 0.05; . While the anti-inflammatory cytokine IL-10 levels in HF-HS+A group tended to be higher when compared to HF-HS group, however the values were not statistically significant ().
Figure 2. Effect of agavins supplementation on gastrointestinal hormones, LPS, and biomarkers of inflammation in high fat-high sucrose diet fed mice. (A) Concentration of GLP-1, (B) Insulin, (C) Leptin, (D) LPS, (E) IL-1α, (F) IL-1β, (G) IL-6, (H) TNF-α, and (I) IL-10. Data are shown as average ± SEM (n = 5/group). Circles and triangles represent individual rodents. Exact p-values indicate a trend to decrease (0.05 ≤ p value <0.10; unpaired t-test). Significance difference is indicated by * and ** (p < 0.05 and p < 0.01, respectively; unpaired t-test). (HF-HS) non-supplemented control mice and (HF-HS+A) mice fed with agavins supplementation.
Figura 2. Efecto de la suplementación de agavinas en las hormonas gastrointestinales, LPS y biomarcadores de inflamación en ratones alimentados con una dieta alta en grasa y sacarosa. (A) Concentración de GLP-1, (B) insulina, (C) leptina, (D) LPS, (E) IL-1α, (F) IL-1β, (G) IL-6, (H) TNF-α, e (I) IL-10. Los datos se presentan como la media ± SEM (n = 5/grupo). Los círculos y triángulos representan roedores individuales. Los valores de p exactos indican una tendencia a disminuir (0.05 ≤ valor p < 0.10; prueba t independiente). La diferencia significativa se indica con * y ** (p < 0.05 y p < 0.01, respectivamente; prueba t independiente). (HF-HS) significa ratones control no suplementados y (HF-HS+A) significa ratones alimentados con un suplemento de agavinas.
3.3. Agavins supplementation shifted the cecal microbiota composition of mice, enriching potential probiotic bacteria
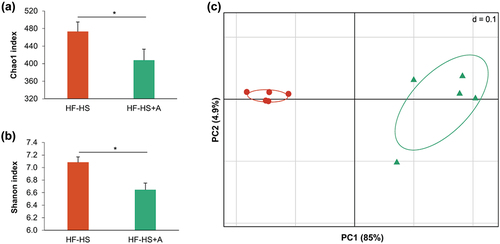
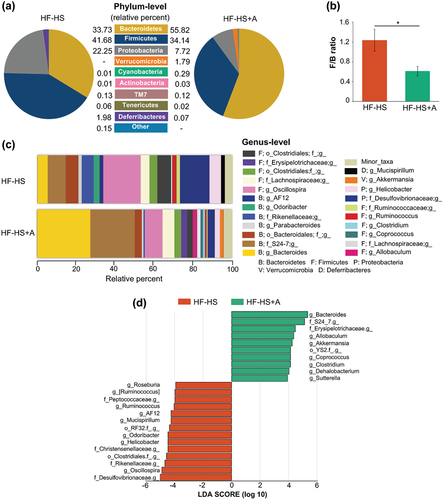
Taxonomic profiling showed that the composition of the microbiota varied among mice fed with the HF-HS diet alone and supplemented with agavins (). As expected, bacterial richness and bacterial diversity were reduced significantly in the HF-HS+A group compared to the HF-HS group (Appendix ), because agavins promote the enrichment of specific microbial taxa (mostly probiotics). Moreover, principal coordinate analysis (PCoA) plot showed that HF-HS+A group had a distinct bacterial community structure since it is clustered separately from non-supplemented control group, indicating that agavins consumption strongly affected gut microbial composition (Appendix ). Overall, at phylum level, the mouse cecal microbiota was greatly dominated by Firmicutes and Bacteroidetes followed by Proteobacteria. In addition, other six minor phyla: Verrucomicrobia, Cyanobacteria, TM7, Actinobacteria, Tenericutes, and Deferribacteres were also present (). HF-HS intake led to mice a markedly increment of Firmicutes/Bacteroidetes (F/B) ratio and a higher relative abundance of Proteobacteria. In contrast, the supplementation of agavins significantly reduced the F/B ratio and the relative abundance of Proteobacteria (Desulfovibrionaceae and Helicobacteraceae families, including the Helicobacter genus; ). Furthermore, in relation to the HF-HS group, agavins supplementation increased the abundance of the genera Bacteroides, Allobaculum, Akkermansia, Coprococcus, Clostridium, Dehalobacterium, and Sutterella and decreased Oscillospira, Helicobacter, Odoribacter, Mucispirillum, AF12, Ruminococcus, and Roseburia (LDA >3.0; . Of note, the presence of Allobaculum, Akkermansia, and Sutterella only were detected in the cecal microbiota of HF-HS+A group; thereby, these genera could be used as biomarkers for agavins prebiotic.
Figure 3. Modulation of cecal microbiota composition by agavins supplementation in high fat-high sucrose diet fed mice. (A) Bacteria taxa plot at the phylum level, (B) Effect of diet on the Firmicutes/Bacteroidetes (F/B) ratio, (C) Bacterial taxa plot at the genus level. Each taxa >1% of the average relative abundance in groups is displayed by a different color. Taxa are reported at the lowest identifiable level, shown by the letter preceding the underscore: f, family; g, genus. (D) Linear discriminant analysis showing the differentially-overrepresented genera between non-supplemented control mice (HF-HS) and mice fed with agavins supplementation (HF+S-A); for each experimental group (n = 5).
Figura 3. Modulación de la composición de la microbiota cecal por la suplementación con agavinas en ratones alimentados con una dieta alta en grasa y sacarosa. (A) Gráfico de taxones bacterianos a nivel de filo, (B) Efecto de la dieta sobre la relación Firmicutes/Bacteroidetes (F/B), (C) Gráfico de taxones bacterianos a nivel de género. Cada taxón > 1% de la abundancia relativa media en los grupos se presenta con un color diferente. Los taxones aparecen en el nivel más bajo identificable, mostrado por la letra que precede al guion bajo: f, familia; g, género. (D) Análisis discriminante lineal que muestra los géneros sobrerrepresentados diferencialmente entre los ratones control no suplementados (HF-HS) y los ratones alimentados con un suplemento de agavinas (HF+S-A); para cada grupo experimental (n = 5).
3.4. Agavins consumption induced changes in the fecal metabolites profiling
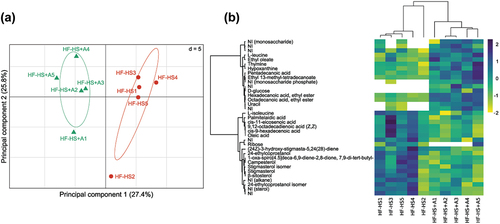
Fecal metabolome profile of the agavins supplemented group was significantly different from those non-supplemented mice (). Principal component analysis (PCA) plot showed that HF-HS and HF-HS+A groups clearly separated in the PC1 (). A total of 109 metabolites were detected in the mice feces. Metabolites significantly contributing to the discrimination between HF-HS and HF-HS+A groups were selected based on the PCA1 and HCA analysis; thus, 35 metabolites showed the greatest differences (p < 0.05). Nonetheless, solely 24 metabolites were annoted. Besides, through the mass spectra data we were able to assign the family to which belong four compounds (). In relation to HF-HS diet, agavins supplementation noticeably increased the excretion of L-leucine, ethyl oleate, hypoxanthine, pentadecanoic acid, ethyl 13-methyl-tetradecanoate, uracil as well as the fatty acids ethyl esters hexadecenoic and octadecanoic; whereas levels of L-isoleucine along with the fatty acids: palmitelaidic, cis-11-eicosenoic, 9,12-octadecadienoic, cis-9-hexadecenoic, and oleic; ribose, and sterols (24-ethylcoprostanol, campesterol, stigmasterol, β-sitosterol) were decreased. Of note, we detected the presence of D-glucose only in the feces of mice fed with the prebiotic supplement. Therefore, some of these metabolites could be used as potential biomarkers for agavins administration.
Figure 4. Changes on fecal metabolites profiling induced by agavins intake in high fat-high sucrose diet fed mice. (A) PCA plot showing a clear separation between non-supplemented control group (HF-HS) and agavins supplemented group (HF-HS+A). Mahalanobis distance (Md) and Hotelling’s T2 test were calculated to measure and confirm the significant difference between both clusters (Md = 108.809, p = 0.00019). (B) Heat map of differential metabolites. NI (Not Identified); Abundance values are shown as Z-scores per row (purple, increase relative to the row mean; yellow, decrease; white, absence metabolite); for each experimental group (n = 5).
Figura 4. Cambios en el perfil de los metabolitos fecales inducidos por la ingesta de agavinas en ratones alimentados con una dieta alta en grasa y sacarosa. (A) Gráfico de PCA que presenta una clara separación entre el grupo control no suplementado (HF-HS) y el grupo suplementado con agavinas (HF-HS+A). Se calcularon la distancia de Mahalanobis (Md) y la prueba T2 de Hotelling para medir y confirmar la diferencia significativa entre ambos clústeres (Md = 108.809, p = 0.00019). (B) Mapa de calor de metabolitos diferenciales. NI (No identificado); los valores de abundancia se presentan como puntuaciones Z por fila (púrpura, aumento respecto a la media de la fila; amarillo, disminución; blanco, ausencia de metabolito); para cada grupo experimental (n = 5).
3.5. Correlation between differential bacteria genera and fecal metabolites with host metabolic outcomes
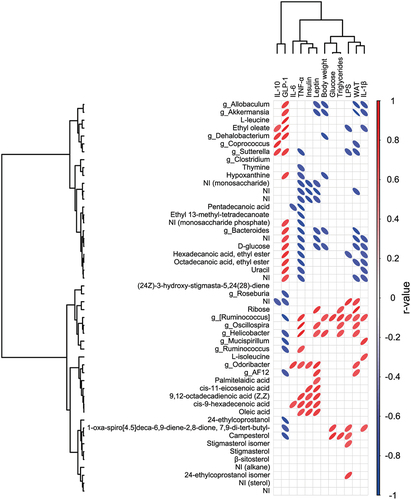
In general, microbial taxas notably increased with HF-HS diet were correlated positively with body weight, WAT, triglycerides, LPS, inflammatory biomarkers, insulin, and leptin levels (). In contrast, the genera substantially enriched with agavins supplement such as Bacteroides, Allobaculum, and Akkermansia, exhibited a significant and negative correlation to body weight, WAT, and leptin concentration as well as a strong positive association with GLP-1 levels. Moreover, Coprococcus displayed a negative correlation to WAT and a positive correlation to IL-10 levels. In addition, Dehalobacterium was negatively correlated with body weight, whereas Sutterella exhibited an inverse association with WAT, LPS, and TNF-α levels. Interestingly, both Dehalobacterium and Sutterella showed a positive correlation to IL-10 and GLP-1 levels. On the other hand, several of metabolites enriched significantly in the feces of HF-HS+A group exhibited a negative correlation with TNF-α and IL-1β levels (). In addition, ethyl oleate as well as hexadecenoic acid, ethyl ester; displayed an inverse association with LPS concentration. Remarkably, octadecanoic acid, ethyl ester was negatively correlated to WAT, while pentadecanoic acid showed an inverse association to IL-6 concentration. Contrary, the majority of metabolites that were decreased in the feces of HF-HS+A group, but increased significantly in the HF-HS group, such as the acids: cis-11-eicosenoic; 9,12-octadecadienoic; cis-9-hexadecenoic; and oleic showed a significant and positive correlation with insulin and leptin levels.
Figure 5. Significant Pearson’s correlations between differential bacterial genera and metabolites, systemic effects, gastrointestinal hormones, and inflammatory biomarkers. The tree on the up and left illustrates a dendrogram of clustering (Ward’s method).
Figura 5. Correlaciones significativas de Pearson entre los géneros bacterianos diferenciales y los metabolitos, efectos sistémicos, hormonas gastrointestinales y biomarcadores inflamatorios. El árbol situado arriba y a la izquierda ilustra un dendrograma de clúster (método de Ward).
4. Discussion
Previous investigations have reported that dietary fat plus sucrose intake is associated with higher body weight gain and WAT as well as increase of leptin, LPS, pro-inflammatory cytokines and deteriorated insulin function (Gao et al., Citation2020; Huang et al., Citation2020; Li et al., Citation2021; Yang et al., Citation2012); which is in line with the results of the present study. Remarkably, supplementation of HF-HS diet with agavins prebiotic led to mice a substantial reduction of body weight, WAT, TNF-α, IL-1β, and leptin levels. An earlier work reported that body weight loss contributes to decreased TNF-α levels in obese individuals (Kern et al., Citation1995), which is in concordant with our results. In addition, WAT is known to secrete various bioactive substances that help to regulate metabolic homeostasis, such as leptin, TNF-α, IL-1β, IL-6, among others (Shoelson et al., Citation2007). Thus, the significant decrement of leptin, and pro-inflammatory cytokines levels observed in the HF-HS+A group could be due, in part, to the lower WAT weight. Moreover, HF-HS+A group exhibited a tendency to diminish the insulin and glucose concentration, in relation to HF-HS group, which might be associated with lower pro-inflammatory cytokines levels; because the increase of them has been associated with insulin resistance and impaired glucose homeostasis (Maedler et al., Citation2011; Olson et al., Citation2012). Interestingly, we did not find a strong effect of agavins on significant decrease of some inflammatory biomarkers such as LPS, IL-1α, and IL-6, but particularly on reduction of insulin levels as in our previous study using only a HF diet (Huazano-García et al., Citation2020); suggesting that the combination of fat and sugar exacerbated inflammation and insulin resistance (Masi et al., Citation2017) which is not so easy to reverse.
On the other hand, accumulating evidence indicate that perturbations in the gut microbiota composition may play an important role in the development of diseases associated with altered metabolism (Gao et al., Citation2020; Li et al., Citation2021; Rodríguez-Daza et al., Citation2020). In this regard, HF-HS diet notably increased the F/B ratio, which is considered as a marker of obesity (Ley et al., Citation2005). In addition, a remarkably increment of Proteobacteria abundance (Desulfovibrionaceae family) was also observed. The enrichment of Desulfovibrionaceae family with HF-HS diet has been previously reported (Li et al., Citation2021). Interestingly, some members of Desulfovibrionaceae family can produce genotoxic hydrogen sulfide (H2S) gas leading to enhanced intestinal permeability (Rohr et al., Citation2020) making easy the passage of toxic metabolites into the periphery, triggering induction of pro-inflammatory cytokines.
Overall, our results strongly support that agavins supplementation had positive effects in gut microbiota modulation. Agavins intake dramatically reduced the F/B ratio and Proteobacteria proportion, which is consistent with a previous report using inulin as prebiotic in HF-HS diet-feed mice (Igarashi et al., Citation2020). Besides, Proteobacteria abundance show a positive correlation with LPS levels (Mi-Young et al., Citation2019); thereby, reduction of this bacteria phylum could be associated to decrement LPS levels in the HF-HS+A group. In addition, LPS are a strong stimulator of the release of several cytokines (Cani et al., Citation2007); thereby, reduction of LPS concentration in the HF-HS+A mice could be contributing to decrease IL-1β, IL-6, and TNF-α levels in these animals.
Moreover, we found that agavins supplement mostly enriched the Bacteroides genus. Interestingly, some species of this genus such as B. thetaiotaomicron, B. ovatus, and B. fragilis are emerging as novel probiotics (Chang et al., Citation2019; Liu et al., Citation2017; Tan et al., Citation2019). Remarkably, these Bacteroides species possess broad ability to breakdown complex polysaccharides (Flint et al., Citation2012). In addition to Bacteroides genus, agavins increased specific taxas such as Allobaculum, Sutterella, Akkermansia, Coprococcus, Clostridium, and Dehalobacterium. Interestingly, the substantial enrichment of all these bacteria genera agrees with an early study using inulin-type fructans as prebiotic (Everard et al., Citation2014). Of note, the significant increment of Bacteroides, Allobaculum, and Akkermansia is consistent with our previous work using a mice fed with a HF diet supplemented with agavins (Huazano-García et al., Citation2020). Moreover, in the present study, Allobaculum, Sutterella, and Akkermansia only were found in the cecal microbiota of the HF-HS+A group; thereby, these bacteria genera could be used as biomarkers for agavins treatment. Intriguingly, previous works evidenced a positive relationship between abundance of Allobaculum with a body weight reduction (Ravussin et al., Citation2012) and GLP-1 levels in obese mice (Huazano-García et al., Citation2020). Whereas Sutterella genus has been reported as important contributor to the remission of type 2 diabetes after bariatric surgery (Wang et al., Citation2020). Furthermore, Akkermansia is considered as a significant biomarker of gut homeostasis and host physiology, since their abundance dramatically decrease in many diseases such as obese and type 2 diabetes (Chang et al., Citation2019; Cheng & Xie, Citation2020). In addition, has been evidenced that Akkermansia reduce fat-mass gain, LPS levels, and insulin resistance in obese mice (Everard et al., Citation2013). Recently it was reported that Akkermansia increases GLP-1 secretion, improving glucose homeostasis and ameliorating metabolic disease in high-fat diet-fed mice (Yoon et al., Citation2021). Thus, the presence of Allobaculum, Sutterella and Akkermansia in the cecal microbiota of HF-HS+A group, could be contributing to notably increment of GLP-1 and as well as to improve metabolic parameters. Consistently, correlation analysis revealed that Bacteroides, Allobaculum, and Akkermansia were negatively associated with body weight, WAT, and leptin concentration and positively correlated to GLP-1 levels. Moreover, Sutterella was inversely associated with WAT and LPS concentration and correlated positively with IL-10 and GLP-1 levels. Collectively, these results suggest that the agavins effects on obesity and inflammation could be mediated by gut microbiota modulation.
On the other hand, we show a significant difference in the fecal metabolomic profiles between HF-HS and HF-HS+A groups. Intriguingly, glucose was detected only in the feces of HF-HS+A group, and since this compound is mostly absorbed in the small intestine, when coming from of diet (Chen et al., Citation2016), possibly this metabolite could be derived from gut microbe’s breakdown of agavins. Besides, we observed an increment of hypoxanthine and uracil as well as a notably reduction of isoleucine in the feces of mice that received the agavins supplement. Similar results were reported in a previous study using inulin in HF-HS diet-fed rats (Guerville et al., Citation2019). Moreover, L-leucine, thymine, pentadecanoic acid, and octadecanoic acid, ethyl ester; were substantially enriched in the feces of HF-HS+A group and detected as possible biomarkers for prebiotic supplementation; additionally, some of these metabolites show a strong and negative correlation with pro-inflammatory cytokines (). Remarkably, this result is consistent with our previous work, in which uracil, L-leucine, thymine, octadecanoic acid, ethyl ester; and pentadecanoic acid were identified as biomarkers for agavins consumption and negative correlated to metabolic endotoxemia, low-grade inflammation and metabolic parameters in HF diet-feed mice (Huazano-García et al., Citation2020). However, since the present study was mostly exploratory, whether these metabolites mediate beneficial effects to host health require further evaluation. In addition, there is a limitation in this study because we did not include a standard-diet group (healthy mice) as reference to compare the improvement on mice health derived from agavins intake.
In summary, agavins supplementation can ameliorates several of the detrimental effects induced by consumption of a diet rich in fat and sugar such as body weight, WAT, and leptin levels. Furthermore, agavins showed a trend to decrease glucose, triglycerides, some inflammatory biomarkers (LPS, IL-1α, and IL-6), and insulin levels, but without reaching statistical significance, in relation to non-supplemented control group which could be due to exacerbated inflammation and insulin resistance, typical in HF-HS diet. On the other hand, agavins notably enriched the genera Bacteroides, Coprococcus, Clostridium, and Dehalobacterium. In addition, Allobacullum, Akkermansia, and Sutterella were identified as possible biomarkers for agavins prebiotic under this dietary regimen. Moreover, microbial taxas substantially enriched with agavins supplement showed a significant and negative correlation with body weight, WAT, LPS, and leptin levels as well as a positive association to levels of the anti-inflammatory interleukin IL-10 and the hormone GLP-1. Besides, some of metabolites increased significantly in the feces of HF-S+A group, and identified as possible biomarkers for agavins prebiotic, showed a negative correlation with WAT, LPS and pro-inflammatory cytokines. Altogether, these results suggest that the agavins effects on obesity could be mediated by gut microbiota modulation and their metabolites. Thus, this study provides new insights on the impact of agavins supplementation on the cecal microbiota composition and host responses to high fat-high sucrose diet-induced obesity, providing a useful focus for further studies in humans.
Disclosure statement
No potential conflict of interest was reported by the author(s).
References
- Bolyen, E., Rideout, J.R., Dillon, M.R., Bokulich, N.A., Abnet, C.C., Al-Ghalith, G.A., Alexander, H., Alm, E.J., Arumugam, M., & Asnicar, F., et al. (2019). Reproducible, interactive, scalable and extensible microbiome data science using QIIME 2. Nature Biotechnology, 37, 852–857.
- Callahan, B.J., McMurdie, P.J., Rosen, M.J., Han, A.W., Johnson, A.J.A., & Holmes, S.P. (2016). DADA2: High-resolution sample inference from Illumina amplicon data. Nature Methods, 13(7), 581–583. https://doi.org/10.1038/nmeth.3869
- Cani, P.D., Amar, J., Iglesias, M.A., Poggi, M., Knauf, C., Bastelica, D., Neyrinck, A.M., Fava, F., Tuohy, K.M., Chaboo, C., Waget, A., Delmée, E., Cousin, B., Sulpice, T., Chamontin, B., Ferrieres, J., Tanti, J.F., Gibson, G.R., Cateilla, L. … Burcelin, R. (2007). Metabolic endotoxemia initiates obesity and insulin resistance. Diabetes, 56(7), 1761–1772. https://doi.org/10.2337/db06-1491
- Chang, C.J., Lin, T.L., Tsai, Y.L., Wu, T.R., Lai, W.F., Lu, C.C., & Lai, H.C. (2019). Next generation probiotics in disease amelioration. Journal of Food and Drug Analysis, 27(3), 615–622. https://doi.org/10.1016/j.jfda.2018.12.011
- Chen, L., Tuo, B., & Dong, H. (2016). Regulation of intestinal glucose absorption by ion channels and transporters. Nutrients, 8(1), 43. https://doi.org/10.3390/nu8010043
- Cheng, D., & Xie, M.Z. (2020). A review of a potential and promising probiotic candidate-Akkermansia muciniphila. Journal of Applied Microbiology, 130(6), 1813–1822. https://doi.org/10.1111/jam.14911
- Choque Delgado, G.T., & Wmdsc, T. (2018). Role of prebiotics in regulation of microbiota and prevention of obesity. Food Research International, 113, 183–188. https://doi.org/10.1016/j.foodres.2018.07.013
- Christ, A., Lauterbach, M., & Latz, E. (2019). Western diet and the immune system: An inflammatory connection. Immunity, 51(5), 794–811. https://doi.org/10.1016/j.immuni.2019.09.020
- de Mello NP, Orellana, A.M., Mazucanti, C.H., de Morais Lima, G., Scavone, C., & Kawamoto, E.M., de Mello, N. P. (2019). Insulin and autophagy in neurodegeneration. Frontiers in Neuroscience, 13, 491. https://doi.org/10.3389/fnins.2019.00491
- Dray, S., & Doufour, A.B. (2007). The ade4 Package: Implementing the Duality Diagram for Ecologists. Journal of Statistical Software, 22(4), 1–20. https://doi.org/10.18637/jss.v022.i04
- Everard, A., Belzer, C., Geurts, L., Ouwerkerk, J.P., Druart, C., Bindels, L.B., Guiot, Y., Derrien, M., Muccioli, G.G., Delzenne, N.M., de Vos WM, & Cani, P.D., de Vos, W. M. (2013). Cross-Talk between Akkermansia muciniphila and intestinal epithelium controls diet-induced obesity. Proceedings of the National Academy of Sciences, 110(22), 9066–9071. https://doi.org/10.1073/pnas.1219451110
- Everard, A., Lazarevic, V., Gaïa, N., Johansson, M., Stahlman, M., Backhed, F., Delzenne, N.M., Schrenzel, J., François, P., & Cani, P.D. (2014). Microbiome of prebiotic-treated mice reveals novel targets involved in host response during obesity. The ISME Journal, 8(10), 2116–2130. https://doi.org/10.1038/ismej.2014.45
- Flint, H.J., Scott, K.P., Duncan, S.H., Louis, P., & Forano, E. (2012). Microbial degradation of complex carbohydrates in the gut. Gut Microbes, 3(4), 289–306. https://doi.org/10.4161/gmic.19897
- Gao, Y., Yang, L., Chin, Y., Liu, F., Li, R.W., Yuan, S., Xue, C., Xu, J., & Tang, Q. (2020). Astaxanthin n-octanoic acid diester ameliorates insulin resistance and modulates gut microbiota in high-fat and high-sucrose diet-fed mice. International Journal of Molecular Sciences, 21(6), 2149. https://doi.org/10.3390/ijms21062149
- Goodpaster, A.M., & Kennedy, M.A. (2011). Quantification and statistical significance analysis of group separation in NMR-based metabolomics studies. Chemometrics and Intelligent Laboratory Systems, 109(2), 162–170. https://doi.org/10.1016/j.chemolab.2011.08.009
- Guerville, M., Hamilton, M.K., Ronveaux, C.C., Ellero-Simatos, S., Raybould, H.E., & Boudry, G. (2019). Chronic refined low-fat diet consumption reduces cholecystokinin satiation in rats. European Journal of Nutrition, 58(6), 2497–2510. https://doi.org/10.1007/s00394-018-1802-2
- Guimarães, V.H.D., Lelis, D.F., Oliveira, L.P., Borém, L.M.A., Guimarães, F.A.D., Farias, L.C., de Paula, A.M.B., Guimarães, A.L.S., & Santos, S.H.S. (2020). Comparative study of dietary fat: Lard and sugar as a better obesity and metabolic mice model. Archives of Physiology and Biochemistry, 11, 1–11. https://doi.org/10.1080/13813455.2020.1835986
- Gwinn, D.C., Allen, M.S., Bonvechio, K.I., Hoyer, M.V., Beesley, L.S., & O’Hara, R. B. (2016). Evaluating estimators of species richness: The importance of considering statistical error rates. Methods in Ecology and Evolution, 7(3), 294–302. https://doi.org/10.1111/2041-210X.12462
- Huang, F., Zhao, R., Xia, M., & Shen, G.X. (2020). Impact of cyanidin-3-glucoside on gut microbiota and relationship with metabolism and inflammation in high fat-high sucrose diet-induced insulin resistant mice. Microorganisms, 8(8), 1238. https://doi.org/10.3390/microorganisms8081238
- Huazano-García, A., Shin, H., & López, M.G. (2017). Modulation of gut microbiota of overweight mice by agavins and their association with body weight loss. Nutrients, 9(9), 821. https://doi.org/10.3390/nu9090821
- Huazano-García, A., Silva-Adame, M.B., Vázquez-Martínez, J., Gastelum-Arellanez, A., Sánchez-Segura, L., & López, M.G. (2020). Highly branched neo-fructans (agavins) attenuate metabolic endotoxemia and low-grade inflammation in association with gut microbiota modulation on high-fat diet-fed mice. Foods, 9(12), 1792. https://doi.org/10.3390/foods9121792
- Igarashi, M., Morimoto, M., Suto, A., Nakatani, A., Hayakawa, T., Hara, K., & Kimura, I. (2020). Synthetic dietary inulin, Fuji FF, delays development of diet-induced obesity by improving gut microbiota profiles and increasing short-chain fatty acid production. PeerJ, 8, e8893. https://doi.org/10.7717/peerj.8893
- Kern, P.A., Saghizadeh, M., Ong, J.M., Bosch, R.J., & Simsolo, R.B., Simsolo, R. B. (1995). The expression of Tumor Necrosis Factor in human adipose tissue. Regulation by obesity, weight loss, and relationship to lipoprotein lipase. The Journal of Clinical Investigation, 95(5), 2111–2119. https://doi.org/10.1172/JCI117899
- Le, S., Josse, J., & Husson, F. (2008). FactoMiner an R Package for Multivariate Analysis. Journal of Statistical Software, 25(1), 1–18. https://doi.org/10.18637/jss.v025.i01
- Ley, R.E., Bäckhed, F., Turnbaugh, P., Lozupone, C.A., Knight, R.D., & Gordon, J.I. (2005). Obesity alters gut microbial ecology. Proceedings of the National Academy of Sciences, 102(31), 11070–11075. https://doi.org/10.1073/pnas.0504978102
- Li, X., Yang, L., Xu, M., Qiao, G., Li, C.J., Lin, L., & Zheng, G. (2021). Smilax china L. polyphenols alleviates obesity and inflammation by modulating gut microbiota in high fat/high sucrose diet-fed C57BL/6J mice. Journal of Functional Foods, 77, 104332. https://doi.org/10.1016/j.jff.2020.104332
- Liu, R., Hong, J., Xu, X., Feng, Q., Zhang, D., Gu, Y., Shi, J., Zhao, S., Liu, W., Wang, X., Xia, H., Liu, Z., Cui, B., Liang, P., Xi, L., Jin, J., Ying, X., Wang, X., Zhao, X., Li, W., Jia, H., Lan, Z., Li, F., Wang, R., Sun, Y., Yang, M., Shen, Y., Jie, Z., Li, J., Chen, X., et al. (2017). Gut microbiome and serum metabolome alterations in obesity and after weight-loss intervention. Nature Medicine, 23(7), 859–868. https://doi.org/10.1038/nm.4358
- Maedler, K., Dharmadhikari, G., Schumann, D.M., & Storling, J. (2011). Interleukin-Targeted therapy for metabolic syndrome and type 2 diabetes. In M. Schwanstecher (Ed.), Diabetes-perspectives in drug therapy. Handbook of experimental pharmacology (Vol. 203, pp. 257–278). Springer.
- Mancilla-Margalli, N. A., & López, M. G. (2006). Water-Soluble Carbohydrates and Fructan Structure Patterns from Agave and Dasylirion Species. Journal of Agricultural and Food Chemistry, 54(20), 7832–7839. https://doi.org/10.1021/jf060354v
- Masi, L.N., Martins, A.R., Crisma, A.R., Do Amaral CL, Davanso, M.R., Serdan, T., da Cunha de Sá R, Cruz, M.M., Alonso-Vale, M., Torres, R.P., Mancini-Filho, J., Pereira, J., da Silva Righetti MM, Macini-Filho, E.A., Hirabara, S.M., Curi, R., Do Amaral, C. L., da Cunha de Sá, R. D. C., & da Silva Righetti, M. M. (2017). Combination of a high-fat diet with sweetened condensed milk exacerbates inflammation and insulin resistance induced by each separately in mice. Scientific Reports, 7(1), 3937. https://doi.org/10.1038/s41598-017-04308-1
- Mi-Young, J., Hyo-Min, J., & Dong-Hyun, K. (2019). High-Fat diet causes psychiatric disorders in mice by increasing Proteobacteria population. Neuroscience Letters, 698, 51–57. https://doi.org/10.1016/j.neulet.2019.01.006
- Ogden, C.L., Yanovski, S.Z., Carroll, M.D., & Flegal, K.M. (2007). The epidemiology of obesity. Gastroenterology, 132(6), 2087–2102. https://doi.org/10.1053/j.gastro.2007.03.052
- Olson, N.C., Callas, P.W., Hanley, A.J.G., Festa, A., Haffner, S.M., Wagenknecht, L.E., & Tracy, R.P. (2012). Circulating levels of TNF-α are associated with impaired glucose tolerance, increased insulin resistance, and ethnicity: The insulin resistance atherosclerosis study. The Journal of Clinical Endocrinology & Metabolism, 97(3), 1032–1040. https://doi.org/10.1210/jc.2011-2155
- Ormazabal, V., Nair, S., Elfeky, O., Aguayo, C., Salomon, C., & Zuñiga, F.A. (2018). Association between insulin resistance and the development of cardiovascular disease. Cardiovascular Diabetology, 17(1), 122. https://doi.org/10.1186/s12933-018-0762-4
- Pedregosa, F., Varoquaux, G., Gramfort, A., Michel, V., Thirion, B., Grisel, O., Blondel, M., Prettenhofer, P., Weiss, R., Dubourg, V., Vanderplas, J., Passos, A., Cournapeau, D., Brucher, M., Perrot, M., & É, D. (2011). Scikit-learn: Machine learning in phyton. Journal of Machine Learning Research : JMLR, 12(85), 2825–2830.
- Ravussin, Y., Koren, O., Spor, A., LeDuc, C., Gutman, R., Stombaugh, J., Knight, R., Ley, R.E., & Leibel, R.L. (2012). Responses of gut microbiota to diet composition and weight loss in lean and obese mice. Obesity, 20(4), 738–747. https://doi.org/10.1038/oby.2011.111
- Rodríguez-Daza, M.-C., Daoust, L., Boutkrabt, L., Pilon, G., Varin, T., Dudonné, S., Levy, É., Marette, A., Roy, D., & Desjardins, Y. (2020). Wild blueberry proanthocyanidins shape distinct gut microbiota profile and influence glucose homeostasis and intestinal phenotypes in high-fat high-sucrose fed mice. Scientific Reports, 10(1), 2217. https://doi.org/10.1038/s41598-020-58863-1
- Rohr, M.W., Narasimhulu, C.A., Rudeski-Rohr, T.A., & Parthasarathy, S. (2020). Negative effects of a high-fat diet on intestinal permeability: A review. Adv Nutr, 11(1), 77–91. https://doi.org/10.1093/advances/nmz061
- Segata, N., Izard, J., Waldron, L., Gevers, D., Miropolsky, L., Garrett, W.S., & Huttenhower, C. (2011). Metagenomic biomarker discovery and explanation. Genome Biology, 12(6), R60. https://doi.org/10.1186/gb-2011-12-6-r60
- Shoelson, S.E., Herrero, L., & Naaz, A. (2007). Obesity, inflammation, and insulin resistance. Gastroenterology, 132(6), 2169–2180. https://doi.org/10.1053/j.gastro.2007.03.059
- Sugatani, J., Osabe, M., Wada, T., Yamakawa, K., Yamazaki, Y., Takahashi, T., Ikari, A., & Miwa, M. (2008). Comparison of enzymatically synthesized inulin, resistant maltodextrin and clofibrate effects on biomarkers of metabolic disease in rats fed a high-fat and high-sucrose (cafeteria) diet. European Journal of Nutrition, 47(4), 192–200. https://doi.org/10.1007/s00394-008-0713-z
- Tan, H., Zhao, J., Zhang, H., Zhai, Q., & Chen, W. (2019). Novel strains of Bacteroides fragilis and Bacteroides ovatus alleviate the LPS-induced inflammation in mice. Applied Microbiology and Biotechnology, 103(5), 2353–2365. https://doi.org/10.1007/s00253-019-09617-1
- Wang, C., Zhang, H., Liu, H., Zhang, H., Bao, Y., Di, J., & Hu, C. (2020). The genus Sutterella is a potential contributor to glucose metabolism improvement after Roux-en-Y gastric bypass surgery in T2D. Diabetes Research and Clinical Practice, 162, 108116. https://doi.org/10.1016/j.diabres.2020.108116
- Yang, Z.-H., Miyahara, H., Takeo, J., & Katayama, M. (2012). Diet high in fat and sucrose induces rapid onset of obesity-related metabolic syndrome partly through rapid response of genes involved in lipogenesis, insulin signalling and inflammation in mice. Diabetology & Metabolic Syndrome, 4(1), 32. https://doi.org/10.1186/1758-5996-4-32
- Yoon, H.S., Cho, C.H., Yun, M.S., Jang, S.J., You, H.J., Kin, J.H., Han, D., Cha, K.H., Moon, S.H., Lee, K., Kin, Y.J., Lee, S.J., Nam, T.W., & Ko, G.P. (2021). Akkermansia muciniphila secretes a glucagon-like peptide-1-inducing protein that improves glucose homeostasis and ameliorates metabolic disease in mice. Nature Microbiology, 6(5), 563–573. https://doi.org/10.1038/s41564-021-00880-5
Appendix A
Figure A1. Agavins supplementation modified the cecal microbiota composition of mice fed with a high fat-high sucrose diet. (A) Chao1 index (number of unique ASV), (B) Shannon diversity index (quantitative measure of community richness), (C) Principal coordinate analysis (PCoA) plot of cecal communities. For each experimental group (n = 5). * indicates significant difference (p < 0.05; Kruskal-Wallis test).
Apéndice Figura 1. La suplementación con agavinas modificó la composición de la microbiota cecal de ratones alimentados con una dieta alta en grasas y sacarosa. (A) Índice Chao1 (número de ASV únicas), (B) Índice de diversidad de Shannon (medida cuantitativa de la riqueza de la comunidad), (C) análisis de coordenadas principales (PCoA) de las comunidades cecales. Para cada grupo experimental (n= 5). * indica una diferencia significativa (p < 0.05; prueba de Kruskal-Wallis).