
 ?Mathematical formulae have been encoded as MathML and are displayed in this HTML version using MathJax in order to improve their display. Uncheck the box to turn MathJax off. This feature requires Javascript. Click on a formula to zoom.
ABSTRACT
The effects of xanthan gum and pectin at two concentrations each (0.2% and 0.5%) on storage quality (texture, moisture, water activity (aw), fat content, peroxide value, and colour attributes) of deep-fried dough (magwinya) were analysed across 3 days. The moisture content of the magwinya samples ranged from 38.67% to 44.67% and decreased significantly during storage. The crumb, crust hardness, and chewiness increased (P < 0.05) with storage time. The aw ranged from 0.64 to 0.85 on the first day and decreased during storage. The fat content of samples ranged from 6.60% to 7.31% and was significantly lower than the control (10.20%). The peroxide values showed no difference for all samples. Significant differences were observed for crumb and crust colour profiles from the first to the third day among all samples. The preservation effect of hydrocolloids is attributed to controlling and maintaining the moisture content and stabilising the product.
1. Introduction
During storage, bread-like products undergo quality changes such as crust toughening, firming of the crumb, and loss of moisture, flavour, and freshness of bread products (Şimşek, Citation2020). Staling occurs when amylose retrogrades, amylopectin recrystallises, and amylose-lipid complex, coupled with re-distribution of water leading to toughening of the crust, firming of the crumb, loss of moisture and flavour, and a corresponding loss in product freshness (Davidou et al., Citation1996; Fadda et al., Citation2014; Gray & Bemiller, Citation2003; Şimşek, Citation2020). Deep-fried and baked products undergo changes in the crumb, also known as staling; the resulting changes are not from the action of spoilage microbes, but the re-aggregation of starch molecules in a process known as retrogradation they decrease consumer acceptance of the products (e.g. bread, doughnut, magwinya). Loss of crumb freshness over time (hardness) is an essential indicator of staling used mainly by consumers and researchers to monitor the freshness of products (Fadda et al., Citation2014).
There are two categories of staling: crust and crumb staling. Crust staling results when moisture moves from the crumb to the crust (Melito & Farkas, Citation2013), causing a leathery texture and is less objectionable than crumb staling (Aguirre et al., Citation2011). The crumb hardness level differs with position within the baked product (i.e. bread), with high hardness resulting in the central crumb portion (Şimşek, Citation2020). The high protein content has been associated with crumb softness and the slow firming rate of the crumb. Similarly, a higher water absorption results in a soft crumb and a slower firming pace. It is more critical to prevent moisture loss after processing than to increase the initial moisture content of the product (Abu‐ghoush et al., Citation2008).
Magwinya/ vetkoek is a famous deep-fried dough in Southern Africa and other regions of Africa. It has a high oil absorption capacity − 14% per 100 g dry weight (Onipe et al., Citation2019; Oktay & Sadıkoğlu, Citation2018). Magwinya is produced using different ingredients, which serve various functions in the product. Wheat flour is the primary ingredient that provides structure without excessive toughness due to its high protein (gluten) content. Sugar provides sweetness, accelerates yeast fermentation, and promotes Maillard reaction during frying. Baker’s yeast is the raising agent in the dough. Salt enhances the flavour, while water hydrates the flour macromolecules and controls viscosity. The cooking oil is the frying medium (Onipe et al., Citation2018).
Hydrocolloids are mainly used as binders in gluten-free baked goods to modify the qualities of finished baked products and dough rheology (Ai et al., Citation2018). Xanthan gum has high viscosities even when used at low concentrations and is entirely soluble in cold and hot water (Kaur et al., Citation2015). Xanthan gum improves the quality of freshly baked products and retard staling by slowing down the interaction between amylose molecules, thereby slowing down starch retrogradation (Guarda et al., Citation2004; Salehi, Citation2020). On the other hand, the staling-reducing effect of pectin is linked to its ability to compete with water and prevent the recrystallisation of amylopectin (Fadda et al., Citation2014). Using xanthan gum in cassava and rye bread recipes extended the shelf-life and improved their quality (Shittu et al., Citation2009). Pectin is an anti-staling agent and improver in wheat bread, yielding higher specific volume, enhanced sensory characteristics and softer crumb (Rosell & Santos, Citation2010; Yaseen et al., Citation2010). Hydrocolloids have been reported to reduce the oil uptake and improve the quality of doughnuts (Yazdanseta et al., Citation2015). The shelf life of packaged magwinya in styrofoam plates covered with transparent polythene bags stored at room temperature is 2 days (Onipe et al., Citation2019). Hydrocolloids are known to reduce oil uptake and elongate the shelf-life of bakery products (Siriwongwilaichat & Kongpanichtrakul, Citation2021). With very little known about the quality of magwinya during storage, the focus of this study is to evaluate the effects of different levels of xanthan gum and pectin on the storage quality of deep-fried dough (magwinya) across 3 days.
2. Materials and methods
2.1. Materials
Cake wheat flour (Sasko mills, SA), sugar, salt, yeast, vegetable oil (sunflower oil), xanthan gum (Nature’s Choice, South Africa), and citrus pectin (Alfa Aesar, U.S.A) were sourced locally. Analytical grade petroleum ether (40–60°C) was used for soxhlet extraction.
2.2. Experimental design
Pectin and xanthan gum were substituted in wheat flour, each at 0.2% and 0.5% and the control sample contained no hydrocolloid (i.e. 100% wheat flour). The amounts of pectin and xanthan gum added were chosen after carefully reviewing the literature on previous bakery products wherein these hydrocolloids were used. The ingredients for dough formulations are presented in , consisting of five samples. From each sample, a population was produced, and three fried dough samples of closely similar weights were randomly selected for each analysis. The analysis was performed in triplicates on each sample to determine the texture, colour (crumb and crust), peroxide value, moisture content, water activity (aw) for 3 days, and fat content on the first day.
Table 1. Ingredients for fried dough (in grams).
2.3. Fried dough (magwinya) production
The fried dough samples were produced using the previously described method (Kwinda et al., Citation2018). Dry ingredients – wheat flour (100 g), sugar (15 g), salt (1 g), yeast (1 g), xanthan gum (0.2 & 0.5%), and pectin (0.2 & 0.5%) were thoroughly mixed with lukewarm water (30°C) and mixed manually for 5 min until a homogenous wet sticky dough was formed. The control sample was made from 100% wheat flour and contained no hydrocolloids. The dough was fermented at ambient temperature (±30°C) for 45 min, then deep fried in the oil for 5 min at 180°C. Frying experiments were performed in a deep fryer (Russel Hobbs RDF300, South Africa) with temperature and time control. The frying oil temperature was stabilised by heating it to 180°C and allowing it to stay 1 h before frying commenced. After frying, the products were placed on a paper towel to absorb excess oil and cooled down to room temperature (±25°C), individually wrapped in foil paper to prevent exposure to light and stored in polythene bags to prevent moisture loss and stored in a cool and dark place at 25°C. Samples for day 1 were analysed after 1 h of cooling. For subsequent days, individual samples were unwrapped and analysed. Pectin magwinya was designated as PM and xanthan gum magwinya as XGM.
2.4. Moisture analysis of fried dough
Method 44-19-01 of the American Association of Cereal Chemists [AACC] (Citation2000) was used to analyse the moisture content of the fried dough. The forced-air oven dryer (Ottimo, S/N.: JD13015061) was pre-heated to 105°C. Magwinya samples were thinly sliced, containing both crumb and crust. The sample (5 g ±1 mg) was weighed into a moisture dish and dried to constant weight in the forced-air oven dryer (Ottimo, S/N.: JD13015061). Dried samples were cooled in a desiccator and weighed. Moisture content was calculated using EquationEquation (1)(1)
(1)
2.5. Water activity (aw)
The aw of the fried dough samples was tested using the Lab Touch – Water Activity Meter (Novasina, U.S.A). This instrument was first cleaned and calibrated using the Novasina SAL-T standards. To calibrate, the environmental temperature was at 25°C ±2°C. The. SAL-T standard was shaken (to activate the salt-water slurry) before being placed in the measurement chamber. The SAL-T humidity standard was put into the measurement chamber and closed left in the chamber for 45 min to establish the humidity equilibrium. Then the machine was calibrated. Crumbs of magwinya were cut and immediately placed in small cups and inserted into the instrument. Water activity levels were recorded when the instrument reached equilibrium (Wanjuu et al., Citation2018)
2.6. Fat content determination
Fat content was determined using the AACC method 30–25.01 (1999). Thinly sliced (5 g) fried dough sample (containing both crumb and crust) was dried at 135°C in a forced-air oven dryer (Ottimo, S/N.: JD13015061) and pulverised with a coffee grinder. The fat content of the ground samples was extracted in a Soxhlet extractor using petroleum ether (40–60°C) for 4 h at condensation rates of 5–6 drops/sec rate. The ether was removed from the collection flask at a low temperature. The fat remaining in the collection flask was dried (this procedure was repeated until a constant weight was reached) and cooled in a desiccator. The beaker with extract was weighed. Fat content was calculated using EquationEquation (2).(2)
(2)
2.7. Peroxide value
Fat is a significant component of magwinya, which, when exposed to light and air auto-oxidation (lipid oxidation) takes place, leading to rancidity and reduced shelf life. Peroxides were measured using an adaptation of the American Oil Chemists Society Peroxide Value Acetic Acid-Chloroform Method Cd 8–53 (American Oil Chemists Society [AOCS], Citation1998). First, 5 g of dried ground sample was placed into a 250 ml Erlenmeyer flask, and 30 ml of acetic acid: chloroform (3:2) solution was added. The flask was swirled to dissolve the sample. This mixture was then homogenised and filtered to remove any solids. Approximately 0.5 ml of saturated KI solution was added to the mix using a pipette and allowed to stand for 1 min with occasional shaking. Afterwards, 30 ml of distilled water was added. This solution was titrated with 0.01 M sodium thiosulfate until the yellow iodine colour disappeared. Droplets totalling 5 ml of starch indicator solution were added, and the titration continued until the colour disappeared. Blank determination of the reagents was also conducted. The peroxide value was calculated using EquationEquation (3)(3)
(3)
where: n1 = sample titre, n2 = blank titre, m = sample mass and Ip = peroxide value.
2.8. Texture profile analysis
The method described by Ndlala et al. (Citation2019) was used in the measurement of texture profile (hardness, springiness, cohesiveness, and chewiness) of fried dough samples using a texture analyser TA-XT2i (Stable Micro Systems, Godalming, England). Fresh, cooled samples were subjected to a two-cycle compression test using a 36 mm cylindrical probe, 5 kg load cell, a trigger force of 5 g, 50% strain force at 1 mm/s pre-test speed, and 2 mm/s each for test and post-test speed. Before conducting the test, the probe height was calibrated. For crust-to-crumb texture, the whole magwinya sample was used. For crumb texture, a cube sample (2 × 2 × 2 cm) was cut from the crumb, and the samples were placed centrally beneath the probe to meet a consistent flat surface. Readings were carried out in triplicates, and texture profile parameters were obtained from the curves. The TPA parameters – hardness, springiness, cohesiveness, and chewiness – were calculated using EquationEquations (4(4)
(4) -Equation7)
(7)
(7) .
2.9. Colour determination
The colour properties of the crumb and crust of fried dough samples were measured using the Colour Flex Spectrophotometer (Hunter Associates Laboratory, Reston, VA., U.S.A) as described by Ndlala et al. (Citation2019). The instrument was standardised with a black and white ceramic slab, as indicated by the manufacturer. The colour of the crust and the crumb of three samples from the same experimental pool were measured. Whole magwinya pieces were placed in the sample cup, covered, and scanned with the spectrophotometer for crust measurement. The magwinya were sliced to expose the crumb for colour measurement. Hunter values L* a* and b* values were collected; where L* measured lightness from black to white (0–100); a* was indicating red (+) to green (–); while b* measured yellow (+) to blue (-). Hue, Chroma, and colour change were calculated from L* a* b* values obtained from the samples using EquationEquation 10(10)
(10) .
2.10. Statistical analysis
All data generated were analysed using SPSS software version 26. The data were subjected to a one-way analysis of variance, and differences in mean values were made using Duncan’s multiple comparison test at a P < 0.05 level of significance (Duncan, Citation1955). Texture and colour data were analysed using multivariate analysis of data (MANOVA), and significance was determined with the LSD test.
3. Results and discussion
3.1. Moisture content of the fried dough (magwinya)
Consumers associate bread staling with a noticeable drying out of the crumb, and higher moisture contents are related to more crumb freshness (Raffo et al., Citation2003). The moisture content of PM and XGM samples were significantly higher than the control across the 3 days (). The control sample showed the highest decline from day 1 to day 3, decreasing from 38.67% to 32.67%. There was no significant difference among samples PM0.2, PM0.5, and XG0.5 on the first day. The moisture content of magwinya ranged from 38.67% to 44.67% on the first day, with the control sample showing the lowest moisture content (38.67%) and XGM0.5 showing the highest moisture content (44.67%). The addition of xanthan gum increased the initial moisture by 2% in XGM0.2 and 6% in XGM0.5 compared to the control sample. Sample PM0.2 and PM0.5 also increased the moisture content by 4.66% and 5.33%, respectively. XGM0.2 had the lowest moisture loss over the three-day storage period, losing 2% of its initial moisture. XGM0.5 had the highest moisture content from day 1 to day 3.
Figure 1. Effects of pectin and xanthan gum on the moisture content of the fried dough. Bars with superscripts in uppercase (X – Z) in the category show significant difference (P < 0.05) among samples within the same day, while bars with superscripts in lowercase (a – c) in the series show significant difference (P < 0.05) within the same sample from day 1 to day 3 using Duncan’s multiple range tests. PM and XGM represent magwinya with pectin and xanthan gum.
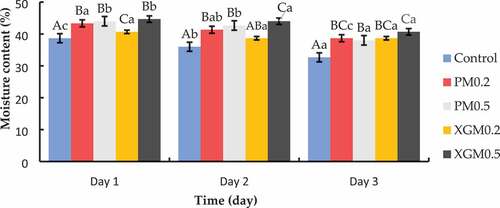
These results indicate that pectin and XG enhanced moisture retention in the samples across the 3 days compared to the control samples. Pectins are a family of cell wall polysaccharides belonging to the glycan domain (Singhal & Hulle, Citation2022). They are hydrophilic and compete with starch for water absorption, thereby lowering the hydration of starch molecules. Moreover, pectins can cause the moistening of bread dough during baking by desorbing moisture, causing the starch to gelatinise even more (Donchenko et al., Citation2020). Moisture retention in xanthan gum is facilitated by hydroxyl groups which allow more interaction with water through hydrogen bonds, thus leading to moisture retention in the products (Burešová et al., Citation2016). During retrogradation, water is slowly released from the hydrocolloids, leading to higher water retention than the control sample, where retrogradation usually occurs.
Higher moisture implies a softer and easily compressed loaf (Cauvain, Citation2003). Bread containing higher moisture levels generally stales more slowly (Fadda et al., Citation2014). Guarda et al. (Citation2004) found that bread containing xanthan gum had slightly higher moisture content and staled at a reduced rate. Yazdanseta et al. (Citation2015) reported an increase in the moisture content of doughnuts when pectin increased in the formulation. Moisture content and moisture migration from crumb to crust are believed by many to be significant factors contributing to staling (Fadda et al., Citation2014).
3.2. Water activity (aw)
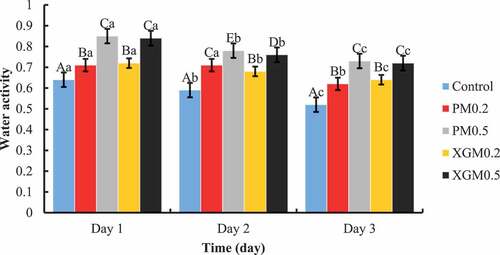
The aw values of fried dough samples from day 1 to day 3 of storage are presented in . The aw of all samples decreased (P < 0.05) during storage. The reduction of aw values was as follows: 0.64–0.52 (control), 0.71–0.62 (PM0.2), 0.85–0.73 (PM0.5), 0.72–0.64 (XGM0.2) and 0.84–0.72 (XGM0.5) from first to the third day of storage, respectively. Adding pectin and xanthan gum significantly increased the aw compared to the control. Sample PM0.5 showed the highest increase in the aw and retained high water levels across the 3 days of storage. Rosell and Santos (Citation2010) also reported an increase in water activity due to the higher water-holding capacity of the hydrocolloids when used in bread. The change in aw in bread is an important issue. Water activity decreases with bread storage and parallels the corresponding moisture content (Czuchajowska & Pomeranz, Citation1989). Higher aw indicates a greater tendency for water to escape. During storage, water within the bread is relocated from regions of the less-bound state to regions of the more-bound state. Therefore, it implies that a decrease in aw would occur during storage. Most of the water in bread dough is adsorbed to the gluten, soluble proteins, and pentosans. When the dough is heated during baking, some water is involved in starch gelatinisation, but a significant fraction remains attached to those other components, which compete for the available moisture (Fadda et al., Citation2014; M. Y. Kim & Chun, Citation2009). Hydrocolloids have a higher molecular weight and are not as efficient at lowering aw, hence the higher aw values in PM and XGM samples. The hydroxyl group of hydrocolloids interacts with water through hydrogen bonding, thus, maintaining a high-water activity (Palav, Citation2016). Water activity levels were significantly higher in XGM and PM samples. Mohammadi et al. (Citation2014) concluded that the ability of xanthan gum to retain moisture and form a complex with starch is important and inhibits retrogradation, thus reducing the rate of staling.
Figure 2. Effects of pectin and xanthan gum on the water activity of fried dough. Bars with superscripts in uppercase (A-E) in the category show significant differences (P < 0.05) among samples within the same day, while bars with superscripts in lowercase (a–c) in the series show significant differences (P < 0.05) within the same sample from day 1 to day 3 using Duncan’s multiple range tests. PM and XGM represent magwinya with pectin and xanthan gum.
3.3 Fat content of fried dough samples
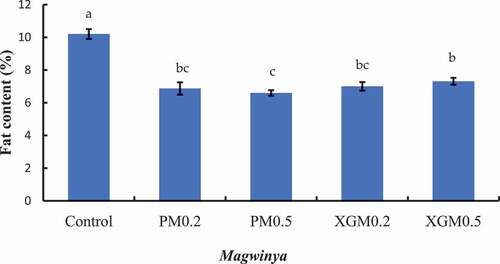
The fat content of fried dough samples is presented in . The results show that the control sample had significantly (P < 0.05) higher fat content (10.2%). Amongst the other samples, PM0.5 had the lowest fat content (6.60%), with XGM0.5 having the higher fat content (7.37%). Yazdanseta et al. (Citation2015) reported a 50% reduction in doughnuts when 0.70% pectin was used. Low oil content in the xanthan gum and pectin samples may have delayed the onset of primary rancidity, as low-fat foods are associated with delayed rancidity.
Figure 3. Effects of pectin and xanthan gum on the fat content of magwinya. Bars with different superscripts show a significant difference (P < 0.05) among the samples using the Duncan range test. PM and XGM represent pectin and xanthan gum samples.
About 20% of the total fat uptake occurs during deep-frying, and the remaining 80% happens after removing the fried products. This phenomenon is related to the adhesion of oil to the surface of the product and the draining phenomena (Primo-Martín et al., Citation2010). Two mechanisms explain fat uptake: condensation and capillary forces and oil penetration through the pores inside the product. Hydrocolloids alter the water-holding capacity of the dough and consequently affect oil absorption (Yazdanseta et al., Citation2015). The results in this study evinced the ability of xanthan gum and pectin to reduce oil absorption could be due to an increase in water-holding capacity (I. Mandala et al., Citation2007; Rosell & Santos, Citation2010) by entrapping the food moisture inside and preventing moisture replacement with oil (Singthong & Thongkaew, Citation2009).
3.4. Peroxide value
Peroxide value (PV) monitors the number of peroxides formed in a food product and is expressed as milliequivalents O2 per kilogram of fat. The peroxide values of fried dough samples are presented in . The peroxide value ranged from 5.47 to 5.60 mEq/kg from day 1 to day 3. No significant differences (P < 0.05) were found among peroxide values for all the samples for the 3 days of storage. The PV gives the initial evidence of rancidity in fats and measures the extent to which an oil sample has undergone primary oxidation. The fresh sample has a PV lower than 10 mEq/kg, while the oil is oxidised at a PV above 20 mEq/kg (Sebastian et al., Citation2014). The results show that the PV is below 10 mEq/kg from day 1 to day 3, indicating a low primary rancidity level. Peroxides are the initial products formed from and are one indication of rancidity.
Table 2. Peroxide value of fried dough samples from day 1 to day 3 of storage.
3.5 Texture profile of fried dough
Texture plays a vital role in influencing the acceptability of fried products (Zolfaghari et al., Citation2013). The texture properties of fried foods depend on the processing conditions, such as temperature and frying time, ingredients used, and the properties of raw materials, such as the size of starch granules, starch content, and cell wall polysaccharides (Oyedeji et al., Citation2017). The texture profile of the crumb and crust of fried dough samples are presented in , respectively. Adding pectin and xanthan gum altered the textural properties from day 1 to day 3 of storage. The crumb and crust-to-crumb hardness of fried dough with 0.2% and 0.5% xanthan gum were not significantly different on the first and second days of storage. The hardness and chewiness of all samples increased with storage time. Pectin and xanthan gum samples (crust and crumb) had a softer texture than the control across all days of storage. The decrease in hardness might be due to the ability of hydrocolloids to compete for water molecules, thus reducing the re-crystallization of amylopectin, thereby extending the shelf life of baked products via the prevention of water loss during processing (Rosell & Santos, Citation2010).
Table 3. Crumb texture profile of fried dough samples over 3 days of storage.
Table 4. Crust-to-crumb texture profile of fried dough samples over 3 days of storage.
The increase in hardness is a direct function of bread (including crust) moisture content (Fadda et al., Citation2014). As shown in , PM and XGM samples had high moisture from day 1 to day 3, hence less in firmness. Using pectin and xanthan gum reduced the hardness compared to the control samples. A factors such as moisture content, redistribution of water in a product, gluten starch interactions and starch retrogradation play a vital role in the hardness of fried and baked products (Ndlala et al., Citation2019). Crumb hardness doubled by day 2 of storage. A similar trend was reported by Tebben and Li (Citation2019) in wholewheat bread with 0.4% of xanthan gum. Chewiness measures the energy required to disintegrate a food before swallowing it (Lu et al., Citation2010). Crumb chewiness significantly increased in all the samples from day 2 of storage. This increase is a direct link to increased hardness and recrystallisation of amylopectin. There was no significant increase in the crumb springiness in most samples across the storage period, except for sample PM0.5. A similar trend was observed for crumb cohesiveness (). Xanthan gum and pectin lowered the hardness of fried dough during storage compared to the control. This reduced the hardness rate and, in turn, positively affected other textural properties during storage. Sasaki (Citation2018) reported a slow deterioration rate of bread when xanthan gum was used.
Food chewiness is one of the texture parameters easily correlated with sensory analyses (Ndlala et al., Citation2019). The chewiness of magwinya (crust and crumb) followed a similar trend to hardness. Springiness measures elasticity by determining the extent of recovery between the first and second compression (J. Kim et al., Citation2015). Cohesiveness is the ability of a material to stick to itself, and it quantifies the internal resistance of food structure (Sasaki, Citation2018). The crust hardness of all samples was lower on the first day, significantly increased during storage, and was highest on day 3 of storage. Due to increased moisture retention in XGM samples, they had the lowest hardness values, implying they were the softest samples. Fried dough samples were less cohesive than the control on days 1 to 3 ().
3.6. Colour profile of fried dough
Colour is one of the main factors that affect food product acceptability at the time of consumer purchase. The colour of the crust and crumb has been an essential parameter for fried products. The crust of fried products is usually darker than the crumb, as seen in the products in our study (); and the significant limitation of product darkening could negatively affect the sensory properties of the final product. The colour profile properties that were measured were lightness (L*), redness (a*), yellowness (b*), Hue, Chroma, and colour change (ΔE) which are presented in .
Figure 4. Fried dough samples (XG – xanthan gum, PC – pectin).
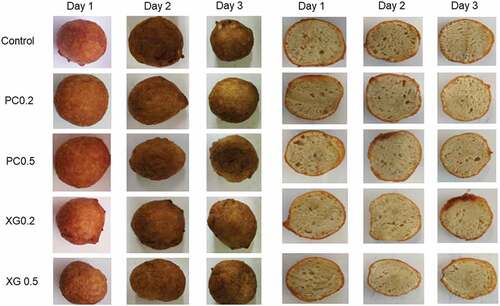
Table 5. Crust colour profile of fried dough samples over 3 days of storage.
Table 6. Crumb colour profile of fried dough samples over 3 days of storage.
3.6.1 Crust colour
The crust L* values ranged from 42.25 (XGM0.5) to 46.98 (PM0.2) on the first day (). Samples XGM0.2 and XGM0.5 had lower crust L* values (). Control and PM0.5 samples were significantly different from the other samples. The L* value of all samples decreased as storage time increased on all samples. Control and PM0.5 samples were very similar on the first day of storage, but on the final day of storage, the control sample had the highest (42.91) L* value, and sample PM0.5 had the lowest (36.33) L* value as compared to other samples. Caramelisation and Maillard reaction, which occurs during frying, caused the colour changes in the crust of the fried dough products (Onipe et al., Citation2018), hence the darker colour. Xanthan gum lowered the lightness compared to control and pectin samples. The a* values of crust increased as storage time increased. On the first day of storage, control (18.07) and XGM0.2 (18.05) crust samples significantly differed from the other samples and showed higher a* values. On the final day of the storage, the control sample was significantly different from the other samples.
The crust b* values of all samples increased as storage time increased, and there was a significant difference across the 3 days of storage on all samples. The crust b* value of XGM0.5 and PM0.2 was significantly (P < 0.05) lower than the control sample, whereas PM0.5 was significantly (P < 0.05) higher than the control sample on the first day. On the final day of storage, PM0.5 and XGM0.5 crust b* values were significantly lower than the control. The XGM and PM samples had a higher yellowness than the control sample. The changes in the redness and yellowness of the samples during storage may be attributed to non-enzymatic reaction from the interaction between sugars and amino acids. Furthermore, overall variation in crust a* and b* could be attributed to the colour pigments of pectin and xanthan gum and frying temperature.
Hue angle is the qualitative attribute of colour that defines the variation of a particular colour regarding a grey colour with similar lightness (Pathare et al., Citation2013). The hue angles for the crust ranged from 55° to 65° indicating red to yellow hues, as the values are less than 90° (Pathare et al., Citation2013). Sample PM0.5 and XGM0.2 decreased the hue angle over 3 days of storage, while other samples showed an increase in the hue angle. The difference in the degree of hue angle compared to grey colour with the same lightness is a measure of chroma. The high colour intensity in samples perceived by humans is denoted by high chroma values (Pathare et al., Citation2013). Over the 3 days of storage, there was an increase in the crust chroma as also indicated by the variation in a* and b* values. There was no significant difference between the control and XGM0.2 samples on the first and final days of storage. There was no significant difference between the control and PM0.2 samples. The addition of xanthan gum and pectin increased the chroma over the storage time on the crust.
Colour change in thermally processed foods is characterised by brown colour, usually, because of Maillard and caramelisation reactions between reducing sugars and amine groups are responsible for the browning of products during high-heat processing such as frying and baking (Onipe et al., Citation2018). Colour change indicates the difference between test and control samples. Sample PM0.5 had the lowest colour difference (1.79) on the first day and the highest (7.10) on the final day of storage. The colour difference of samples PM0.2 and XGM0.5 decreased over time and samples XGM0.2 and PM0.5 increased over time.
3.6.2 Crumb colour
Crumb of the cereal fried dough samples with pectin and xanthan gum had significantly (P < 0.05) lower L* values (lightness) compared to the control on the first 2 days and significantly (P < 0.05) higher L* values compared to the control on the third day. As storage time increased, the L* value of all samples decreased except for sample XGM0.2 which decreased on day 2 and increased on day 3. The PM and XGM samples were significantly different across all days of storage. The crumb of samples containing pectin and xanthan gum were darker than the control on days one and two of storage, and on the third day, the control sample was darker than the test samples. Both xanthan gum and pectin are creamy-white, and when hydrated and heated, they have fair and transparent properties (Palav, Citation2016). Adding pectin and xanthan gum, in turn, decreased the lightness of the fried dough samples by adding a cloudy colour element. The reduced lightness value of magwinya during storage may be explained by moisture loss which reduced the opacity of the magwinya crumb, leading to a darkening effect. Moreover, a more pronounced darkening effect in XGM samples could be due to the shrinkage effect of xanthan gum on the crumb, leading to a cluster of the crumb cells, and in turn, a darkening effect (Hadnađev et al., Citation2013). Souther (Citation2005) also reported lower bread lightness values when adding xanthan gum to the bread dough. Yazdanseta et al. (Citation2015) reported increased doughnut lightness when using pectin. The use of pectin and xanthan gum lowered the lightness in the crumb compared to the control sample.
The crumb a* value of all samples increased as storage time increased, and on the final day of storage, the control sample had the highest (2.60) a* value. The control sample crumb redness (a*) value was significantly lower (0.94) than the other samples on the first day. An observed trend in shows that the higher the crumb lightness (L* value), the lower the crumb redness (a* value). The use of pectin and xanthan gum lowered the redness in the crumb compared to the control sample. The crumb of fried dough samples containing xanthan gum and pectin was significantly more yellow than the control on the first day of storage.
The b* value increased with the addition of pectin and xanthan gum. Tebben and Li (Citation2019) reported an increase in the b* value of whole wheat bread with an increase in xanthan gum content. The crumb b* value of control, PM0.2, PM0.5 and XGM0.5 increased with storage time, and there was a significant difference across the 3 days of storage on all samples (). The increase in crumb b* values can be attributed to the yellow tint of the hydrocolloids used. Although the colour change is not visible to the human eye, the spectrophotometer detected a change compared to the control sample. These results agree with I. G. Mandala and Sotirakoglou (Citation2005), who found that hydrocolloids produced higher b* values, indicating more yellowness on bread. Yazdanseta et al. (Citation2015) reported increased doughnut yellowness when using pectin.
The hue angle of all samples decreased with storage. A significant difference was found on the first day of storage on the crumb hue angle. The addition of xanthan gum and pectin reduced the hue angle compared to the control on the crumb. The crumb chroma ranged from 20 to 25. There was an increase in the crumb chroma, except for sample XGM0.2, which showed a decrease in chroma. There was a significant difference between the control crumb and other samples on the first and final days of storage. As storage time increased, the colour difference decreased, except for sample PM0.2. XGM0.2 showed the highest (6.67) colour change on day 1 of storage, and XGM0.5 had the lowest (1.28) colour change on day 3 of storage on the crust. All samples showed low values of colour difference on the final day of storage.
4. Conclusion
The use of hydrocolloids moderately improved the properties of fried dough. The use of pectin at 0.5% lowered the fat content by 34.29%. When comparing pectin and xanthan gum, pectin had better fat-reduction properties, probably due to its high affinity for water. There was no difference in the peroxide value (rancidity) of the samples over the storage period. The hydrocolloids (pectin at 0.2 & 0.5% and xanthan gum at 0.5) reduced the rate of moisture loss and significantly increased the water activity of the fried dough samples. Xanthan gum reduced moisture loss and hardness better than pectin. Using xanthan gum and pectin resulted in a colour change compared to the control. Incorporating pectin and xanthan gum into magwinya can be quickly introduced into the production process and is beneficial to both the food industry and consumers, as they have good anti-staling properties. While the result of this study presents preliminary data on the shelf-life study of magwinya for 3 days, increasing the storage time is recommended. Further studies on the use of enzymes for retarding staling, longer storage times, and the relationship between structure and rheological properties should be considered.
Disclosure statement
No potential conflict of interest was reported by the author(s).
Additional information
Funding
References
- Abu‐ghoush, M., Herald, T. J., Dowell, F., Xie, F., Aramouni, F. M., & Madl, R. (2008). Effect of preservatives addition on the shelf‐life extensions and quality of flat bread as determined by near‐infrared spectroscopy and texture analysis. International Journal of Food Science & Technology, 43(2), 357–364. https://doi.org/10.1111/j.1365-2621.2007.01594.x
- Aguirre, J. F., Osella, C. A., Carrara, C. R., Sánchez, H. D., & Buera, M. D. P. (2011). Effect of storage temperature on starch retrogradation of bread staling. Starch‐Stärke, 63(9), 587–593. https://doi.org/10.1002/star.201100023
- Ai, J., Witt, T., Cowin, G., Dhital, S., Turner, M. S., Stokes, J. R., & Gidley, M. J. (2018). Anti-staling of high-moisture starchy food: Effect of hydrocolloids, emulsifiers, and enzymes on mechanics of steamed-rice cakes. Food Hydrocolloids, 83, 454–464. https://doi.org/10.1016/j.foodhyd.2018.05.028
- American Association of Cereal Chemists. (2000). International. Approved methods of the AACC. St. Paul. Retrieved October 16, 2020, from http://methods.aaccnet.org/methods
- American Oil Chemists Society. (1998). Approved AOCS method Cd 8-53 peroxide value acetic acid-chloroform method.
- Burešová, I., Masaříková, L., Hřivna, L., Kulhanová, S., & Bureš, D. (2016). The comparison of the effect of sodium caseinate, calcium caseinate, carboxymethyl cellulose and xanthan gum on rice-buckwheat dough rheological characteristics and textural and sensory quality of bread. LWT-Food Science and Technology, 68, 659–666. https://doi.org/10.1016/j.lwt.2016.01.010
- Cauvain, S. P. (2003). Bread industry and consumer expectations regarding organic bakery products in the European Union. Getreide, Mehl Brot, 57, 100–107.
- Czuchajowska, Z., & Pomeranz, Y. (1989). Differential scanning calorimetry, water activity, and moisture contents in crumb center and near-crust zones of bread during storage. Cereal Chemistry, 66(4), 305–309.
- Davidou, S., Le Meste, M., Debever, E., & Bekaert, D. J. F. H. (1996). A contribution to the study of staling of white bread: Effect of water and hydrocolloid. Food Hydrocolloids, 10(4), 375–383. https://doi.org/10.1016/S0268-005X(96)80016-6
- Donchenko, L. V., Sokol, N. V., Sanzharovskaya, N. S., Khrapko, O. P., & Mikhaylova, T. A. (2020, May). Functional role of pectin in the bakery technology. IOP Conference Series: Earth and Environmental Science, 488(1), 012010. IOP Publishing. https://doi.org/10.1088/1755-1315/488/1/012010
- Duncan, D. (1955). Multiple range and multiple F tests. Biometrics, 11(1), 1–42. https://doi.org/10.2307/3001478
- Fadda, C., Sanguinetti, A. M., Del Caro, A., Collar, C., & Piga, A. (2014). Bread staling: Updating the view. Comprehensive Reviews in Food Science & Food Safety, 13(4), 473–492. https://doi.org/10.1111/1541-4337.12064
- Gray, J. A., & Bemiller, J. N. (2003). Bread staling: Molecular basis and control. Comprehensive Reviews in Food Science and Food Safety, 2(1), 1–21. https://doi.org/10.1111/j.1541-4337.2003.tb00011.x
- Guarda, A., Rosell, C. M., Benedito, C., & Galotto, M. J. (2004). Different hydrocolloids as bread improvers and antistaling agents. Food Hydrocolloids, 18(2), 241–247. https://doi.org/10.1016/S0268-005X(03)00080-8
- Hadnađev, T. R. D., Dokić, L. P., Hadnađev, M. S., Pojić, M. M., Rakita, S. M., & Torbica, A. M. (2013). Changes in quality parameters of bread supplemented with OSA starch during storage. Food and Feed Research, 40(2), 101–108.
- Kaur, M., Sandhu, K. S., Arora, A., & Sharma, A. (2015). Gluten-free biscuits prepared from buckwheat flour by incorporation of various gums: Physicochemical and sensory properties. LWT-Food Science and Technology, 62(1), 628–632. https://doi.org/10.1016/j.lwt.2014.02.039
- Kim, J., Choi, I., Shin, W. K., & Kim, Y. (2015). Effects of HPMC (Hydroxypropyl methylcellulose) on oil uptake and texture of gluten-free soy donut. LWT- Food Science & Technology, 62(1), 620–627. https://doi.org/10.1016/j.lwt.2014.03.039
- Kim, M. Y., & Chun, S. S. (2009). Changes in shelf-life, water activity, and texture of rye-wheat mixed bread with naturally fermented raisin extract and rye sourdough during storage. Korean Journal of Food Cookery Science, 25(2), 170–179.
- Kwinda, O., Onipe, O. O., & Jideani, A. I. (2018). The effect of oat bran and psyllium husk fibre on oil reduction and some physicochemical properties of magwinya–a deep-fried dough. CyTA-Journal of Food, 16(1), 247–254. https://doi.org/10.1080/19476337.2017.1389991
- Lu, T. M., Lee, C. C., Mau, J. L., & Lin, S. D. (2010). Quality and antioxidant property of green tea sponge cake. Food Chemistry, 119(3), 1090–1095. https://doi.org/10.1016/j.foodchem.2009.08.015
- Mandala, I., Karabela, D., & Kostaropoulos, A. (2007). Physical properties of breads containing hydrocolloids stored at low temperature. I. Effect of chilling. Food Hydrocolloids, 21(8), 1397–1406. https://doi.org/10.1016/j.foodhyd.2006.11.007
- Mandala, I. G., & Sotirakoglou, K. (2005). Effect of frozen storage and microwave reheating on some physical attributes of fresh bread containing hydrocolloids. Food Hydrocolloids, 19(4), 709–719. https://doi.org/10.1016/j.foodhyd.2004.09.001
- Melito, H., & Farkas, B. E. (2013). Physical properties of gluten‐free donuts. Journal of Food Quality, 36(1), 32–40. https://doi.org/10.1111/jfq.12008
- Mohammadi, M., Sadeghnia, N., Azizi, M. H., Neyestani, T. R., & Mortazavian, A. M. (2014). Development of gluten-free flat bread using hydrocolloids: Xanthan and CMC. Journal of Industrial and Engineering Chemistry, 20(4), 1812–1818. https://doi.org/10.1016/j.jiec.2013.08.035
- Ndlala, F. N., Onipe, O. O., Mokhele, T. M., Anyasi, T. A., & Jideani, A. I. (2019). Effect of wheat bran incorporation on the physical and sensory properties of a South African cereal fried dough. Foods, 8(11), 559. https://doi.org/10.3390/foods8110559
- Oktay, S., & Sadıkoğlu, S. (2018). The gastronomic cultures’ impact on the African cuisine. Journal of Ethnic Foods, 5(2), 140–146. https://doi.org/10.1016/j.jef.2018.02.005
- Onipe, O. O., Beswa, D., & Jideani, A. I. O. (2019). The socioeconomic benefits, production and consumption statistics of magwinya in Limpopo province, South Africa. African Journal of Food, Agriculture, Nutrition & Development, 19(4), 15007–15028. https://doi.org/10.18697/ajfand.87.18030
- Onipe, O. O., Beswa, D., Jideani, V. A., & Jideani, A. I. O. (2018). Optimization of processing conditions for oil reduction of magwinya (a deep-fried cereal dough). African Journal of Science, Technology, Innovation & Development, 10(2), 209–218. https://doi.org/10.1080/20421338.2018.1440920
- Onipe, O. O., Beswa, D., Jideani, V. A., & Jideani, A. I. O. (2019). Development of a low-fat, high-fibre snack: Effect of bran particle sizes and processing conditions. Heliyon, 5(3), e01364. https://doi.org/10.1016/j.heliyon.2019.e01364
- Oyedeji, A. B., Sobukola, O. P., Henshaw, F., Adegunwa, M. O., Ijabadeniyi, O. A., Sanni, L. O., & Tomlins, K. I. (2017). Effect of frying treatments on texture and colour parameters of deep fat fried yellow fleshed cassava chips. Journal of Food Quality, 2017, 1–10. Article ID 8373801. https://doi.org/10.1155/2017/8373801
- Palav, T. S. (2016). Chemistry of Cake Manufacturing. In W. Colin; C. Harold; S. Koushik, and F. Jon (Eds.), Encyclopedia of food grains (2nd ed., pp. 367–374). Academic Press.
- Pathare, P. B., Opara, U. L., & Al-Said, F. A. J. (2013). Colour measurement and analysis in fresh and processed foods: A review. Food & Bioprocess Technology, 6(1), 36–60. https://doi.org/10.1007/s11947-012-0867-9
- Primo-Martín, C., Sanz, T., Steringa, D. W., Salvador, A., Fiszman, S. M., & Van Vliet, T. (2010). Performance of cellulose derivatives in deep-fried battered snacks: Oil barrier and crispy properties. Food Hydrocolloids, 24(8), 702–708. https://doi.org/10.1016/j.foodhyd.2010.04.013
- Raffo, A., Pasqualone, A., Sinesio, F., Paoletti, F., Quaglia, G., & Simeone, R. (2003). Influence of durum wheat cultivar on the sensory profile and staling rate of Altamura bread. European Food Research and Technology, 218(1), 49–55. https://doi.org/10.1007/s00217-003-0793-1
- Rosell, C. M., & Santos, E. (2010). Impact of fibers on physical characteristics of fresh and staled bake-off bread. Journal of Food Engineering, 98(2), 273–281. https://doi.org/10.1016/j.jfoodeng.2010.01.008
- Salehi, F. (2020). Effect of common and new gums on the quality, physical, and textural properties of bakery products: A review. Journal of Texture Studies, 51(2), 361–370. https://doi.org/10.1111/jtxs.12482
- Sasaki, T. (2018). Effects of xanthan and guar gums on starch digestibility and texture of rice flour blend bread. Cereal Chemistry, 95(1), 177–184. https://doi.org/10.1002/cche.10024
- Sebastian, A., Ghazani, S. M., & Marangoni, A. G. (2014). Quality and safety of frying oils used in restaurants. Food Research International, 64, 420–423. https://doi.org/10.1016/j.foodres.2014.07.033
- Shittu, T. A., Aminu, R. A., & Abulude, E. O. (2009). Functional effects of xanthan gum on composite cassava-wheat dough and bread. Food Hydrocolloids, 23(8), 2254–2260. https://doi.org/10.1016/j.foodhyd.2009.05.016
- Şimşek, S. T. (2020). Multivariate analysis of staling properties in vacuum-combined baking gluten-free cake during storage. LWT- Food Science & Technology, 131, 109824. https://doi.org/10.1016/j.lwt.2020.109824
- Singhal, S., & Hulle, N. R. S. (2022). Citrus pectins: Structural properties, extraction methods, modifications and applications in food systems–a review. Applied Food Research, 2(2), 100215. https://doi.org/10.1016/j.afres.2022.100215
- Singthong, J., & Thongkaew, C. (2009). Using hydrocolloids to decrease oil absorption in banana chips. LWT-Food Science and Technology, 42(7), 1199–1203. https://doi.org/10.1016/j.lwt.2009.02.014
- Siriwongwilaichat, P., & Kongpanichtrakul, C. (2021). Quality improvement of gluten-free doughnuts by using hydrocolloids. Science, Engineering and Health Studies 15, 21030005. https://doi.org/10.14456/sehs.2021.15
- Souther, B. J. (2005, July 25). The effect of xanthan gum and guar gum on enhancing the quality and preventing lipid rancidity in yeast bread supplemented with flaxseed [ Master of Science dissertation]. Virginia Polytechnic Institute and State University Blacksburg.
- Tebben, L., & Li, Y. (2019). Effect of xanthan gum on dough properties and bread qualities made from whole wheat flour. Cereal Chemistry, 96(2), 263–272. https://doi.org/10.1002/cche.10118
- Wanjuu, C., Abong, G., Mbogo, D., Heck, S., Low, J., & Muzhingi, T. (2018). The physiochemical properties and shelf‐life of orange‐fleshed sweet potato puree composite bread. Food Science & Nutrition, 6(6), 1555–1563. https://doi.org/10.1002/fsn3.710
- Yaseen, A. A., Shouk, A. A., & Ramadan, M. T. (2010). Corn-wheat pan bread quality as affected by hydrocolloids. Journal of American Science, 6(10), 684–690.
- Yazdanseta, P., Tarzi, B. G., & Gharachorloo, M. (2015). Effect of some hydrocolloids on reducing oil uptake and quality factors of fermented donuts. Journal of Biodiversity & Environmental Sciences, 6(2), 233–241.
- Zolfaghari, Z. S., Mohebbi, M., & Khodaparast, M. H. H. (2013). Quality changes of doughnuts as influenced by leavening agent and hydrocolloids coatings. Journal of Food Processing & Preservation, 37(1), 34–45. https://doi.org/10.1111/j.1745-4549.2011.00611.x