
ABSTRACT
The effects of microbial contamination on the rancidity of Huangjiu (Chinese rice wine) during pottery jar storage were studied. With the increase in the rancidity of Huangjiu, the alcohol content decreased, while the conductivity increased significantly. The sour taste and umami taste of Huangjiu increased, leading to flavor deterioration. Meanwhile, the increase in biogenic amine content makes Huangjiu unfit for drinking. The changes in components showed that the degree of rancidity was related to the metabolism of organic acids and amino acids caused by contaminated microorganisms. According to the analysis of microbial community structure, more microorganisms were found in the severe rancid Huangjiu. This indicated that with the aggravation of the degree of rancidity, the community structure of the contaminated microorganisms becomes complex, and potentially pathogenic microorganisms such as Arcobacter species were detected. Therefore, the change of components of Huangjiu will also affect the community structure of contaminated microorganisms.
Introduction
As a traditional brewed wine from China, Huangjiu is rich in nutrients and far less alcoholic than distilled liquor. Moreover, most Huangjiu requires long-term storage in pottery jars to improve the flavors as well as the quality (T. Feng et al., Citation2020). Therefore, preventing microbial contamination and wine quality deterioration during the storage of Huangjiu is the focus of quality control in Huangjiu industry. As early as 800 years ago, the ancient Tang Dynasty adopted wine cooking techniques as a means to sterilize it. This technique is conducive to the long-term storage of Huangjiu (Bruno et al., Citation2007). The application of wine sterilization techniques dates back to Louis Pasteur’s study of sterilization and storage techniques of grape wines in the nineteenth century. This sterilization technique could inhibit microorganisms without using preservatives like sulfur dioxide (SO2) (Bañuelos et al., Citation2020).
Although techniques like pasteurization can assure the storage quality of most Huangjiu, semi-finished products undergo poor preparation and storage as they are operated in semi-open (non-GMP) environments. The sterilized Huangjiu and pottery jar sealing materials are all vulnerable to secondary microbial contamination in air, despite the Huangjiu having been processed by high-temperature sterilization at 85 ~ 90°C. Therefore, there are still microbial residues after sterilization (Fan et al., Citation0000). Moreover, pottery jars are likely to suffer sealing damages, wall seepage, and other problems during storage, which would only increase the probability of microbial contamination in Huangjiu. The resulting food safety risk and abnormal flavor lower the quality of the final product (Li et al., Citation2018). Moreover, the probability of rancidification of Huangjiu increases as the storage time prolongs. Rancidification of Huangjiu during pottery jar storage not only creates economic losses to the wine industry but also affects the production of high-quality Huangjiu (Deng et al., Citation2017). Currently, the wine industry usually adopts offline sampling or online monitoring to detect abnormal quality changes such as rancidity. For example, conductivity is used to study and monitor the quality stability of white wine and grape wine during storage (Coetzee et al., Citation2016; Ren et al., Citation2015). However, the changes in microorganisms and quality of Huangjiu with different degrees of rancidity have not been fully studied. At the same time, there is a lack of microbial pollution monitoring methods suitable for Huangjiu.
The rancidification process of Huangjiu can generally be divided into two classes: bacterial biofilm rancidification (acetic acid rancidification) and non-bacterial biofilm rancidification (lactic acid rancidification). Of the two processes, lactic acid rancidification causes greater damage to Huangjiu (W. Liu et al., Citation2018), causing drastic changes in components. Recent studies on causes of rancidification in Huangjiu have mainly focused on several microorganisms, such as members of the lactic acid bacteria, acetic bacteria, and Pseudomonas. Due to limitations by technologies, research of microorganisms that cause rancidification of Huangjiu has mainly employed traditional isolation culture, polymerase chain reaction (PCR), and 16S rDNA sequencing (N. Chen et al., Citation2014). Mao et al. (Citation2014) separated two new bacterial strains (including members of the Lactobacillus genus) from the aging Huangjiu undergoing rancidification by using a special growth medium (Mao, Citation2014). Chen et al. (Citation2014) separated the acid-producing bacteria in raw Huangjiu undergoing rancidification by using Potato Dextrose Agar Medium and High-Performance Capillary Electrophoresis (HPCE) detection methods. Using these techniques, they separated a total of 8 strains (N. Chen et al., Citation2014). Xie et al. (Citation2012) analyzed how pollutants in rancid Huangjiu affected the wine without including bloating, by using performing PCR and 16S rDNA sequencing of Pseudomonas and Achromobacter strains. Liu et al. (Citation2018) identified 36 key microorganisms that caused rancidification of Huangjiu during storage by using high-throughput sequencing and traditional separation culture technology, including 28 varieties of Lactobacillus acetotolerans and 8 varieties of Lactobacillus fructivorans (Y. Chen et al., Citation2020). In recent years, high-throughput sequencing technology combined with flavor component analysis has been applied to the analysis of Huangjiu brewing process (Peng, Zheng, Meng, Zhu, et al., Citation2022; Xie et al., Citation2021). Through the correlation between flavor components and microbial communities, the role of key microorganisms in the formation of Huangjiu flavor was studied (Peng, Zheng, Meng, Yu, et al., Citation2022). These studies and techniques provide some basis for the discussion of major microorganisms and their functions in the rancidification process. Despite these advances, few studies have been conducted on the correlation between microorganisms and changes in key harmful components during Huangjiu rancidity. In addition, there are few studies on the metabolic reactions caused by microbial flora in Huangjiu rancidity, and there is a lack of effective and rapid reference indicators for rancidity microorganisms and rancidity degree.
In this study, the components and reactions that might be affected by the degree of Huangjiu rancidity were analyzed. Moreover, unimolecular sequencing techniques (such as PacBio SMRT sequencing technique and PacBio RS II) helped analyze microbial community structure in rancidifying Huangjiu during rancidification process. The research outcomes from this study will provide a theoretical basis for the control of harmful components and pathogenic microorganisms in Huangjiu during long-term storage.
Materials and methods
Experimental samples
The Huangjiu samples were derived from the same batch of Huangjiu that was stored in pottery jars for 3 years. Of these samples, the sample with mild rancidity had a turbid appearance at sampling as the rancidification was happening, and the total acid was lower than 7 g/L. However, the sample with severe rancidity was relatively clear in appearance as the rancidification had completed, and the total acid was higher than 7 g/L.
Major reagents and instruments
Organic acids (e.g. ketoglutaric acid, pyruvate, lactic acid, and succinic acid), amino acids (e.g. tyrosine, glutamate, arginine, and histidine), bioamines (β-phenylethylamine, putrescine, cadaverine, histamine, and tyramine), and alkane reagents (e.g. methanol and acetonitrile) used in this study were pre-determined to be chromatographically pure. Other reagents, including phenyl isothiocyanate, triethylamine, n-hexane, acetic acid, phosphoric acid, and potassium dihydrogen phosphate, were also of analytical pure grade. These reagents were purchased from Anpel-Chem Chemical Reagent (Shanghai) Co., Ltd. Waters high-performance liquid chromatography (HPLC) 2695, which was equipped with diode array detector 2996, was applied to the samples. Other instruments that were used include vortex mixers, 10 mL tubes with a plug, a thermostat water bath, an ultrasonic cleaner, a Mettler-Toledo electronic analytical balance (accuracy of 0.0001 g), a 0.45 μm needle microporous membrane filter (organic phase), a Mettler-Toledo conductivity meter F38, and a Metrohm 702 potentiometric titrator.
Test of rancidification physiochemical indexes in Huangjiu
Test methods to determine the alcohol content, pH, total acid, and amino acid nitrogen were based on the national standard GB/T 13,662–2018 Huangjiu. All chemical determination experiments were performed in triplicate.
Conductivity: Hanna HI 99,300 conductivity meter was applied to measure the test conductivity (σt) of samples at a “T” temperature. According to the formula, σ25=σt+(25-T)×15, the test result was transformed to the conductivity of samples at 25°C.
The HPLC method of amino acids was also conducted, as previously performed (S. Liu et al., Citation2019). Derivatives of phenyl isothiocyanate were used for the derivation reactions with free amino acids. An HPLC (Waters HPLC 2695, equipped with diode array detector 2996) was conducted as a part of this test. The instrumentation included chromatographic columns: Waters C18 column (5 µm, 250 mm × 4.6 mm); column temperature 40°C; flow velocity: 1.0 mL/min; sample size: 10.0 µL; ultraviolet detection wavelength 254 nm; mobile phase A. 16.4 g sodium acetate anhydrous was dissolved in an appropriate amount of water, to which 0.5 mL triethylamine was also dissolved till a final volume of 10 L was reached. Mobile phase B: acetonitrile + water = 8 + 2 (volume ratio); the elution gradient procedure is listed in .
Table 1. Gradient elution procedure for HPLC.
The HLPC methodology used for assessing bioamines abided by the national standards GB/T 5009.208–2008 Test of Bioamine Content in Foods (Hu et al., Citation2022). HPLC (Waters HPLC 2695, equipped with diode array detector 2996) was used for these tests. The method is introduced as follows: chromatographic column: Waters C18 column (5 µm, 250 mm × 4.6 mm); column temperature: 30°C; flow velocity: 1.0 mL/min; sample size: 10.0 µL; UV detection wavelength: 254 nm; Mobile phase A: acetonitrile solution. Mobile phase B: ultrapure aqueous solution. The elution gradient procedure is listed in .
Table 2. Gradient elution procedure for HPLC.
Organic acids were tested by HPLC (Waters HPLC 2695, equipped with diode array detector 2996) directly. The method is introduced as follows: chromatographic column: Waters C18 column (5 µm, 250 mm × 4.6 mm); Column temperature: 30°C; flow velocity: 1.0 mL/min; sample size: 10.0 µL; UV detection wavelength: 210 nm; Mobile phase A: methanol solution. Mobile phase B: 0.01 mol/L monopotassium phosphate solution. Mobile phase C: ultrapure aqueous solution. The elution gradient procedure is listed in .
Table 3. Gradient elution procedure for HPLC.
Extraction of microorganism DNA in rancidification samples
Acquisition of thallus
Two rancidification samples (45.0 mL) were collected in 50 mL centrifuge tubes. They were centrifuged (5810, Eppendorf) at 10,000 g and 25°C. The supernatant was eliminated, and sufficient sediment was collected. The content of each tube was added to a 1.0 mL high salt extract (100 mmol/L Tris-HCl pH8.0, 100 mmol EDTA, 100 mmol/L Na3PO4, 1.5 mol/L NaCl), and the mixture was suspended evenly and recollected in 2 mL centrifuge tubes. They were further centrifuged at 12,000 g for 10 min at 25°C before obtaining the bacterial sediment.
Microorganism DNA extraction
The bacterial sediments were added to 0.5 mL of above high salt extracts and mixed evenly. The mixture was frozen for 10 min at −20°C. Next, the samples were placed in an ice bath and crushed to break open the cell walls, using the JY92-IIultrasonic crasher (Scientz Biotechnology Co., LTD) under the following conditions: 10000 g, 15 s, repeated 3–5 times. The samples were incubated with lysozyme (10 μL, 50 mg/mL) for 30 min at 37°C. 125 μL 10% SDS was added to the mixture, along with 5 μL proteinase K (20 mg/mL). The mixture was incubated at 37°C for 1 h and oscillated gently every 20 min to evenly mix it. 1 mL CTAB buffer solution (1.5 mol/L NaCl, 1% CTAB, 100 mmol/L Tris-HCL pH 8.0, 100 mmol/L EDTA, pH 8.0) was added, and the mixture was heated in a 65°C water bath for 1 h, with gentle shaking every 20 min. An equal volume of chloroform-isoamylol (volume ratio = 24:1) was added and mixed before the mixture was centrifuged at 12,000 g for 10 min at 4°C. The addition of static caused the mixture to separate into three layers. The upper aqueous layer containing DNA was collected in 2 mL centrifuge tubes. The above operation was repeated 2–3 times until the middle layer was devoid of impurities. 0.6 times the volume of isopropanol was added and mixed gently. The mixture was left to sediment at −20°C for at least 1 h before being centrifuged for 10 min at 12,000 g and 4°C. The supernatant was removed, and the sediment containing nucleic acids was collected. The addition of 1 mL 70% ethanol helped wash the sediment and the procedure was repeated 2–3 times. 50 μL sterile water was used to dissolve the DNA and 1 µL RNA enzyme (10 mg/mL RNaseA) kept the DNA intact. The mixture was incubated in a 37°C water bath for 1–2 h to eliminate RNA. The collected DNA samples were stored at −20°C until they were retrieved for later use.
PCR amplification of bacterial 16S rDNA gene and fungal ITS regions
Specific primers that complement the bacterial 16S rDNA and fungal ITS regions were used. Primer pairs were designed for each sample. Specific primer information is listed in . PCR reaction system (50 µL final volume) consisted of 25 μL 2× PrimeSTAR GC Buffer (Mg2+ plus), 4 μL dNTP Mixture (2.5 mM each), 0.5 μL Forward Primer, 0.5 μL Reverse Primer, 0.5 μL PrimeSTAR HS DNA polymerase (2.5 U/μL) and 1 μL DNA template. The reaction mixture was supplemented with sterile water to reach a final volume of 50 μL. Names and sequences of bacterial and fungal primers are listed in .
Table 4. The primer names and corresponding sequences.
The following bacterial PCR conditions (Shahi et al., Citation2019) were used: 3 min of pre-degeneration at 98°C; 30 s of degeneration at 98°C, 30 s of annealing at 58°C, and 2 min of extension at 72°C (Touch down PCR, 10 cycles); 30 s of degeneration at 98°C, 30 s of annealing at 55°C, and 2 min of extension at 72°C (20 cycles); 10 min of final extension at 72°C and permanent insulation at 16°C.
The following fungal PCR conditions were used: 3 min of pre-degeneration at 98°C; 30 s of degeneration at 98°C, 30 s of annealing at 58°C, and 2 min of extension at 72°C (Touch down PCR, 10 cycles); 30 s of degeneration at 98°C, 30 s of annealing at 50°C, and 2 min of extension at 72°C (20 cycles); 10 min of final extension at 72°C and permanent insulation at 16°C.
PacBio RS II sequencing and analysis
Purified DNA samples were sent to Nextomics Biosciences Co., Ltd., Wuhan for PacBio RS II sequencing. The original post-sequencing data was transformed to sequential data by Base calling, which was then stored in BAM documents. After CCS and Barcode resolution and data quality control, they were transformed to fastq/fasta format for storage. Later, high-accuracy Raw CCS sequences were acquired using CCS of SMRT Link using the Arrow algorithm and CCS (≥99% accuracy). The target product sequences were matched and intercepted using BLAST software (maintaining primer region in default) and the highlighted sequences were corrected. Chimeras were eliminated to obtain Clean CCS data for each sample. Annotations of QIIME, R, Perl, and Python were processed to generate OUT to study Alpha diversity. The analysis of sequencing results was based on QIIME software and implemented under stringent conditions (97% similarity).
Data analysis
Experimental results were expressed as average with standard deviation (n = 3). Statistical and diversity analyses were carried out using elaborate. Using function and alpha function of doBy package, vegan package, and picante package in R software. Differential species with significant p-values were validated by t-tests using R software. Differential species analysis was implemented using STAMP software and plotted.
Results
Changes in the physicochemical indexes after rancidification
Twenty samples of Huangjiu were randomly selected, of which 18 samples did not undergo rancidity, and the change in total acid before and after storage was less than 0.5 g/L. The total acid content in the mild rancid sample (J-13) is 5.8 g/L, increased by 1.4 g/L. The markedly higher acid content of 15.0 g/L in severe rancid sample (J-10) indicated that the organic acid composition in Huangjiu had changed. Small leakage points were found on the surface of pottery jars of Huangjiu, which may lead to microbial contamination. Moreover, except for the abnormal growth of acidity, the amino acid nitrogen of wine increased, while the alcoholic content and pH declined (). Additionally, the conductivity index also increased dramatically. The conductivity of samples with mild rancidification was unusually higher than that of normal samples. The metabolic process of pollutant microorganisms in wine might have led to the formation of metal ion complexes, which caused proteins to change their binding state and thus increase the conductivity of rancidifying Huangjiu.
Table 5. Physicochemical indexes of 3-year-old Huangjiu.
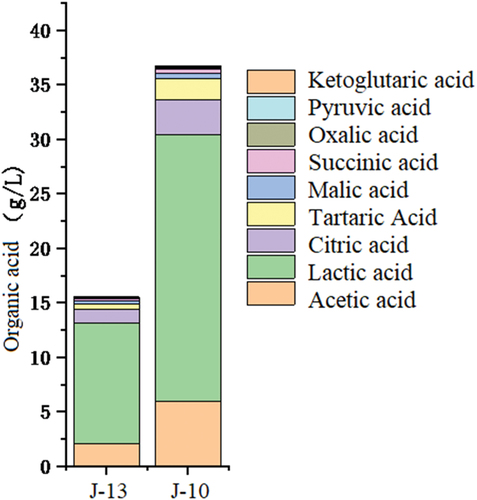
The lactic acid content in normal samples and samples undergoing rancidification was the highest, followed by acetic acids (). After rancidification, most organic acids increased to some extent. In particular, the lactic acid increased the most (12.05 g/L − 25.38 g/L), followed by acetic acid (2.15 g/L − 6.05 g/L). Citric acid increased to a modest extent, and other organic acids did not increase significantly. This observation indicated that lactic acid, acetic acid, and citric acid were mainly produced by metabolism during rancidity, and it was consistent with previous research (D. Feng et al., Citation2010).
Figure 1. Comparison of organic acid composition during different degree of rancidification.
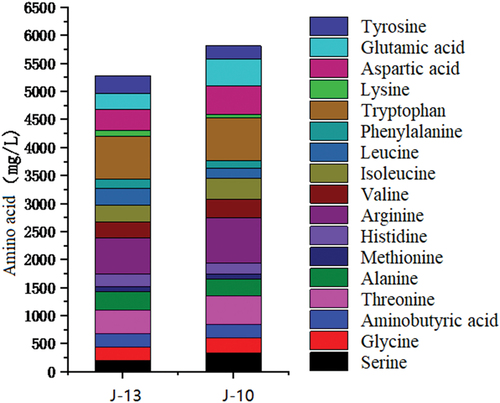
The rapid propagation of microorganisms in Huangjiu produces excessive organic acids that increase the acidity of the wine and trigger rancidification. The accumulation of metabolites in the wine may also change the free amino acid content and alter the harmful bioamine composition in the wine. In this study, the amino acid composition differed between samples that had severe rancidification compared to those that had mild rancidification (). In mild and severe rancidification samples, the total amino acid content was 5275.9 mg/L and 5815.4 mg/L, respectively. The amino acid content for these samples was 2784.6 mg/L and 2816.3 mg/L, respectively, which accounted for more than 50% of the total amino acid content. The amino acids that give wine sweet, umami, and astringent qualities accounted for the second-highest proportion in terms of total amino acid content. Amino acids associated with bitter taste were relatively unchanged after rancidification, but their total content was quite high. Other amino acids, such as the aspartic acid and glutamic acid that give wine its umami taste, increased by 47.27% from 671.6 mg/L to 989.1 mg/L in rancidification samples compared with that in normal samples. Therefore, the sour taste and umami taste of Huangjiu increased significantly after rancidity.
Figure 2. Comparison of amino acid compositions during different degree of rancidification.
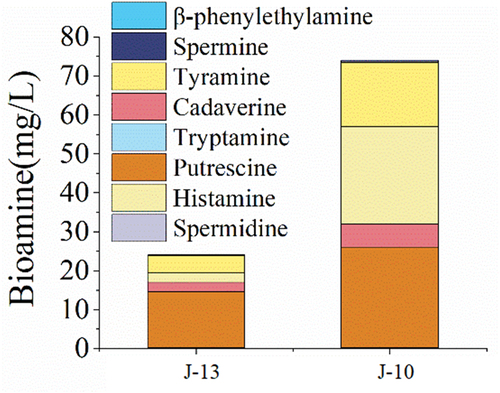
Some bioamines, such as putrescine, cadaverine, histamine, and tyramine, increased significantly in samples undergoing rancidification (). For example, histamine content increased from 2.4 mg/L in the mild rancid sample to 24.9 mg/L in the severe rancid sample. This suggests that the degree of rancidity greatly influences the food safety of wine. With the increase in the degree of rancidity, the components of Huangjiu changed significantly, affecting the microbial community of pollution. At the same time, under higher acidic conditions, the metabolic capacity of some microorganisms will be enhanced. It can make more efficient use of the protein in Huangjiu to generate free amino acids and metabolite amino acids to various biological amines.
Figure 3. Comparison of bioamine compositions during different degree of rancidification.
Microbial diversity in Huangjiu with different rancidification progresses
α-diversity indexes of bacteria and fungi
The α-diversity indexes of bacteria and fungi are shown in . It was quite apparent that the number of the observed bacterial and fungal species in the mild rancid sample (J-13) was much smaller than those in severe rancid samples (J-10). In particular, the Shannon index and Simpson index of bacteria in the J-13 sample were dozens of times lower than those in the J-10 sample. However, the advantages of this phenomenon remain unknown and require further research. According to the diversity index of fungi, the abundance declined significantly upon rancidification. In the J-13 and J-10 samples, 10 and 14 fungi species were observed, respectively. Possible experimental errors might have caused the number of fungi species in the two samples to decline dramatically. However, it is also possible that the rancidification process inhibited fungal growth for unknown reasons. With increased rancidification, these inhibited fungi might gain resistance and grow slowly. On the other hand, these microorganisms might have material exchange with the external world during storage, thus introducing new microorganisms.
Table 6. α diversity indexes of bacteria and fungi.
Abundance distribution curve of bacteria
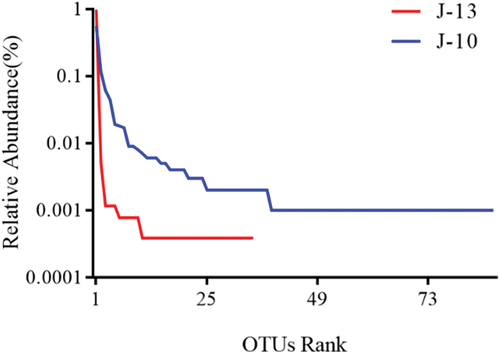
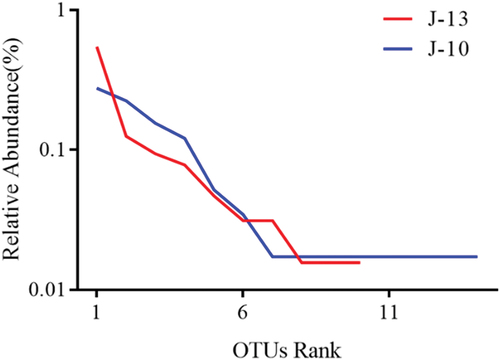
Each broken line of the abundance distribution curves () represent OTU abundance distribution in the samples. In other words, the degree of abundance of species is reflected by the curve length on the x-axis. The greater curve span represents the greater composition of species. Species richness was higher in severe rancid samples (J-10), which exhibited more than 75 species (). However, the mild rancid sample (J-13) harbored relatively fewer species, at only 30.
Figure 4. Bacterial abundance distribution curve.
Abundance distribution curve of fungi
After performing quality control of the fungal sequences, 28 operation taxonomic units (OTUs) were collected from both the rancid samples. The number of species of fungi is less than that of bacteria in the contaminated microorganisms. Although the fungal composition of both samples was generally similar (), the mild rancid sample (J-13) had fewer OUTs than the severe rancid sample (J-10). With the increase in the degree of rancidity, the species of fungi changed less than that of bacteria.
Figure 5. Fungal abundance distribution curves.
Microbial community structure in Huangjiu with different rancidification progresses
Community structure of bacteria
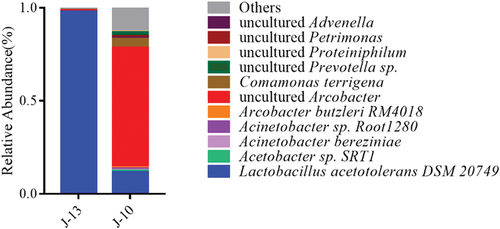
The species of microorganisms with a relative abundance of ≥1% were defined as the dominant bacteria of the group. The top 10 groups were plotted to show the relative abundance of dominant bacterial composition in all samples. At the species level (), most Lactobacillus species belonged to the Lactobacillus acetolerans DSM 20,749 variety, which accounted for 98.79% of the bacteria in mild rancid sample (J-13). As other species were less abundant (less than 0.1%), statistical analyses on those samples were challenging. In severe rancid sample (J-10), Lactobacillus acetotolerans, uncultured Arcobacter, Comamonas terrigena, uncultured Prevotella, and uncultured Proteiniphilum accounted for 11.56%, 64.42%, 4.82%, 2.01%, and 0.51%, respectively. In addition, the relative abundance of other bacterial species was less than 1%. However, the species richness in the samples caused the total relative abundance to be greater than 12.86%. A combination of other relevant studies (W. Liu et al., Citation2018) revealed that L.s acetotolerans has relatively high similarity to Lactobacillus fructivorans, homofermentative Lactobacillus, and other Lactobacillus. Therefore, the common relative abundance of these microorganisms is often gained in identification.
Figure 6. Composition and relative abundance of bacterial at species level among different rancidity Huangjiu samples.
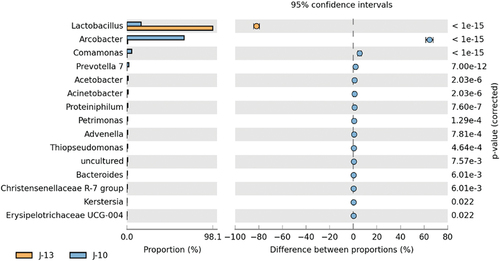
The t-tests revealed significant differential species based on genus level are shown in . According to t-tests and comparison of the relative abundance of different microorganisms, 10 bacterial genera including Arcobacter, Comamonas, Prevotella 7, Acetobacter, and Acinetobacter were significantly higher in severe rancid sample (J-10) than that in mild rancid sample (J-13) (p<0.01). However, Lactobacillus was significantly lower in J-10 than that in J-13 (p<0.01). Collectively, these indicated that the degree of rancidification might affect the abundance of these significantly different bacterial genera in Huangjiu contaminated by microorganisms during storage.
Figure 7. T-test diagram of bacterial community among different rancidity Huangjiu samples.
Fungal community structures
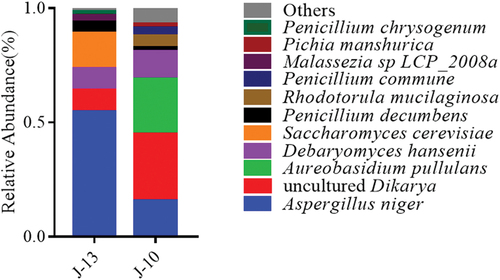
The relative abundance of fungal species was also summarized (), Aspergillus niger, the major Aspergillus fungi, accounted for 15.5% and 54.7% of the severe rancid sample (J-10) and mild rancid sample (J-13), respectively. J-10 consisted of 24.1% Aureobasidium pullulans, 12.1% Debaryomyces hansenii, 5.2% Rhodotorula mucilaginosa, and 3.4% Penicillium commune. Other fungi with a relative abundance higher than 1% included Pichia manshurica (1.7%) and Penicillium decumbens (1.7%). In J-13, the abundance of Debaryomyces hansenii decreased by 2.8% compared to that observed in J-10. On the other hand, the abundance of Saccharomyces cerevisiae increased by 15.6%. Moreover, Penicillium decumbens accounted for 4.7%. Other fungi included Malassezia sp LCP_2008a which accounted for 3.1% and Penicillium chrysogenum which accounted for 1.6%.
Figure 8. Composition and relative abundance of fungal at species level among different rancidity Huangjiu samples.
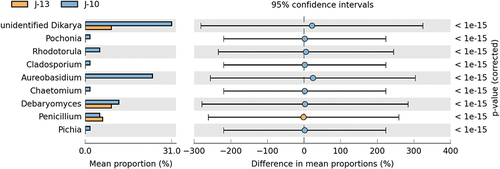
The t-tests determining significantly different fungal species based on genus level are shown in . Based on the comparison of differential microorganisms, it is apparent that the relative abundance of Penicillium in J-13 was significantly higher than that of J-10 (p<0.01). However, the relative abundances of Pichia, Rhodotorula, Debaryomyces, and unidentified Dikarya in severe rancid sample (J-10) were significantly higher than those observed in mild rancid sample (J-13) (p<0.01). This indicated that the degree of rancidification might influence the propagation of these fungal genera in Huangjiu contaminated by microorganisms during storage.
Figure 9. T-test diagram of fungal community among different rancidity Huangjiu samples.
Discussions
As a fermented wine, Huangjiu is rich in nutrients and low in alcoholic concentration (Zhang et al., Citation2020). The amino acid content in Huangjiu is significantly higher than those observed in other wines (Wu, Citation2020). Therefore, any microbial contamination that might occur during the storage of Huangjiu is likely to cause the rancidification of the wine. According to a comparison of physicochemical indexes and component detection results of samples with different degrees of rancidity, the metabolic reactions of components in Huangjiu are very complex. During the process of rancidity, organic acid metabolism is very active, lactic acid is significantly increased, followed by acetic acid. Amino acid metabolism has a greater impact on the quality of Huangjiu. Free amino acids such as aspartic acid and glutamic acid also increased greatly. The sour taste and umami taste of Huangjiu increased significantly, leading to the flavor deterioration. Meanwhile, the content of harmful components such as histamine increases with the degree of rancidity, resulting in food safety risks.
Also, in this study, the identification of microorganism categories and relative abundances in samples undergoing rancidification was performed using PacBio SMRT sequencing technique. According to the microbial community structural analysis of Huangjiu at different stages of rancidification, J-10 that had completed rancidification, showed significantly more microorganisms (both bacteria and fungi) compared with J-13, where the rancidification was happening. This may be related to the change of the components of the wine. With the lactic acid metabolism of the initially contaminated microorganism, the alcohol content decreased, and the acidity exceeded the normal range of Huangjiu (<7 g/L). With the change of the components of Huangjiu, the previously inhibited microorganisms accelerate growth and amino acid metabolism, and eventually produce excessively harmful biogenic amines. In this way, the growth environment of microorganisms is changed to favor the growth of microorganisms. In this process, the inhibited microorganisms can grow normally. In this study, it was also determined that Lactobacillus acetotolerans is the major bacteria responsible for causing the rancidification of Huangjiu. Fungi responsible for the rancidification process included uncommon mildews and yeasts in Huangjiu, including Aureobasidium pullulans, Aspergillus niger, and Debaryomyces hansenii. These studies reveal that increased exposure to rancidification enriches the microbial community structures in Huangjiu. Moreover, many Arcobacter species and other pathogenic microorganisms were detected in the sample with severe rancidity, indicating the importance of controlling severe rancidity for Huangjiu.
This study analyzed the changes of microbial community and metabolites caused by different degrees of rancidity of Huangjiu during storage. The metabolism of contaminated microorganisms changed the components of Huangjiu, and the changes of the components promoted the changes of microbial community structure. Moreover, studying the changes of components and physicochemical indexes provides effective reference indexes to monitor and control the microbial pollution of Huangjiu during storage.
Credit authorship contribution statement
Jian Hu: Investigation, Software, Methodology, Writing – original draft. Shuangping Liu: Investigation, Methodology. Caixia Liu: Software, Methodology, Writing – review and editing. Yuanyuan Huang: Resources. Jian Mao: Conceptualization, Methodology, Writing – review and editing, Supervision.
Disclosure statement
The authors declare that they have no known competing financial interests or personal relationships that could have appeared to influence the work reported in this paper.
Additional information
Funding
References
- Bañuelos, M. A., Loira, I., Guamis, B., Escott, C., Del Fresno, J. M., Codina-Torrella, I., Quevedo, J. M., Gervilla, R., Chavarría, J. M. R., de Lamo, S., Ferrer-Gallego, R., Álvarez, R., González, C., Suárez-Lepe, J. A., & Morata, A. (2020). White wine processing by UHPH without SO2. Elimination of microbial populations and effect in oxidative enzymes, colloidal stability and sensory quality. Food Chemistry, 332, 127417. https://doi.org/10.1016/j.foodchem.2020.127417
- Bruno, S., Vaitsman, D. S., Kunigami, C. N., & Brasil, M. (2007). Influence of the distillation processes from Rio de Janeiro in the ethyl carbamate formation in Brazilian sugar cane spirits. Food Chemistry, 104(4), 1345–1352. https://doi.org/10.1016/j.foodchem.2007.01.048
- Chen, N., Hu, P., & Chen, C. (2014). A primary study on the possible original microorganisms leading to the rancidity of yellow rice wine. Food and Fermentation Industries, 40(8), 24–28. https://doi.org/10.13995/j.cnki.11-1802/ts.2014.08.017
- Chen, Y., & Wu, Y., Wu L., Wu Q., Guo W. L., Zhao W. H., Liu B., Zhang W., Rao P. F., Lv X. C., & Ni L. (2020). Research progress on analysis of microbial diversity in Huangjiu based on high-throughput sequencing technology. Modern Food, 12(23), 38–43. https://doi.org/10.16736/j.cnki.cn41-1434/ts.2020.23.011
- Coetzee, C., Van Wyngaard, E., Šuklje, K., Silva Ferreira, A. C., & du Toit, W. J. (2016). Chemical and sensory study on the evolution of aromatic and nonaromatic compounds during the progressive oxidative storage of a sauvignon blanc wine. Journal of Agricultural and Food Chemistry, 64(42), 7979–7993. https://doi.org/10.1021/acs.jafc.6b02174
- Deng, L., Wang, J., & Yuan, D. (2017). Effect of saponins from panax japonicus on neuronal apoptosis of natural aging rats by NLRP1 and NLRP3 inflammasome pathway. Chinese Traditional and Herbal Drugs, 48(23), 4941–4951. https://doi.org/10.7501/j.issn.0253-2670.2017.23.019
- Fan, W., Zhang, Y., & Qiao, X., Niu J. B., & Pang X. G. Research on the storage of Yellow rice wine by high-capacity stainless steel tanks. Liquor-Making Science & Technology, 2014(5), 67–70. https://doi.org/10.13746/j.njkj.2014.0020
- Feng, T., Hu, Z., Chen, L., Chen, D., Wang, X., Yao, L., Sun, M., Song, S., & Wang, H. (2020). Quantitative structure-activity relationships (QSAR) of aroma compounds in different aged Huangjiu. Journal of Food Science, 85(10), 3273–3281. https://doi.org/10.1111/1750-3841.15421
- Feng, D., Sun, S., & Ma, H., Sun G., & Sun P. (2010). Analysis of main organic acids in spoilage rice wine. China Brewing, 29(1), 125–128. https://doi.org/10.3969/j.issn.0254-5071.2010.01.045
- Hu, J., Liu, S., Mujia, N., Caixia, L., Guixiao, L., & Jian, M. (2022). Analysis of changes in simulated rancidification process during the storage of Huangjiu. Food Science & Nutrition, 10(10), 3485–3491. https://doi.org/10.1002/fsn3.2951
- Li, H., Chen, L. S., Liu, Y., H, J., Liu, L., Zhang, L. H., Yang, H. Y. (2018). Isolation and identification of contaminated microorganisms from jar installed Huangjiu(rice wine) during storage. China Brewing, 37(5), 81–85. https://doi.org/10.11882/j.issn.0254-5071.2018.05.016
- Liu, W., Chen, S., & Xu, Y. (2018). Identification and characterization of spoilage microorganisms in aging Chinese rice wine by culture-independent and culture-dependent technologies. Microbiology (Reading, England), 45(1), 120–128. https://doi.org/10.13344/j.microbiol.china.170204
- Liu, S., Chen, Q., Zou, H., Yu, Y., Zhou, Z., Mao, J., & Zhang, S. (2019). A metagenomic analysis of the relationship between microorganisms and flavor development in shaoxing mechanized Huangjiu fermentation mashes. International Journal of Food Microbiology, 303, 9–18. https://doi.org/10.1016/j.ijfoodmicro.2019.05.001
- Mao, Q. (2014). Chinese rice wine mash fermentation of lactic acid bacteria detection and unique media research and preliminary identification. Liquor Making, 41(4), 75–80. https://doi.org/10.3969/j.issn.1002-8110.2014.04.018
- Peng, Q., Zheng, H., Meng, K., Yu, H., Xie, G., Zhang, Y., Yang, X., Chen, J., Xu, Z., Lin, Z., Liu, S., Elsheery, N. I., Wu, P., & Fu, J. (2022). Quantitative study on core bacteria producing flavor substances in Huangjiu (Chinese yellow rice wine). Lwt-Food Science and Technology, 168, 113900. https://doi.org/10.1016/j.lwt.2022.113900
- Peng, Q., Zheng, H., Meng, K., Zhu, Y., Zhu, W., Zhu, H., Shen, C., Fu, J., Elsheery, N. L., Xie, G., Han, J., Wu, P., Fan, Y., Girma, D., Sun, J., & Hu, B. (2022). The way of Qu-making significantly affected the volatile flavor compounds in Huangjiu (Chinese rice wine) during different brewing stages. Food Science & Nutrition, 10(7), 2255–2270. https://doi.org/10.1002/fsn3.2835
- Ren, H., Wei, R., & Zhang, Y., Li M., Hu Y., & Zhang S. (2015). Research of fen liquor aging behaviors during storage time. Journal of Food Safety and Quality, 6(7), 2680–2687. https://doi.org/10.19812/j.cnki.jfsq11-5956/ts.2015.07.053
- Shahi, S. K., Zarei, K., Guseva, N. V., & Mangalam, A. K. (2019). Microbiota analysis using two-step PCR and next-generation 16S rRNA gene sequencing. Journal of Visualized Experiments, 2019(152). https://doi.org/10.3791/59980
- Wu, M. (2020). Research on evaluation method of Chinese rice wine flavor based on intelligent sensory technologies. Jiangsu University. https://doi.org/10.27170/d.cnki.gjsuu.2019.000115
- Xie, G. F., Cai, G. L., Zang, J., Jin, Y. M. (2012). Research progress of contaminative microbes in Chinese rice wine. Liquor Making, 39(1), 92–93. https://doi.org/10.3969/j.issn.1002-8110.2012.01.034
- Xie, G., Zheng, H., Qiu, Z., Lin, Z., Peng, Q., Dula Bealu, G., Elsheery, N. I., Lu, Y., Shen, C., Fu, J., Yang, H., Han, J., Lu, J., & Liu, G. (2021). Study on relationship between bacterial diversity and quality of Huangjiu (Chinese rice wine) fermentation. Food Science & Nutrition, 9(7), 3885–3892. https://doi.org/10.1002/fsn3.2369
- Zhang, J., Liu, S., Zhou, Z., & Mao, J. (2020). Effect of addition of wheat kojiqu on brewing and flavor of Yellow rice wine. Food & Machinery, 36(4), 56–61. https://doi.org/10.13652/j.issn.1003-5788.2020.04.010