
 ?Mathematical formulae have been encoded as MathML and are displayed in this HTML version using MathJax in order to improve their display. Uncheck the box to turn MathJax off. This feature requires Javascript. Click on a formula to zoom.
ABSTRACT
This study determines the influence of tigernut flour incorporation into fermented cassava flour on the starch digestibility, functional attributes, pasting behaviour, and antioxidant properties of composite flour. The composite flour formulations are cassava flour to tigernut flour ratios of 90:10, 80:20, 70:30, 60:40, and 50:50 together with 100% fermented cassava flour and 100% tigernut flour as control. The flour samples were evaluated for their functional properties, pasting behaviour, in vitro starch digestibility, total phenolic content, and radical scavenging activity. There was a significant reduction in water absorption capacity (2% to 16%) and swelling capacity (9% to 58%) of the composite flour. The inclusion of tigernut also resulted in reduction in the viscosity of the cassava-tigernut composite blends. However, the composite flours exhibited higher total phenolic content and enhanced radical scavenging activity. Compositing fermented cassava flour with tigernut flour may help improve the health of the consumer when processed.
1. Introduction
As instances of diet-related non-communicable diseases continue to surge, the global quest for healthier and more nourishing food alternatives is expanding. The composite flour from cassava and tigernut can meet these demands by providing a product that combines the desirable attributes of both ingredients. Cassava flour is a versatile and widely consumed flour derived from the starchy tuberous root of the cassava plant (Manihot esculenta). It has gained significant attention as a gluten-free alternative to wheat flour and is used in various culinary applications worldwide (Liu et al., Citation2023; Panghal et al., Citation2019). For instance, in the southwestern region of Nigeria, it is commonly subjected to fermentation to produce “Lafun,” which is a stiff dough. Analyzing its nutritional composition reveals that cassava flour displays both favourable characteristics and limitations. On one side, it serves as a robust reservoir of carbohydrates, supplying readily available energy. However, its protein concentration and the presence of key essential nutrients like vitamins and minerals are relatively limited. Although cassava flour may not achieve nutritional completeness in isolation, it can contribute to a well-rounded diet when integrated with other nutrient-dense foods (Odey & Lee, Citation2020; Nwaliowe et al., Citation2023).
Derived from the small tuber-like root vegetable known as tigernut (Cyperus esculentus), tigernut flour has garnered increasing interest recently due to its remarkable nutritional profile and its potential for diverse food applications (Hernández-Olivas et al., Citation2022; Rebezov et al., Citation2023). Contrary to its name, tigernut is not a true nut but rather a tuber, rendering it a suitable substitute for individuals with nut allergies (Yu et al., Citation2022). The production of tigernut flour involves the drying and milling of tigernuts, yielding a fine and gluten-free powder. Abundant in dietary fiber, essential minerals (including iron, magnesium, and potassium), beneficial fats, and compounds with antioxidant properties, tigernut flour presents a spectrum of potential health advantages. These encompass improvements in digestive health, enhanced glycemic regulation, and the promotion of cardiovascular well-being (Yu et al., Citation2022).
Combining cassava flour with tigernut flour may yield an array of health advantages. Tigernut flour boasts a wealth of dietary fiber, essential minerals, vitamins, and healthy fats, while cassava flour contributes carbohydrates. The fusion of these flours can culminate in a composite blend boasting an enhanced nutritional balance, delivering a well-rounded source of carbohydrates, proteins, beneficial fats, fiber, and vital micronutrients. The notable fiber content plays a pivotal role in bolstering digestive wellness, facilitating regular bowel movements, and nurturing a robust gut microbiota. Moreover, the gradual release of glucose during digestion, attributed to the fiber content, aids in stabilizing blood sugar levels, contributing to improved glycemic management. Given that cassava is commonly subjected to fermentation before being processed into flour, a process that diminishes its resistant starch content (Odey & Lee, Citation2020), incorporating tigernut flour can effectively augment the resistant starch levels in cassava flour. With its well-balanced nutritional composition and versatile attributes, the composite flour may stand as a promising ingredient for cultivating healthier food formulations, extending an array of wellness benefits to consumers. Thus, the aim of this study is to investigate the impact of integrating tigernut flour into cassava flour on the in-vitro starch digestibility, functional characteristics, pasting behaviour, and antioxidant activities of the composite flour.
2. Materials and methods
2.1. Raw materials and processing
Mature cassava roots were sourced from the Landmark University teaching and research farm, while tigernuts was obtained from the Sabo market in Ogbomoso, Oyo State, Nigeria. The preparation of cassava flour followed the procedure outlined by Bouniol et al. (Citation2021), albeit with some modifications. The mature cassava roots weighing 20 kg were properly cleaned, manually peeled using a knife, and then cut into pieces measuring 7–10 cm in length. These pieces were thoroughly washed with tap water. Subsequently, they were soaked in 20 liters of distilled water at a room temperature of 27°C to 30°C for a period of 72 hours. This soaking process took place within a covered transparent plastic container. Following the fermentation period, the cassava pieces underwent manual defibering and crumbling. The resultant material was then placed in a sack to extract starchy water and subsequently subjected to oven drying process at 50°C for 36 h using a hot air-drying oven (Genlab Limited, Cheshire, United Kingdom). Once thoroughly dried, the material was subjected to dry milling using a laboratory hammer mill (Christy Turner Ltd., Suffolk, United Kingdom). The milling process utilized a 500-µm opening screen, resulting in the production of fermented cassava flour. The flour obtained was carefully packed into plastic containers and stored at a temperature of −20°C in preparation for subsequent steps.
Similarly, the tigernuts were meticulously sorted to eliminate any undesirable elements such as stones, pebbles, and foreign seeds. These sorted tigernuts were then washed with tap water, drained, and subsequently dried using the same hot air-drying oven at a temperature of 50°C until their moisture content reached around 10%. Once dried, the tigernuts were processed using the same laboratory hammer mill with a 500-µm opening screen, leading to the production of tigernut flour. The resulting flour was carefully packed in an airtight container and stored at a temperature of −20°C in preparation for subsequent analyses.
2.2. Preparation of flour formulations
Five different flour formulations were generated by varying the proportions of cassava and Tigernut flours, plus 100% fermented cassava and Tigernut flours making seven samples all together. The blending process was achieved through thorough mixing utilizing a laboratory mixer (Kenwood Limited, Havant, United Kingdom). The specific ratios employed for the formulations were as follows: 90% fermented cassava flour and 10% tigernut flour, 80% fermented cassava flour and 20% tigernut flour, 70% fermented cassava flour and 30% tigernut flour, 60% fermented cassava flour and 40% Tigernut flour, and finally, 50% fermented cassava flour and 50% Tigernut flour. Subsequently, each of these resulting formulations was carefully placed into a ziplock bag and stored at a temperature of −20°C for further analyses.
2.3. Proximate composition of the flours
Employing the AOAC method (Citation2000), the proximate composition of the flour samples was determined (using methods 925, 10, 65.17, 974, 24, and 992.16). The carbohydrate content was calculated by subtracting the percentages of moisture, protein, ash, fat, and fiber from 100%.
2.4. Functional properties of the flours
The functional properties of the flour samples, encompassing water absorption capacity (WAC), water solubility index, swelling capacity (SC), and bulk density (BD), were determined using a modified method described by Adeyanju and Bamidele (Citation2022). The water absorption capacity was determined by introducing 2 g of the sample (W1) into a centrifuge tube, followed by the addition of 30 ml of water. After vortexing the sample for a duration of 10 minutes, a resting period of another 10 minutes ensued. Subsequently, the suspension underwent centrifugation for 15 minutes at a speed of 4100 x g. Upon completion of centrifugation, the liquid supernatant was poured off, and the tube containing the residue was weighed (W2). The water absorption capacity was calculated by determining the gram of water absorbed per gram of flour.
For the evaluation of swelling capacity and water solubility index, 2 g of flour was measured and placed into a 50 ml centrifuge tube. Subsequently, 30 ml of distilled water was gently mixed with the flour. This mixture was subjected to heating in a water bath set at 90°C for a duration of 15 minutes. Throughout the heating process, the slurry was stirred gently to prevent the formation of flour clumps. After 15 minutes of heating, the centrifuge tube containing the paste underwent centrifugation at a speed of 4100 x g for 10 minutes, using the Eppendorf centrifuge (5702 R Germany). Following centrifugation, the liquid supernatant was immediately decanted. The water solubility index of the sample was determined using the percentage of dry particles recovered from the supernatant after overnight drying in an oven set at 100°C.
To determine the bulk density, an exact 10 g of the flour sample was placed into a 50 ml graduated measuring cylinder. The sample was compacted through gentle tapping of the cylinder on the bench top 10 times, from a height of 5 cm, until no further volume change occurred. The bulk density was determined from the ratio of the sample weight divided by the tapped volume of the sample.
2.5. Pasting properties of the flour samples
The assessment of the pasting attributes of the flour samples followed the method described by Adeyanju and Bamidele (Citation2022) with minor modifications. A Rapid Visco Analyzer (TECMASTER, Perten Instrument in Hägersten, Sweden) was used to evaluate the pasting profile of the flour samples. Approximately 3 g of the sample was introduced into a canister, followed by the addition of 25 ml of distilled water. A paddle was carefully positioned within the canister, ensuring a secure connection to the paddle connector. The canister containing the sample and the paddle was then inserted into the RVA apparatus. Commencing the measurement sequence involved pressing the motor tower of the instrument. A 14-minute profile was executed, adhering to the subsequent temperature-time parameters: an initial resting phase at 50°C for 1 minute, a gradual temperature increase from 50°C to 91°C over a period of 4 minutes, a subsequent holding period at 91°C for 3 minutes, a cooling phase retracing to 50°C within 4 minutes, and a final 2-minute period during which the temperature was maintained at 50°C.
2.6. In vitro starch digestibility of the flour samples
Using a modified version of Englyst et al. (Citation1992) protocol, the in vitro starch digestibility of the cooked composite flour (fermented cassava and tigernut flours) was ascertained. Enzyme solution I was made by diluting amyl glucosidase solution (0.14 mL) with water to 6.0 mL. Porcine pancreatin weighing 12 g was suspended in 80.0 mL of water, centrifuged at 1500 g for 10 minutes, and the supernatant (54.0 mL) was then poured into a flask to create Enzyme Solution II. Just before usage, 54.0 mL of water, 6.0 mL of enzyme solution I, and 6.0 mL of enzyme solution II were combined to create enzyme III. Cooked composite flour sample (200 mg, db) was mixed with enzyme solution III (5.0 mL) and sodium acetate buffer (pH 5.2, 15.0 mL) in a polypropylene centrifuge tube (30.0 mL). The tube was shaken in a water bath at 37°C (90 strokes per minute). Following a 20-minute duration, 0.5 mL of the digest was combined with 20.0 mL of 66% ethanol, stirred, and then centrifuged. The amount of glucose in the supernatant was measured using glucose oxidase, and the RDS was calculated by multiplying the amount of glucose (mg) released by 0.9 and then dividing the result by 200 mg. The amount of glucose released after 120 minutes of digestion is known as undigested starch, or resistant starch; the amount released between 20 and 120 minutes of digestion is known as slowly digested starch, or SDS; and the amount released after 20 minutes of digestion is known as rapidly digestible starch, or RDS. The amount of glucose in 120 minutes was calculated using the following formulas.
2.7. Extraction of free phenolic compounds and determination of total phenolic content
The extraction of free phenolic compounds from flour samples involved weighing 1 g of each sample into 30 ml beakers, with duplicates for each sample. Subsequently, 10 ml of methanol with 1% conc. HCl was added, and the beakers were covered with foil before shaking on an orbital shaker (Stuart Cole-Parmer Ltd., India) operating at 200 rpm for 2 hours. After centrifugation at 3500 g for 10 minutes, the supernatant was transferred into a 30 ml tube. To ensure comprehensive extraction, the residue underwent two additional 30-minute cycles, and all supernatants were combined and stored at −20°C. The same extraction procedure was replicated with a 70% aqueous acetone. To determine total phenolic content, a modified method described Adeyanju and Duodu (Citation2023) was used. 0.1 ml of 1% HCl-methanol extract, blank (extracting solvent), and phenolic standard (gallic acid; 0.1–0.5 mg/ml) were added to 7 ml of deionized water within individual 15-ml test tubes in triplicate. Folin Ciocalteu reagent (0.5 ml) and 20% (w/v) aqueous sodium carbonate (1.5 ml) were introduced successively, followed by incubation and absorbance measurement at 765 nm using a UV spectrophotometer (Biochrom Libra PCB 1500, Biochrom Ltd., UK). Results were expressed as milligrams of gallic acid equivalents (GAE) per gram of the sample.
2.8. Antioxidant assays
The 2,2-azino-bis-3-ethylbenzothiazoline-6-sulphonic acid (ABTS) radical scavenging activity of the flour samples was conducted with a modification of the procedure outlined by Adeyanju and Duodu (Citation2023). In this process, ABTS (8 mg) was dissolved in 1 ml of deionized water to form solution A. Simultaneously, potassium persulfate (1.32 mg) was dissolved in 1 ml of deionized water to form solution B. By mixing 1 ml of solution A with 1 ml of solution B, the monocation ABTS•+ radical was generated. This mixture was then allowed to react in the dark at room temperature for a period of 12 to 16 hours. To prepare a fresh working solution of the ABTS radical cation, 2 ml of the ABTS radical was combined with 58 ml of PBS buffer (pH 7.4). Subsequently, to a 0.2 ml HCl-methanol extract, 3 ml of the above-prepared ABTS working solution was added. The resulting mixture was kept in the dark at room temperature for 30 minutes. Following this incubation, the absorbance was measured at 734 nm using a UV spectrophotometer (Biochrom Ltd. UK). By employing trolox as a standard (0, 100, 200, 400 600,800 and 1000 µM), the capacity of the sample to scavenge ABTS radicals was assessed and expressed as micromoles of trolox equivalent per gram of the sample (µmol TE/g).
The assessment of 2,2-Diphenyl-1-picrylhydrazyl (DPPH) radical scavenging activity was carried out using a methodology described by Razola-Díaz et al. (Citation2022), with some modifications. A mother solution was prepared by dissolving 24 mg of DPPH in 100 ml of methanol. Subsequently, a working solution of DPPH was prepared by combining 10 ml of the mother solution with 50 ml of methanol. The absorbance of this working solution was adjusted to around 1.1 at 515 nm using the mother solution. For the assay, 0.2 ml of each 70% aqueous methanol extract was added to 3 ml of the DPPH working solution. This mixture was then placed in the dark at room temperature for 30 minutes. The absorbance was measured at 515 nm using a UV spectrophotometer (Biochrom Ltd. UK), and the result quantified as micromole trolox equivalents per gram of the sample (µmol TE/g).
The Ferric Reducing Antioxidant Power (FRAP) assay was conducted according to the protocol described by Razola-Díaz et al. (Citation2022), with slight adjustments. This method operates on the principle of converting an initially colourless ferric-tripyridyltriazine complex into a blue ferrous-coloured form, facilitated by electron donation in the presence of antioxidants. In this procedure, 100 µL of each extract was combined with 200 µL of deionized water and 2 ml of the FRAP reagent. The mixture was then incubated at 37°C for 30 minutes, followed by the measurement of absorbance at 595 nm. A standard curve of trolox equivalent (TE) was employed for the assessment, and the result was quantified as micromoles of trolox equivalents per gram of the sample (µmol TE/g).
2.9. Statistical analyses
All analyses were done in triplicate. The data were subjected to analysis of variance (ANOVA) utilizing the Statistical Package for the Social Sciences (IBM SPSS; version 22, Armonk, U.S.A.). To identify significant distinctions between means with a confidence level of 95% (p < 0.05), the Tukey’s HSD post-hoc test was employed.
3. Results and discussion
3.1. Proximate composition
The flour samples displayed notable variations (with a significance level of p < 0.05) in their proximate composition (). The proximate composition analysis of 100% tigernut flour indicated moisture (8.53%), crude protein (10.70%), crude fat (6.66%), crude fiber (7.31%), ash (5.10%), and carbohydrates (62.52%). In comparison, the analysis of 100% cassava flour showed moisture (7.16%), crude protein (1.53%), crude fat (0.23%), crude fiber (1.20%), ash (1.10%), and carbohydrates (88.80%). All the flour samples showcased low moisture content, ranging from 7.16% to 9.93%. The highest moisture content was observed in the composite flour containing an equal mix of 50% fermented cassava flour and 50% tigernut flour. Maintaining moisture content below 13 g/100 g is crucial for flour storage to prevent caking and microbial growth, which can lead to spoilage (Iwe et al., Citation2017). Thus, the low moisture content in all the flour samples suggests their suitability for extended storage stability. The average crude protein content of the flour samples spanned from 1.53% to 10.70%. The 100% fermented cassava flour had the lowest value, whereas 100% tigernut flour had the highest. Composite flours displayed a significant increase in crude protein content, ranging from 62% to 344%, compared to 100% fermented cassava flour. This showed the effects of incorporating tigernut flour into fermented cassava flour. The mean crude protein values for both fermented cassava and tigernut flours in this study align with previous findings by Chimphepo et al. (Citation2021) for cassava flour and Chinma et al. (Citation2010) for tigernut flour. Among the flour samples, 100% tigernut flour exhibited the highest crude fat content (6.66%), while 100% fermented cassava flour had the lowest value (0.23%). The higher crude fat content in 100% tigernut flour, compared to fermented cassava flour, was consistent across all composite flours, where an increased proportion of tigernut flour (10% to 50%) led to a significant rise in crude fat content (with p < 0.05 significance). The crude fat content of the fermented cassava flour in this study falls within the range reported for various cassava varieties by Nilusha et al. (Citation2021).
Table 1. Proximate composition of composite flour from tigernut and fermented cassava flour.
Regarding crude fiber and ash, 100% tigernut flour has the highest values of 7.31% and 5.10%, respectively. These values were higher than 100% fermented cassava flour, which contained 1.20% crude fiber and 1.10% crude ash. The inclusion of Tigernut flour in the composite flours increased both crude fiber and crude ash content significantly. Ash content serves as an indicator of mineral and non-volatile content in flour (Montagnac et al., Citation2009), and it is commonly utilized to assess flour quality in the food industry. The higher levels of crude fiber in all composite flours can be attributed to the addition of Tigernut as shown in crude fiber value (7.31%) of 100% Tigernut flour. Carbohydrates constitute the primary component in both cassava and tigernut flour. However, fermented cassava flour exhibited a significantly higher carbohydrate content (88.80%) compared to tigernut flour (62.52%). The carbohydrate content of composite flours decreased significantly (with p < 0.05 significance) as the percentage of tigernut flour increased from 10% to 50%. Comparable carbohydrate contents ranging from 83.48% to 93.13% have been reported for cassava flour (Agbemafle, Citation2019; Nilusha et al., Citation2021).
3.2. Functional properties
Presented in are the functional attributes of tigernut flour, fermented cassava flour, and their composite blends, measured through bulk density (BD), water absorption capacity (WAC), swelling capacity (SC), and water solubility index (WSI). The findings demonstrated distinct values for 100% tigernut flour, with 0.618 g/ml, 132.01%, 3.98 g/g, and 15.80% for bulk density, water absorption capacity, swelling capacity, and water solubility index, respectively. Likewise, 100% cassava flour exhibited values of 0.759 g/ml, 168.21%, 9.97 g/g, and 20.44% for bulk density, water absorption capacity, swelling capacity, and water solubility index, respectively.
Table 2. Functional properties of composite flour from tigernut and fermented cassava flour.
Across the flour samples, BD ranged from 0.618 g/ml to 0.759 g/ml, with 100% fermented cassava flour displaying the highest value and 100% tigernut flour displaying the lowest. The BD observed for fermented cassava flour in this study is within the range of 0.57 g/ml and 0.79 g/ml reported earlier (Chimphepo et al., Citation2021; Hasmadi et al., Citation2020). Within these composites, the fermented cassava flour: tigernut flour blend at a ratio of 90:10 displays the highest BD (0.745 g/ml), while the fermented cassava flour: tigernut flour blend at a ratio of 50:50 exhibits the lowest BD (0.684 g/ml). Notably, as the proportion of tigernut flour increased from 10% to 50% within the composite flour, there was a significant reduction in the bulk density of the composite flours. Bulk density, which is a measure of sample porosity, not only affects packaging design but also aids in selecting appropriate materials for wet processing (Chimphepo et al., Citation2021). The notion that high BD is a relevant physical property when evaluating the mixing quality of any food sample is widely accepted (Adeyanju & Bamidele, Citation2022). The elevated bulk density observed in 100% cassava flour in contrast to 100% tigernut flour can be ascribed to several factors. Firstly, this disparity may stem from the presence of smaller and more densely packed particles in cassava flour compared to tigernut flour. Secondly, the higher moisture content in tigernut flour, as opposed to fermented cassava flour, contributes to increased volume without a substantial gain in mass. Additionally, differences in the flour composition play a role, with 100% cassava flour displaying significantly higher carbohydrate content and noticeably lower protein and fiber content compared to tigernut flour. Given that carbohydrates contribute more to bulk density than protein and fiber, this compositional distinction is likely a contributing factor.
The WAC of the flour samples exhibited a range from 132.01% to 168.21%, with the highest value found in 100% fermented cassava flour and the lowest in 100% tigernut flour. In this study, the water absorption capacity of fermented cassava flour falls within the range of cassava flour (143.56 g/100 g to 171.04 g/100 g) reported by Chimphepo et al. (Citation2021). Within the realm of composite flours, variations in water absorption capacity were also apparent, with values spanning from 142.07% to 164.53%. The composite flour with an equal proportion of tigernut and fermented cassava flour (50:50) registered the lowest WAC (142.07%), while the composite flour containing just 10% tigernut flour had the highest (164.53%). This significantly higher water absorption capacity of fermented cassava flour compared to tigernut flour may be attributed to cassava flour’s higher starch content and the presence of other hydrophilic component. Starch molecules have hydrophilic regions that bind with water molecules, leading to increased water absorption capacity. WAC refers to the depiction of flour’s hydration characteristics. Hydrophilic components within the flour have an affinity for water. The outcomes of water absorption capacity illustrate the flour’s starch granules’ effectiveness in retaining moisture, which consequently reflects the degree of starch gelatinization or starch damage (Chimphepo et al., Citation2021; Padhan et al., Citation2020).
The flour samples demonstrated notable variations in their swelling capacity (SC), with values ranging from 3.98 g/g (100% tigernut flour) to 9.97 g/g (100% cassava flour). The SC obtained in this study for 100% tigernut flour closely corresponds to the value of 3.14 g/g previously reported by Culetu et al. (Citation2021). Similarly, the swelling capability determined for cassava flour in this study falls within the range of 8.81 to 10.05 g/100 g as previously reported by Chimphepo et al. (Citation2021). However, the value is higher than the swelling capacity of fermented cassava flour (3.57 to 4.53) reported by Odey and Lee (Citation2020). The variation in value could arise from the use of distinct cassava root varieties. Another potential factor contributing to the observed differences might be the variations in the analysis conditions, specifically the temperature and duration of heating employed. The swelling power exhibited an approximately 9% to 58% decrease as the proportion of tigernut flour within the composite flour increased from 10% to 50%. Research results suggest that fats impede swelling characteristics, and a negative correlation between fat content and swelling power exists (Culetu et al., Citation2021). The higher crude fat content in tigernut flour, in comparison to cassava flour, might be accountable for its lower SC. Flours endowed with robust water absorption and swelling capacities retain ample water during cooking.
The water solubility index variations spanned from 15.8% to 20.4%. The highest value was observed in 100% fermented cassava flour, while the lowest was recorded in 100% tigernut flour. Notably, the water solubility index of the composite flour experienced a significant decrease (p < 0.05) as the percentage of tigernut flour rose from 10% to 50%. The water solubility index offers insights into the degree of starch breakdown. The findings revealed a higher degree of starch breakdown in 100% fermented cassava flour compared to 100% tigernut flour. This inference is supported by the fact that 100% fermented cassava flour demonstrated a greater water solubility index in contrast to tigernut flour and the composite flours. Fermented cassava flour exhibited higher functional properties (BD, WAC, SC & WSI) values in comparison to tigernut flour, this may be attributed to its distinctive chemical composition (Li et al., Citation2022).
3.3. Pasting properties
Pasting properties provide insights into the rheological behavior of food under the influence of heat and shear forces. The addition of tigernut flour to fermented cassava flour had a significant impact (p < 0.05) on the pasting characteristics of the composite flour, as detailed in . The inclusion of tigernut resulted in a reduction in the viscosities of the fermented cassava-tigernut composite flour. Similar trends have been documented in blends such as cassava starch-mushroom, and cassava-sweet potato starch (Adebowale et al., Citation2011; Imoisi et al., Citation2020; Ojo et al., Citation2017).
Table 3. Pasting properties of composite flour from tigernut and fermented cassava flour.
Peak viscosity (PV) has been associated with starch-based foods’ ability to swell before breaking down, and it has been linked to starch’s water-binding capacity (Imoisi et al., Citation2020). It has been reported that PV correlates closely with the viscous resistance experienced by food materials during mixing. The peak viscosity ranged from 197.50 RVU (100% tigernut flour) to 5693.00 RVU (100% fermented cassava flour). Increase in peak viscosity is often associated with increased starch damage and starch content (Ekunseitan et al., Citation2016; Ojo et al., Citation2017), potentially explaining why 100% cassava flour exhibited the highest PV. Breakdown viscosity (BV) ranged from 13.50 RVU (100% tigernut flour) to 2599.50 RVU (100% fermented cassava flour). Higher proportions of tigernut flour in the blend led to lower BV. BV reflects the ability of cooked starch granules to break down into smaller fragments. The presence of higher non-starch constituents in tigernut flour and its blends compared to 100% fermented cassava flour could contribute to their lower BV.
Trough viscosity ranged from 184.00 to 3100.50 RVU. Trough viscosity signifies the minimum viscosity after peak viscosity has been achieved. It measures the viscosity when starch granules are disrupted or disintegrated due to heating and shear forces. Trough viscosity indicates the paste’s susceptibility to breaking down during cooling.
Setback viscosity (SV) for the flour blends ranged from 514.50 to 1007.00 RVU. As tigernut flour inclusion increased, setback viscosity decreased. Fermented cassava flour (100%) exhibited the highest SV, while tigernut flour (100%) displayed the lowest. SV describes a flour’s susceptibility to retrograde, re-associate, or reorder starch molecules (Afoakwa et al., Citation2021). Higher SV indicates that the starches in the flour have a greater tendency to retrograde, potentially leading to a faster staling process. These composite blends could find applications in products requiring starch stability at low temperatures, like fillings, adhesives, and refrigerated products. Pasting temperature and pasting time showed significant variability, ranging from 75.83 to 81.58°C and 4.80 to 5.44 min, respectively. Generally, increased tigernut flour inclusion led to higher pasting times and temperatures in the composite blends. Pasting temperature signifies the temperature at which the initial detectable viscosity is measured using an amylograph. It serves as an indicator of the minimum temperature required for cooking the food product and reflects the energy demand (Afoakwa et al., Citation2021). This parameter is influenced by the size of starch granules in the flour, with smaller starch granules exhibiting greater resistance to rupture and loss of molecular order.
The findings suggest that 100% tigernut flour, possessing the highest pasting temperature, may harbor the smallest granular size. Additionally, the considerably higher fat content in 100% tigernut flour, compared to 100% fermented cassava flour, could contribute to the elevated pasting temperature of tigernut flour. This is attributed to the potential inhibitory effect of fat on the swelling of starch granules, forming starch-lipid complexes that hinder the hydration and swelling of starch granules, consequently causing a delay in the development of viscosity.
3.4. In vitro starch digestibility
Measuring in vitro starch digestibility provides insights into the rate at which carbohydrates in a food sample break down to release glucose into the bloodstream. As illustrated in , the results portray the impact of tigernut flour addition on the in vitro starch digestibility of fermented cassava flour.
Figure 1. Effect of tigernut flour addition on the in vitro starch digestibility of cassava flour. RDS, rapidly digestible starch; SDS, slowly digestible starch; RS, resistant starch. Different letters along the sample period are significantly different (p < 0.05).
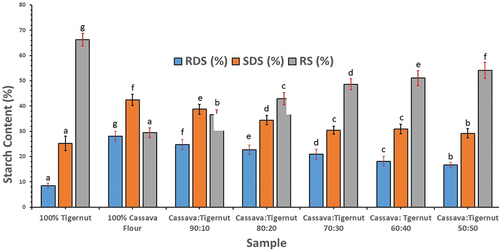
The findings unveiled notable and statistically significant disparities (p < 0.05) among the flour samples concerning their RDS, SDS, and RS. RDS ranged from 8.53% to 28.08%, with 100% cassava flour exhibiting the highest value and 100% tigernut flour displaying the lowest. As the proportion of tigernut flour increased in the composite flours from 10% to 50%, the content of RDS notably decreased from 24.71% to 16.7%. Among the composite flours, fermented cassava: tigernut (90:10) displayed the highest content of RDS, while fermented cassava: tigernut (50:50) exhibited the lowest. SDS within the flour samples ranged from 25.23% to 42.39%, with 100% cassava flour having the highest and 100% tigernut flour the lowest. The levels of SDS in the composite flour also showed a significant reduction as the proportion of tigernut flour in the blend increased from 10% to 50%. The composite flour containing just 10% tigernut flour recorded the highest SDS (38.76%) among the composites, whereas the composite flour with 50% tigernut flour exhibited the lowest (29.2%).
In terms of RS, values varied from 29.53% to 66.25%, with 100% tigernut flour having the highest and 100% fermented cassava flour having the lowest content. Among the composite flours, RS levels notably increased (p < 0.05) as the proportion of tigernut flour increased from 10% to 50%. The composite flour with an equal combination of tigernut flour and fermented cassava flour (50:50) exhibited the highest resistant starch content (54.1%), while the composite flour with just 10% tigernut flour and 90% fermented cassava flour recorded the lowest (36.54%). Furthermore, the results demonstrated that the composite flours had significantly higher levels of RS compared to 100% cassava flour. The observed levels of RDS, SDS and RS in this study for cassava flour fall within the range of values previously reported (Odey & Lee, Citation2020). The elevated content of RS in 100% tigernut flour can be attributed to its substantial dietary fiber (both soluble and insoluble) content and possible interaction between starch and lipid during heating.
High levels of RDS can prompt rapid spikes in blood glucose levels, potentially contributing to chronic diet-related diseases like diabetes and cardiovascular conditions (Adeyanju & Bamidele, Citation2022). Conversely, foods rich in resistant starch tend to have a low glycemic index because they resist swift breakdown by digestive enzymes such as α-amylase, resulting in a gradual release of glucose into the bloodstream (Panyoo & Emmambux, Citation2017). The fact that tigernut flour significantly elevates resistant starch levels in the composite flour underscores the value of combining cassava flour with tigernut flour.
3.5. Total phenolic content and radical scavenging activities
The results regarding total phenolic content and radical scavenging activities, assessed through ABTS (2,2′-Azinobis [3-ethylbenzothiazoline-6-sulfonic acid]-diammonium salt), DPPH (2,2-diphenyl-1-picrylhydrazyl), and FRAP (Ferric reducing antioxidant power), for tigernut flour (100%), fermented cassava flour (100%), and their composite blends are shown in . The total phenolic content exhibited variation across all samples, ranging from 0.42 to 6.14 mg GAE/g flour. The highest total phenolic content was recorded in 100% tigernut flour, while 100% fermented cassava flour displayed the lowest. Additionally, the results showed significant increase (p < 0.05) in the total phenolic content of the composite flours as the proportion of tigernut within the blends increased from 10% to 50%.
Table 4. Total phenolic content and radical scavenging activity of composite flour from tigernut and cassava flour.
Remarkably, the composite flour comprising 50% tigernut flour exhibited the highest total phenolic content (4.06 mg GAE/g flour), whereas the composite flour with the lowest tigernut flour quantity (10%) presented the lowest total phenolic content (approximately 1 mg GAE/g). It is noteworthy that the total phenolic content of the composite flours was considerably (p < 0.05) higher than that of 100% fermented cassava flour, ranging from 101% to 860%, signifying an elevated total phenolic content in tigernut flour compared to cassava flour.
The total phenolic content within a flour sample provides insights into its phenolic constituents. The significantly higher total phenolic content in 100% tigernut flour compared to 100% fermented cassava flour underscores the presence of a greater number of phenolic compounds in tigernut flour relative to fermented cassava flour. Previous studies (Roselló-Soto et al., Citation2018; Razola-Díaz et al., Citation2022; Pelegrín et al., Citation2022 have established that tigernut encompasses an array of phenolic compounds, including phenolic acids (ferulic acid, cinnamic acid, coumaric acid, gallic acid, caffeic acid, and p-hydroxybenzoic acid) and flavonoids (apigenin, luteolin, naringenin, and quercetin). These compounds are likely responsible for tigernut flour’s significantly higher total phenolic content compared to cassava flour. The observed augmentation in total phenolic content within the composite flours suggests that the inclusion of tigernut flour contributes to an enhancement in their phenolic constituents.
The DPPH radical scavenging potential of the flour samples ranged from 6.38 to 22.92 µmol TE/g, with 100% tigernut flour displaying the highest DPPH radical scavenging activity and 100% fermented cassava flour exhibiting the lowest. Additionally, the results showed a significant rise (p < 0.05) in the DPPH radical scavenging activity of the composite flours as the proportion of tigernut within the blends increased from 10% to 50%. Remarkably, the composite flour comprising 50% tigernut exhibited the highest DPPH radical scavenging activity, while the composite flour containing 10% tigernut displayed the least DPPH radical scavenging efficacy.
Similarly, the ABTS radical scavenging power across the flour samples varied from 7.04 µmol TE/g flour to 34.49 µmol TE/g flour. The highest ABTS radical scavenging power was evident in 100% tigernut flour, with the lowest in 100% fermented cassava flour, underscoring the significance of combining fermented cassava flour with tigernut flour. The ABTS radical scavenging power in the flour samples also exhibited an increase as the proportion of tigernut flour in the composite blends increased from 10% to 50%. Among the composite flours, the fermented cassava and tigernut blend (50:50) presented the highest ABTS radical scavenging power, while the composite flour with only 10% tigernut (cassava and tigernut, 90:10) displayed the lowest ABTS radical scavenging power.
Similar trends were observable in the FRAP assay; the value was significantly higher in 100% tigernut flour compared to 100% fermented cassava flour. Furthermore, the value increased significantly (by 69–160%) as the proportion of tigernut in the composite blends increased from 10% to 50%. Generally, tigernut flour (100%) exhibited higher radical scavenging activity as assessed by ABTS, DPPH, and FRAP in comparison to 100% fermented cassava flour. This observation suggests that tigernut has the potential to offer better protection against free radicals. This alignment (i.e. increase in TPC correspond to increase in free radical scavenging power) underscores that the radical scavenging activity of the flour samples stems from their phenolic constituents, which aligns with the previous report of Adeyanju and Duodu (Citation2023).
4. Conclusions
The outcomes of the study demonstrated that the addition of tigernut flour significantly enhances the protein, fiber, and ash content of cassava flour. However, it was observed that tigernut flour might not be the option for products requiring high viscosity, as its inclusion in fermented cassava flour led to notable reductions in water absorption capacity, swelling capacity, and viscosity of the combined flour. Moreover, the incorporation of tigernut flour resulted in a substantial decrease in rapidly digestible starch while increasing the amount of resistant starch in the composite flour, ultimately leading to a considerable reduction in in vitro starch digestibility. Furthermore, the combination of cassava flour with tigernut flour yielded composite flours with elevated total phenolic content and enhanced radical scavenging activity. These findings imply that composite flours made from cassava and tigernut could be utilized in the development of food products that have the potential to provide enhanced protection against the detrimental effects of free radicals in the body. The production of a composite flour by blending fermented cassava flour with tigernut flour not only offers potential health advantages for consumers but also promotes the sustainable utilization of these crops.
Authors contributions
Adeyemi Ayotunde Adeyanju, Johnson Akinwumi Adejuyitan and Eunice Ogunbusola: Conceptualization; Data curation; Methodology; Project administration; Resources; Writing – review & editing; Writing – original draft. Darasim Gift Adeleye: Data curation; Methodology; Resources; Software; Writing – original draft. Oluwaseun Peter Bamidele: Data curation; Formal analysis; Methodology; Writing – original draft.
Acknowledgments
The authors would like to acknowledge the contributions of individuals who made this study a success. Special thanks to all the technicians (Mr Oke, Mr Tosin, Mr Faith) that helped in analyzing the samples.
Disclosure statement
No potential conflict of interest was reported by the author(s).
Data availability statement
The data supporting this study’s findings are available on request from the corresponding.
Additional information
Funding
References
- Adebowale, A. A., Sanni, L. O., & Fadahunsi, E. L. (2011). Functional and pasting properties of cassava – sweetpotato starch blends. African Journal of Root and Tuber Crops (AJRTC), 9(1), 6–9.
- Adeyanju, A. A., & Bamidele, O. P. (2022). Nutritional composition, in vitro starch digestibility and antioxidant activities of composite flour made from wheat and mature, Unripe Pawpaw (Carica papaya) fruit flour. Nutrients, 14(22), 4821. https://doi.org/10.3390/nu14224821
- Adeyanju, A. A., & Duodu, K. G. (2023). Effects of different souring methods on phenolic constituents and antioxidant properties of non‐alcoholic gruels from sorghum and amaranth. International Journal of Food Science & Technology, 58(3), 1062–1077. https://doi.org/10.1111/ijfs.16245
- Afoakwa, E. O., Sampson, G. O., Nyirenda, D., Mwansa, C. N., Brimer, L., & Chiwona- Karltun, L. (2021). Physico-functional and starch pasting properties of cassava (Manihot esculenta Cruntz) flours as influenced by processing technique and varietal variations. Asian Journal of Agriculture and Food Sciences, 9(2), 71–82. https://doi.org/10.24203/ajafs.v9i2.6556
- Agbemafle, R. (2019). Proximate, starch, sugar compositions and functional properties of cassava flour. Journal of Food Security, 7(2), 40–46. https://doi.org/10.12691/jfs-7-2-3
- AOAC. (2000). Official Methods of Analysis International, 17th ed. Washington, DC, USA: Association of Official Analytical Chemists.
- Bouniol, A., Adinsi, L., Padonou, S. W., Hotegni, F., Gnanvossou, D., Tran, T., Dufour, D., Hounhouigan, D. J., &, and Akissoé, N. (2021). Rheological and textural properties of lafun, a stiff dough, from improved cassava varieties. International Journal of Food Science & Technology, 56(3), 1278–1288. https://doi.org/10.1111/ijfs.14902
- Chimphepo, L., Alamu, E. O., Monjerezi, M., Ntawuruhunga, P., & Saka, J. D. (2021). Physicochemical parameters and functional properties of flours from advanced genotypes and improved cassava varieties for industrial applications. LWT-Food Science and Technology, 147, 111592. https://doi.org/10.1016/j.lwt.2021.111592
- Chinma, C. E., Abu, J. O., & Abubakar, Y. A. (2010). Effect of tigernut (Cyperus esculentus) flour addition on the quality of wheat‐based cake. International Journal of Food Science & Technology, 45(8), 1746–1752. https://doi.org/10.1111/j.1365-2621.2010.02334.x
- Culetu, A., Susman, I. E., Duta, D. E., & Belc, N. (2021). Nutritional and functional properties of gluten-free flours. Applied Sciences, 11(14), 6283. https://doi.org/10.3390/app11146283
- Ekunseitan, O. F., Obadina, A. O., Sobukola, O. P., Omemu, A. M., Adegunwa, M. O., Kajihausa, O. E., Adebowale, A. A., Sanni, S. A., Sanni, L. O., & Keith, T. (2016). Nutritional composition, functional and pasting properties of wheat, mushroom, and high quality cassava composite flour. Journal of Food Processing and Preservation, 41(5), e13150. https://doi.org/10.1111/jfpp.13150
- Englyst, H. N., Kingman, S. M., & Cummings, J. H. (1992). Classification and measurement of nutritionally important starch fractions. European Journal of Clinical Nutrition, 46, S33–50.
- Hasmadi, M., Harlina, L., Jau-Shya, L., Mansoor, A. H., Jahurul, M. H. A., & Zainol, M. K. (2020). Physicochemical and functional properties of cassava flour grown in different locations in Sabah, Malaysia. Food Research, 4(4), 991–999. https://doi.org/10.26656/fr.2017.4(4).405
- Hernández-Olivas, E., Asensio-Grau, A., Calvo-Lerma, J., García-Hernández, J., Heredia, A., & Andrés, A. (2022). Content and bioaccessibility of bioactive compounds with potential benefits for macular health in tiger nut products. Food Bioscience, 49, 101879. https://doi.org/10.1016/j.fbio.2022.101879
- Imoisi, C., Iyasele, J. U., Imhontu, E. E., Ikpahwore, D. O., & Okpebho, A. O. (2020). Pasting properties of composite of cassava and wheat flours. Journal of Chemical Society of Nigeria, 45(6), 1157–1163. https://doi.org/10.46602/jcsn.v45i6.540
- Iwe, M. O., Michael, N., Madu, N. E., Obasi, N. E., Onwuka, G. I., & Nwabueze, T. U., & Onuh, J.O. (2017). Physicochemical and pasting properties high quality cassava flour (HQCF) and wheat flour blends. Agrotechnology, 6(2), 167.
- Liu, R., Zhang, Y., Hu, H., Gan, T., & Huang, Z. (2023). Retrogradation behavior of starch dough prepared from damaged cassava starch and its application in functional gluten-free noodles. International Journal of Biological Macromolecules, 236, 123996. https://doi.org/10.1016/j.ijbiomac.2023.123996
- Li, P. H., Wang, C. W., Lu, W. C., Chan, Y. J., & Wang, C. C. R. (2022). Effect of resistant starch sources on the physical properties of dough and on the eating quality and glycemic index of salted noodles. Foods, 11(6), 814. https://doi.org/10.3390/foods11060814
- Montagnac, J. A., Davis, C. R., & Tanumihardjo, S. A. (2009). Nutritional value of cassava for use as a staple food and recent advances for improvement. Comprehensive Reviews in Food Science and Food Safety, 8(3), 181–194.
- Nilusha, R. A. T., Jayasinghe, J. M. J. K., Perera, O. D. A. N., Perera, P. I. P., Jayasinghe, C. V. L., & Alencar, S. M. D. (2021). Proximate composition, physicochemical, functional, and antioxidant properties of flours from selected cassava (Manihot esculenta Crantz) varieties. International Journal of Food Science, 2021, 1–13. https://doi.org/10.1155/2021/6064545
- Nwaliowe, G. N., Alamu, E. O., Sanusi, R. A., & Maziya-Dixon, B. (2023). Evaluation of improved cassava (manihot esculenta Crantz) varieties and associated products for proximate, cyanogenic potential and glycemic indices. CyTA-Journal of Food, 21(1), 20–30.
- Odey, G. N., & Lee, W. Y. (2020). Evaluation of the quality characteristics of flour and pasta from fermented cassava roots. International Journal of Food Science & Technology, 55(2), 813–822. https://doi.org/10.1111/ijfs.14364
- Ojo, M. O., Ariahu, C. C., & Chinma, E. C. (2017). Proximate, functional and pasting properties of cassava starch and mushroom (Pleurotus pulmonarius) flour blends. American Journal of Food Science and Technology, 5(1), 11–18.
- Padhan, B., Biswas, M., & Panda, D. (2020). Nutritional, anti-nutritional and physico- functional properties of wild edible yam (Dioscorea spp.) tubers from Koraput, India. Food Bioscience, 34, 100527. https://doi.org/10.1016/j.fbio.2020.100527
- Panghal, A., Munezero, C., Sharma, P., & Chhikara, N. (2019). Cassava toxicity, detoxification and its food applications: A review. Toxin Reviews, 40(1), 1–16. https://doi.org/10.1080/15569543.2018.1560334
- Panyoo, A. E., & Emmambux, M. N. (2017). Amylose–lipid complex production and potential health benefits: A mini‐review. Starch‐Stärke, 69(7–8), 1600203. https://doi.org/10.1002/star.201600203
- Pelegrín, C. J., Ramos, M., Jiménez, A., & Garrigós, M. C. (2022). Chemical composition and bioactive antioxidants obtained by microwave-assisted extraction of Cyperus esculentus L. by-products: A valorization approach. Frontiers in Nutrition, 9, 944830. https://doi.org/10.3389/fnut.2022.944830
- Razola-Díaz, M. D. C., Gómez-Caravaca, A. M., Guerra-Hernández, E. J., Garcia-Villanova, B., & Verardo, V. (2022). New advances in the phenolic composition of tiger nut (Cyperus esculentus L.) by-products. Foods, 11(3), 343. https://doi.org/10.3390/foods11030343
- Rebezov, M., Usman Khan, M., Bouyahya, A., Imran, M., Tufail, T., Loretts, O., Neverova, O., Artyukhova, S., Kuznetsova, E., Ermolaev, V., & Balahbib, A. (2023). Nutritional and technical aspect of tiger nut and its micro-constituents: An overview. Food Reviews International, 39(6), 3262–3282. https://doi.org/10.1080/87559129.2021.2011910
- Roselló-Soto, E., Garcia, C., Fessard, A., Barba, F. J., Munekata, P. E., Lorenzo, J. M., & Remize, F. (2018). Nutritional and microbiological quality of tiger nut tubers (Cyperus esculentus), derived plant-based and lactic fermented beverages. Fermentation, 5(1), 3. https://doi.org/10.3390/fermentation5010003
- Yu, Y., Lu, X., Zhang, T., Zhao, C., Guan, S., Pu, Y., & Gao, F. (2022). Tiger nut (Cyperus esculentus L.): nutrition, processing, function and applications. Foods, 11(4), 601. https://doi.org/10.3390/foods11040601