
 ?Mathematical formulae have been encoded as MathML and are displayed in this HTML version using MathJax in order to improve their display. Uncheck the box to turn MathJax off. This feature requires Javascript. Click on a formula to zoom.
ABSTRACT
Mutton is a popular food with a long history of consumption and high nutritional value for the minorities such as Uyghur people in the Xinjiang Uyghur Autonomous Region, China. This study aims to investigate the changes in aroma compounds, amino acids, and nucleotides in lean, fat, and mixed samples of mutton during different storage periods. In this study, gas chromatography – mass spectrometry (GC-MS) and high-performance liquid chromatography (HPLC) were employed to detect the volatile and nonvolatile compounds. Systematic approaches were used to analyze the sensory property variations. The results showed that there are a number of compounds and chemicals which affect the flavor of different tissues during the different storage time. For instance from the lean samples: for day 1, day 14 and day 28, the Glu has the effect on the umami taste and with the changing concentration of 1375 ± 135 ng/ml, 855 ± 324 ng/ml and 2347 ± 194 ng/ml, respectively. Besides, aldehydes, alcohols, and ketones were the most abundant, while esters and thiazoles were less abundant during the different storage. Results of sensory evaluation showed that when the storage time increased, the sour and sulfur aromas of mutton were strong, while the fatty aroma was significantly increased and decreased in fat and lean meat. The taste of mutton became worse as the storage time increased. The best storage period was 14 days, and the flavor of all mutton sample groups was better when using a 14 day storage period.
GRAPHICAL ABSTRACT

1. Introduction
Recently, hundreds of millions of sheep have been sold in the Chinese market, and the annual consumption of mutton reached 5.549 million tons. Regarding the types of consumed meat, cold fresh meat is gradually being more welcomed by consumers in the traditional consumption category, that includes hot, fresh, and frozen meat, and cooked and processed mutton meat products are also more abundant in the leisure and convenient food category. The safety, nutrition, and delicacy of meat products are important factors that affect the will of consumers to continuously purchase and consume them. The subjective feeling of meat products, especially their sensory characteristics, such as the color, flavor, and texture, determines the degree of acceptance by consumers (L. Zhang et al., Citation2012). Flavor compounds in food play an important role in food processing and storage. Aroma, one of the main sensory qualities of cured meat products, is closely related to the composition volatile constituents (Yang et al., Citation2018). Mutton generated in the Xinjiang Uyghur Autonomous Region of China, such as the Tarim basin, Hotan, Kashgar, Turpan, Urumqi and Altay, has a low cholesterol content, and it is famous for being fresh, juicy, and delicious; Mutton from these cities (i.e. Tarim basin, Hotan, Kashgar, and Altay) is highly favored by consumers in China and abroad. However, mutton consumption only ranks fourth in the meat market, behind pork, poultry, and beef. The lower consumption ranking of mutton is mainly associated to its flavor. Flavor is crucial to evaluate the product quality. One of the important sensory factors for the consumer’s decision for meat purchasing is the meat flavor. Meat processing can be helpful to improve its flavor, digestion, texture and so on. Processing of meat improves its flavor, texture, digestion characteristics, and shelf life (Liu et al., Citation2023). Roldán et al. found that different temperatures and time combinations affected the flavor of vacuum-cooked lamb; a long cooking time and medium or high temperature produced the best meat flavor (Roldán et al., Citation2015). It is reported that Aldehydes, alcohols, and ketones are the most volatile flavor substances in mutton (Zhang et al., Citation2022). So far, no information has been published regarding the effect of lean, fat, and mixed samples of mutton during different storage periods to analysis the different meat flavor.
The specific flavor of meat products is related to the characteristics of the raw materials, such as the variety, age, feeding and slaughter factors, and temperature (Farmer & Patterson, Citation1991). The production of flavor compounds in meat products is a complex process involving many flavor precursors, intermediates, and their interaction products (S. B. Li et al., Citation2022). The main points of view on the relationship between meat flavor precursors and meat flavor were summarized by (Alim, Song, Chao et al., Citation2019) as follows: 1, the characteristics of meat flavor are mainly derived from sulfur-containing nitrogen compounds, which are produced by water-soluble precursors of lean meat; 2, the Maillard reaction between reducing sugars and amino acids plays a major role in the formation of the meat aroma; 3, fat and fat-soluble substances may play a role in the flavor differences between species.
Adipose tissue is the most evident source of mutton flavor, with the main flavor compounds being branched-chain fatty acids, aldehydes, phenols, and ketones. It has been confirmed that volatile 4-methyloctanoic acid, 4-methylnonanoic acid, 4-ethyloctanoic acid, and other 4-alkyl branched fatty acids are the key flavor compounds of meat from sheep and goats (Eibler & Vetter, Citation2017; Kaffarnik et al., Citation2014). Moreover, aldehydes, ketones, lactones, and stearic acid have been shown to have adverse effects on mutton flavor. The present study aimed to confirm the key aroma compounds in different mutton tissue types and characterize the differences in aroma compounds when the mutton tissues are stored for varying periods of time. The amino acid and nucleotide contents of different mutton tissues were analyzed, and sensory evaluations of all the mutton samples were performed. This study aims to analyze the flavor compounds in three different boiled mutton tissues during storage, thereby helping produce processed mutton products with excellent flavor to meet the increasing requirements of consumers with respect to the flavor and quality of mutton.
2. Materials and methods
2.1. Materials
Sheep were grazed and kept in Altay city, and 42 male sheep were selected at random from them. The animals were slaughtered at the same time based on criteria for age (18–30 months), health and body weight (>16 kg). After the slaughter, the carcasses were randomly allocated and moved to Urumqi city within 12 hours under low temperature (frozen at −20°C) conditions. Then, the leg meat (left- and right- hand side) was removed from these carcasses and stored at the same low temperature in Urumqi Friendship Supermarket, where relatively fresh meat with a good glossy color and no off-flavors was purchased for this study. The carcass processing was similar to that described in previous studies (Biffin et al., Citation2020). The samples were processed and analyzed using the following: hydrochloric acid (Beijing Sinopharm Chemical Reagent Co., Ltd.), methanol (Thermo Fisher reagent company), acetonitrile (Thermo Fisher reagent company), 9-fluorene methyl chloroformate (Agilent Technologies), an Agilent 1200 series high-performance liquid chromatograph (HPLC) (Agilent Technologies), an Agilent 7890A model gas chromatograph (Agilent Technologies), a C21-WH2106 model induction cooker (Midea Induction Cooker Technology Co., Ltd.), a vacuum packaging machine (Wenzhou Fengnian Machinery Co., Ltd.), and a YP2002 electronic balance (Shanghai Yueping Scientific Instrument Co., Ltd.).
2.1.1. Experimental method and sample preparation
Approximately 1 kg of lean, fat, and mixed (lean and fat) samples were extracted from the purchased mutton. Then, these were cut into 3 × 3 × 3 cm pieces, placed in boiling water for cooking, and removed after 25 min. The cooked mutton was cooled to room temperature, packed in a polyester vacuum packaging bag as oxygen barrier, thus avoiding flavor changes. A 13 × 8 cm polyester vacuum packaging bag was selected for this experiment. The vacuum parameters were set as follows: vacuum pressure, −0.1 MPa; vacuum time, 35 s; heat sealing time, 2 s; and exhaust time, 3 s. The packed samples were sterilized by microwaving at 20% power for 5 s twice, and then stored at 0–4°C. From the first day to the 28th day, the samples were analyzed once a week to detect the amino acids and nucleotides, assess the aroma components, and perform sensory evaluations.
2.2. Methods
2.2.1. Amino acid detection methods
After the sample prepared and treated as introduced above, the determination of amino acids were detected using reversed-phase high-performance liquid chromatography (RP-HPLC) combined with diode array detection (DAD). First, the dilution ratio of the sample was determined in a pre-experiment. Once the film was over 0.22 μm, the sample was analyzed using HPLC. An Agilent Zorbax Eclipse-AAA amino acid analytical column (4.6 × 150 mm, 5 μm) was used for the separation. The amino acids in the samples were detected as o-phthalaldehyde (OPA) and 9-fluorenylmethyl chloroformate (FMOC) derivatives, and then analyzed using DAD. The external standard method was used to quantify the amino acids. The mobile phase consisted of a salt (NaH2PO4) in phase A and an organic solvent (methanol, acetonitrile, and water) in phase B. The gradient elution of mobile phase is shown in , with a column temperature of 40°C and an injection volume of 0.5 μL, and the DAD detection wavelength was 338 nm. After following the above method of editing the sequences, automatic injection was performed as described by (Alim et al., Citation2020).
Table 1. Elution gradient of mobile phase.
2.2.2. Determination of nucleotides
The nucleotides in the mutton samples were determined using HPLC. A ZOBAX NH2 chromatographic column (150 × 4.6 mm, 10 μm) was used; the mobile phase was a methanol solution and a 0.05 mol/L sodium dihydrogen phosphate solution; the injection volume was 10 μL; and the detection wavelength was 260 nm. First, a series of standard solutions of nucleotides were prepared by dissolution with a 1 + 1 methanol-water solution to a constant volume. Then, 10 μL of each standard solution was collected for the liquid chromatography determination. According to the retention time, the peak area or height was plotted with the corresponding nucleotide concentration, and the standard working curve was drawn. Then, 5.00 g of mutton was accurately weighed and placed in a 50 mL plastic centrifuge tube, to which 10 mL of 5% precooled perchloric acid was added. This mutton-acid solution was fully homogenized using a high-speed homogenizer and separated for 5 min at 4,000 rpm. The supernatant was transferred into a 100 mL beaker, shaken with 10 mL of 5% perchloric acid for 5 min, and centrifuged. The supernatants were combined, and KOH (1 + 1) was used to adjust the pH to 6.5. The solution was filtered into a 50 mL volumetric flask, topped up to the desired volume with ultrapure water, shaken well, and filtered through a 0.45 μm filter membrane. The sample was then analyzed using HPLC, and the volume was determined using the external standard method (Alim et al., Citation2020).
where X is the nucleotides in the sample, g/kg; C is the concentration of nucleotides in the sample detected based on the working curve, μg/mL; V is the volume of sample extract, mL; and m is the mass of the sample, g.
2.2.3. Analysis of aroma compounds in the samples
Solid-phase microextraction (SPME), followed by gas chromatography – mass spectrometry (GC – MS), was performed to analyze the aroma compounds in the samples. A total of 20 g of mutton was chopped and placed in a 100 mL solid-phase microextraction headspace bottle; then, 7.5 g of NaCl was added and mixed well. A volume of 1 μL of a 2-methyl-3-heptanone solution (concentration, 0.816 μg/μL) was added to the sample as an internal standard and sealed. The samples were equilibrated in a 60°C water bath for 20 min and then extracted using an SPME fiber head with a 50/30 μm divinylbenzene/carboxen/polydimethylsiloxane (DVB/CAR/PDMS) coating for 40 min. After the extraction, the extraction head was immediately inserted into the gas chromatography injection port, and the temperature was set to 250°C for 5 min.
The gas chromatography (GC) conditions used were as follows: DB-Wax capillary column, helium carrier gas (purity >99.99%), constant flow rate of 1.2 mL/min, split ratio of 5:1, injection temperature of 250°C. The temperature rising procedure of the column box was as follows: the initial temperature was 40°C for 3 min, being raised to 200°C at 5°C/min for 32 min, and then to 230°C at 10°C/min for 3 min. The mass spectrometry (MS) conditions used were as follows: the ionization mode was electron ionization, electron energy was 70 eV, ion source temperature was 230°C, scanning range was 40–300 m/z, and solvent delay was 4 min.
To perform a qualitative analysis of the odor compounds, first, the mass spectra of the volatile aroma compounds were compared with the standard mass spectra in the NIST 2.0 mass spectrum library to identify the compounds. Then, the retention index (RI) value and the standard odor description were compared and confirmed, and the important aroma compounds were determined based on the odor characteristics of the corresponding standards.
Formula 2 was used for calculating the conversion RI value of the aroma compounds from a series of n-alkanes:
where N is the number of carbon atoms of the low carbon alkanes, n is the difference in the number of carbon atoms between the two alkanes on both sides of the aroma compounds to be tested, and tRa, tRN, and tR (N + n) are the retention times of the aromatic compounds, low carbon alkanes, and high carbon alkanes, respectively (Alim, Song, Ye et al., Citation2018).
2.2.4. Sensory evaluation
The Sensory evaluation was performed in three different sessions inside a sensory evaluation room with the temperature of 20–24°C. The sensory evaluation team had 12 trained panelists (age, 23–40 years; 50% female and 50% male; 5 teachers and 7 graduate students of our college of food sciences and pharmacy; this demographic information was added as covariates in the statistical analysis). On the evaluation day, the samples for all sessions were placed under the same conditions. A total of 12 panelists were present in each session with 3 rounds of testing. All panelists had a two-week sensory evaluation and taste dilution training. The sensory standards were as follows: a 15 mmol/L quinine solution was the bitter standard, 1.5 mmol/L tartaric acid solution was the sour standard, 40 mmol/L NaCl solution was the salty standard, 15 mmol/L monosodium glutamate solution was the umami standard, and the model chicken broth with 5 mmol/L reduced glutathione was the kokumi standard (Tao et al., Citation2019). A quinine solution (15 mmol/L), whose concentration was adjusted to improve the taste training, was used as the bitter standard. The samples were prepared and delivered to the panelists for tasting, and the tasting procedures were performed by asking the panelists to evaluate the samples based on the standard criteria. The characteristics of the samples were scored using a 10-point system. The intensity of the aroma and taste were ranked using 10-point scales (0–2, very weak; 3–4, weak; 5–6, medium; 7–8, strong; 9–10, very strong (Alim, Song, Yang et al., Citation2019). A similar methodology was described in previous works (Alim, Yang, Song et al., Citation2018; Monika, Citation2012). Experiments were performed in triplicate, and the average scores of each trait were used for the statistical analysis.
2.2.5. Statistical analysis
The data were analyzed using SPSS 19.0, and Python packages were used for further analysis and drawing. All statistical analyses were done at 95% confidence level. The difference between models was considered significant if p < .05. For the analysis of the factors affecting each sensory trait, several fixed terms are considered for all models. The design factors of different samples, tasting round and session (3 terms) were fitted as random effects in the statistical modeling. Non-significant terms were excluded from the models if the p ≥ .05. The value for a statistically important effect was considered as critical at p < .05. The fixed terms in the results made a significant difference on the flavor ratings and other related results (p < .05; at a 6% critical value). The means, standard errors, and the significant difference of a 6% critical value for each sensory trait were predicted from each model.
3. Results
3.1. Variations in the amino acid content in lean mutton during storage
According to the determination of amino acids (P-ser, Asp, Thr, Ser, Glu, Gly, Ala, Clt, Cys, Met, Ile, Leu, Tyr, Phe, Orn, Lys, His, Arg, Pro, AspNH2, GluNH2, and Trp) in the mutton samples (). There were different trends for the five different storage periods. Compared with those of the standard CK, during the 14 days of storage the concentrations of Glu and Lys gradually decreased from 1,400 to 1,000 ng/mL and from 1,250 to 500 ng/mL, respectively. By the 28th day of storage, the concentrations of Glu and Lys reached a peak at 2,250 and 1,250 ng/mL, respectively. On the 28th day of storage, the concentrations of Gly and Arg reached a peak at 3,500 and 2,500 ng/mL, respectively The contents of other amino acids remained unchanged.
Figure 1. Changes in the concentration of amino acids in the lean samples during storage; predicted means ± standard error.
3.2. Variations in the nucleotide content in lean mutton during storage
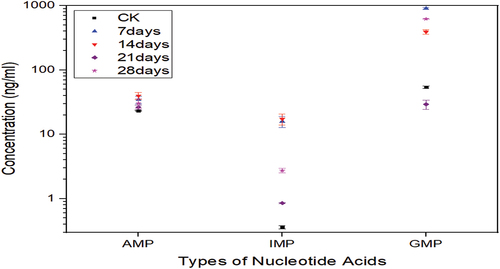
shows the variations in the nucleotide (AMP, IMP, and GMP) contents of lean mutton for different storage periods. Compared with those of the standard CK, the concentration of IMP reached the highest point of 17 ± 3 ng/mL on the 14th day of storage, and the concentration of GMP reached the lowest (29 ± 4 ng/mL) and highest (904 ± 33 ng/mL) points on the 21st and 7th day of storage, respectively (see ).
Figure 2. Variations in the nucleotide contents in lean mutton during storage; means ± standard error are shown in the figure.
3.3. Identification of odor compounds
3.3.1. Lean mutton group
shows a total of 29 aroma compounds that were detected in the lean group samples stored for different periods using SPME/GC – MS. The several odorants were identified in the lean meat group samples such as undecane (alkane), hexanal (fatty), 2-pentylfuran (butter), acetic acid (sour), 1-octen-3-ol (mushroom), and 2-undecanone (orange). Variance analysis was used to determine whether there was a significant difference in the concentration of the aroma compounds at different storage times. SPME/GC – MS was used to identify different kinds of compounds at different storage times. Some compounds that were not present in the standard CKA only appeared after a certain period of storage, such as 2-heptanone and pentanol, while other compounds, such as furfural, disappeared after storage. Various kinds of aroma compounds were produced when the storage time reached 21 days. The concentration of 1-octen-3-ol, which has an aroma characteristic of mushroom, was the highest at 21 days. Benzothiazole appeared on the 28th day of storage.
Table 2. Analysis of the aroma compounds detected using solid-phase microextraction/gas chromatography – mass spectrometry (SPME/GC – MS) in the lean group stored for different periods. The data are expressed as the means ± standard error.
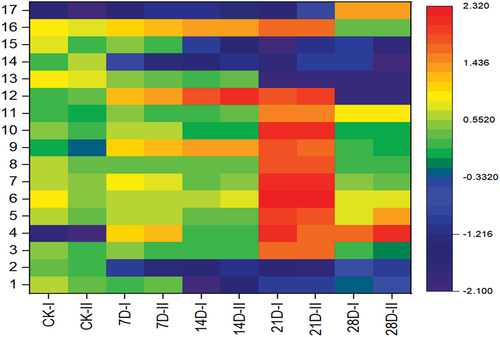
To further study the changes in lean meat at different storage periods, we selected 17 compounds whose content changed prominently during storage and carried out cluster analysis of these changes. Notably, the first 17 compounds in were selected to draw because those compounds constitute representative examples of the typical concentration changes observed, and the main results of the cluster analysis could be illustrated using a heatmap. With an increasing storage time, the compound content increased slowly. When the storage time reached 21 days, the content changes became more evident. When the storage time was beyond after 21 days, there was a downwards trend.
Figure 3. Heatmap for the cluster analysis of changes in the aroma compounds in lean mutton during storage.
3.3.2. Group of mixed (lean and fat) mutton
As shown in , the amount and concentration of the aroma compounds in the mixed groups before and after boiling were compared. Variance analysis was used to determine whether there were significant differences in the concentration of the aroma compounds at different storage times. The results show that some compounds that were not present in the CKB standard sample, such as sulfide and SEC butylcyclohexyl, only appeared after 21 days of storage, while acetic acid disappeared after 7 days of storage. When the storage time reached 21 days, the concentration of various compounds, such as 1-octen-3-ol, which is the characteristic aroma of mushrooms, was the highest.
Table 3. Analysis of the aroma compounds detected using SPME/GC – MS from the mixed (fat and lean) group stored for different periods. The data are expressed as the mean ± standard error.
To further characterize the content changes in the mixed samples at different storage periods, 24 compounds that appeared during the storage process were used for cluster analysis. The results are shown in . With an increasing storage time, the compound content increased slowly. When the storage time was 21 days, the content change was more evident; however, when the storage time was continued past 21 days, there was a compound content downwards trend.
Figure 4. Heatmap for cluster analysis of the changes in the aroma compounds in mixed (fat and lean) mutton during storage.
3.3.3. Fat group
shows a total of 24 aroma compounds detected using SPME/GC – MS from the fat group treated for different storage times. The following aroma compounds were identified in the fat group samples: (E)-2-nonenal (cucumber), 2,4-nonadienal (fatty), (E)-2-octenal (green, nutty), benzaldehyde (almond), among others. shows that the longer the storage time was, the lesser the compounds produced in the standard CK. On the 28th day, only 16 compounds were produced, which was at least 50% less than those produced in the standard. Heptanal and benzaldehyde disappeared after storage. (E)-2-octen-1-ol appeared only after 14 days of storage. On the 14th day of storage, more compounds were produced, the concentration of nonanal was the highest, and the aroma characteristics were fat, citrus, and green. Most of the compounds produced are derived from lipid oxidation and are very important for the meat flavor. Volatile flavor compounds in boiled mutton are mainly fat degradation products, such as aldehydes, alcohols, and ketones (Edwards et al., Citation1999).
Table 4. Analysis of the aroma compounds detected using SPME/GC – MS in the fat group stored for different periods. The data are expressed as the means ± standard error.
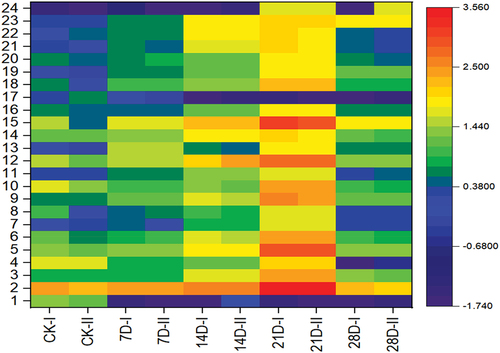
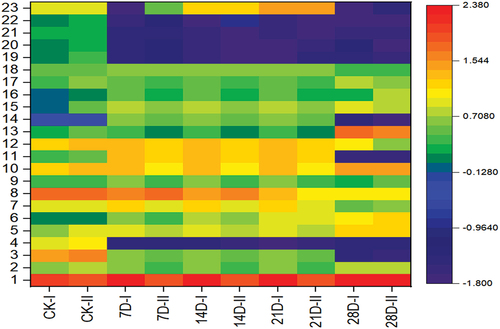
The first 23 compounds in with whose content shows prominent changes during storage were selected for cluster analysis; the results are shown in a heatmap, and the changes in fat meat at different storage periods were further investigated. The heatmap of indicates that with an increasing storage time, the contents of compounds 4 and 19–22 decreased, whereas the contents of most compounds increased. Once the storage time reached 21 days, the content change was evident. When the storage time was longer than 21 days, there was a downwards trend in the contents of the compounds
Figure 5. Heatmap for cluster analysis of the changes in aroma compounds in fat mutton during storage.
The contents of heptanal, hexanal, and nonanal in samples A and B were higher than those in sample C, which may be related to the different muscle tissue structures. Aldehydes are the main flavor compounds in meat products, and most of them, being highly volatile due to the oxidation of fatty acids (Sanchez-Pena et al., Citation2015), have a low flavor threshold and a characteristic fat aroma, even at low concentrations. Heptanal has a nutty and green fruity flavor, nonanal has a strong fatty flavor, and hexanal has an apple, leaf, and green grass flavors. These straight chain aldehydes are the basic substances that give meat its characteristic flavor (Qi et al., Citation2022). Ketones might be produced via Maillard reaction and fat oxidation (Ruiz et al., Citation2001), esters are mainly produced by the esterification of their corresponding acids and alcohols under the action of microorganisms.
Acids include acetic and heptanoic acids. These are generally produced by small molecular fatty acids formed by fat hydrolysis or lipid oxidation in meat, and are important components that contribute to the meat aroma (Hidalgo & Zamora, Citation2016; Jahan et al., Citation2010). Sulfur-containing compounds, including dimethyl sulfide and dimethyl trisulfide, which cooperate with each other, are responsible for forming the special flavor of meat (Kim et al., Citation2019; Wang et al., Citation2016). Let’s take Hexanal (one of the chemicals which have been found in three samples) as an example, it’s concentration changed with the different storage time (from day 1 to day 28) as follows: In the lean sample, 158.14 ± 45.63, 12.27 ± 0.08, 118.73 ± 11.96, 2960.83 ± 654.86, and 75.54 ± 6.84 μg/L; In the fat sample, 96.96 ± 9.26, 122.74 ± 78.72, 638.42 ± 457.16, 0, and 206.65 ± 34.08 μg/L; In the mixed sample, 150.54 ± 99.82, 278.2 ± 21.21, 403.67 ± 218.64, 3449.93 ± 2427.32, and 114.93 ± 18.90 μg/L. This shows the trend of first increasing and then decreasing with the extension of storage time in the same sample, and the flavor of mixed sample is more enriched due to the higher concentration. The second example of chemicals, Furfural was only found in the lean sample, and it’s concentration was decreased to 0 with the increasing storage time. The last but not the least example is Pentyl furan, and it’s concentration was detected to be 7.26 ± 3.56, 17.28 ± 2.79, 8.19 ± 0.78, 427.46 ± 39.35, and 11.13 ± 0.82 μg/L in the lean sample; 5.71 ± 1.96, 6.98 ± 1.96, 43.15 ± 10.08, 19.78 ± 13.05, 15.13 ± 3.08 μg/L in the fat sample; 6.57 ± 1.57, 7.25 ± 0.07, 44.21 ± 24.14, 17.52 ± 2.96, and 17.52 ± 2.96 μg/L in the mixed sample, indicating a trend of first increasing and then decreasing with prolonged storage time in the same sample. In the some of previous similar works, Hexanal, Heptanal, Octanal, 2-Nonnal, 1-Octanol, Furfural and other aldehydes, Alcohols, and Furan were detected in boiled lamb, while Benzothiazole and other aldehydes, Alcohols, and Furan were detected in Hu and Tan boiled lamb (J. Li et al., Citation2023). However, we did not find that other works have studied the flavor changes in the different tissues as we do in this work.
3.4. Sensory evaluation
3.4.1. Sensory evaluation of the aroma
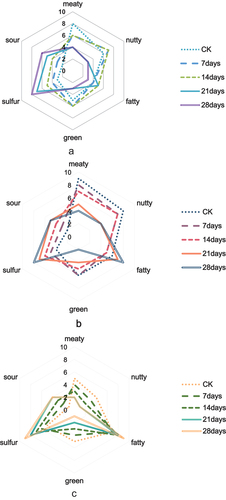
In (lean), b (mixed meat), and c (fat) shows the aroma analysis results for the mutton samples after boiling for different storage durations. Sensory evaluation showed that meaty, nutty, fatty, green, sulfur, and sour were the predominant aromas of the mutton samples. In the samples A and B, meaty was the strongest aroma, and in sample C, the fatty aroma was the most predominant. In all samples, sour aroma was the weakest. When the storage time reached 28 days, sample A had strong sulfur and sour aromas; in samples B and C, the fatty, sulfur, and sour aromas increased significantly. The results show that the sour and sulfur aromas in mutton became stronger when the storage time increased. While the fatty aroma became more evident in the fat meat when the storage time increased, its intensity was significantly weaker in the lean meat.
Figure 6. Aroma sensory evaluation results.
3.4.2. Sensory evaluation of taste
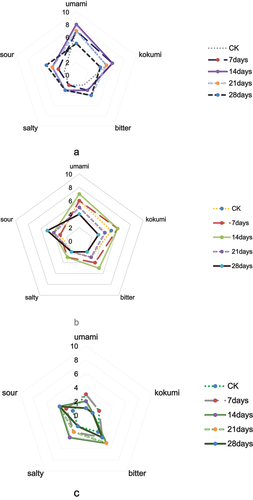
The sensory evaluation results in (lean), b (mixed meat), and c (fat) clearly show that sour, umami, kokumi, bitter, and salty were the main flavors of boiled mutton. Umami and kokumi were the strongest flavors in samples A and B, whereas the other flavors were not as strong. Umami and bitter were the most evident flavors of sample C, whereas it was not that conspicuous for the others. The results showed that the umami and kokumi flavors were the strongest in samples A and B when the storage time reached 14 days, whereas the intensity of the bitter and salty flavors increased significantly in sample C during that time. When the storage duration reached 28 days, the sourness of all samples increased. With an increasing storage time, the sour flavor of mutton became very strong, and the overall meat taste worsened. For example, Glu (umami tastants) in lean sample showed a trend of 1375 ± 135 ng/ml on the first day, 855 ± 324 ng/ml on the 14th day, and 2347 ± 194 ng/ml on the 28th day, while Arg (bitter tastants) in lean sample demonstrated a trend of 1633 ± 190 ng/ml on the first day, 1245 ± 157 ng/ml on the 14th day, and 2285 ± 310 ng/ml on the 28th day, with an initial increase followed by a decrease; The trend of both amino acids first were increasing and then decreasing; The GMP (umami tastants) showed a continuous upward trend of 904 + 2.09 ng/ml on the 14th day and 614 ± 45.02 ng/ml on the 28th day, which may be related to the microbial metabolism of mutton during storage.
Figure 7. Taste sensory evaluation results.
4. Conclusions
In this study, GC – MS and HPLC techniques were combined with sensory evaluation to analyze the flavor compounds in three different boiled mutton tissues during storage, and the mechanism of flavor deterioration during storage was speculated. The volatile active compounds in meat are produced by the interaction and degradation of flavor precursors, such as proteins, sugars, fats, and amino acids.
In the lean, mixed, and fat groups, 29, 25, and 24 aroma compounds were detected, respectively. The detected aroma compounds mainly included aldehydes, alcohols, ketones, and esters, among which aldehydes, alcohols, and ketones were more abundant, and esters and thiazoles were less abundant.
The sensory evaluation results showed that when the storage time increased, the sour and sulfur aromas of mutton were strong, and while the intensity of the fatty aromas was significantly higher in the fat group, it decreased in the lean group. In terms of taste, the sourness of all samples increased when the storage time reached 28 days. It can be concluded that the sour flavor of mutton was intensified as the storage time increased, and that the overall taste worsened with an increasing storage time.
Flavor compounds in food play an important role in food processing and storage. In this study, aroma compounds, amino acids, and nucleotides were detected. This study compares the flavor changes of different samples during storage, such as flavor compounds and aroma compounds. Based on this study, we are planning to study following topics: 1. The content of volatile substances which affect the meat flavor in the specific mutton tissue will be analyzed. 2. The types of odor compounds in mutton during storage will be determined, and the mechanism for producing off flavor will be further speculated in the future works. 3. We will study the correlation between the compounds and sensory properties (Alim, Song, Ye et al., Citation2018). 4. We will also plan to conduct research works which include studying the involvement of taste peptides in mutton meat, isolating and purifying flavor peptides, and identifying amino acid sequences.
Author contributions
Conceptualization, Methodology, Software, Validation and Data Curation, A.A.; Writing – Original Draft Preparation, A.A.; Writing – Review & Editing, A.A. and W.H.; All authors have read and agreed to the published version of the manuscript.
Disclosure statement
No potential conflict of interest was reported by the author(s).
References
- Alim, A., Song, H., Yang, C., Ye, L., Zhou, T. T., Zhang, Y., & Zhang, S. (2019). The changes of the perception of bitter constituents in thermally treated yeast extract. Journal of the Science of Food and Agriculture, 99(10), 4651–12. https://doi.org/10.1002/jsfa.9705
- Alim, A., Song, H., & Zou, T. (2020). Analysis of meaty aroma and umami taste in thermally treated yeast extract by means of sensory-guided screening. European Food Research and Technology, 246(10), 2119–2133. https://doi.org/10.1007/s00217-020-03561-5
- Alim, A., Song, H. L., Chao, Y., Ye, L., Zhou, T. T., Zhang, S., & Raza, A. (2019). Research of beef-meaty aroma compounds from yeast extract using carbon module labeling (CAMOLA) technique. LWT - Food Science and Technology, 112, 108–239. https://doi.org/10.1016/j.lwt.2019.06.006
- Alim, A., Song, H. L. Ye, L., Zhou, T. T., & Zhang, S. (2018). Flavour-active compounds in thermally treated yeast extracts. Journal of the Science of Food and Agriculture, 98(10), 3774–3783. https://doi.org/10.1002/jsfa.8891
- Alim, A., Yang, C., Song, H. L., Yang, C., Ye, L., & Zhou, T. T. (2018). The behavior of umami components in thermally treated yeast extract. Food Research International, 120, 534–543. https://doi.org/10.1016/j.foodres.2018.11.002
- Biffin, T. E., Smith, M. A., Bush, R. D., Morris, S., & Hopkins, D. L. (2020). The effect of whole carcase medium voltage electrical stimulation, tenderstretching and longissimus infusion with actinidin on alpaca quality. Meat Science, 164(3), 108107. https://doi.org/10.1016/j.meatsci.2020.108107
- Edwards, R. A., Ordonez, J. A., Dainty, R. H., Hierro, E. M., & de la Hoz, L. (1999). Characterization of the headspace volatile compounds of selected Spanish dry fermented sausages. Food Chemistry, 64(4), 461–465. https://doi.org/10.1016/S0308-8146(98)00066-1
- Eibler, D., & Vetter, W. (2017). Enantioseparation and optical rotation of flavor-relevant 4-alkylbranched fatty acids. Journal of Chromatography A, 1505, 87–95. https://doi.org/10.1016/j.chroma.2017.05.011
- Farmer, L. J., & Patterson, R. L. S. (1991). Compounds contributing to meat flavor. Food Chemistry, 40(2), 201–205. https://doi.org/10.1016/0308-8146(91)90103-U
- Hidalgo, F. J., & Zamora, R. (2016). Amino acid degradations produced by lipid oxidation products[J]. Critical Reviews in Food Science and Nutrition, 56(5/8), 1242–1252. https://doi.org/10.1080/10408398.2012.761173
- Jahan, K., Paterson, A., & Spickett, C. M. (2010). Fatty acid composition, antioxidants and lipid oxidation in chicken breasts from different production regimes. International Journal of Food Science & Technology, 39(4), 443–453. https://doi.org/10.1111/j.1365-2621.2004.00799.x
- Kaffarnik, S., Preuß, S., & Vetter, W. (2014). Direct determination of flavor relevant and further branched-chain fatty acids from sheep subcutaneous adipose tissue by gas chromatography with mass spectrometry. Journal of Chromatography A, 1350, 92–101. https://doi.org/10.1016/j.chroma.2014.05.034
- Kim, M. A., Van, H. D., Zandstra, E. H., & Lee, H.-S. (2019). Consumer acceptance measurement focusing on a specified sensory attribute of products: Can the attribute-specified degree of satisfaction- difference (DOSD) method replace hedonic scaling. Food Quality & Preference, 75, 198–208. https://doi.org/10.1016/j.foodqual.2019.03.009
- Li, J., Tang, C., Yang, Y., Hu, Y., Zhao, Q., Ma, Q., Yue, X., Li, F., & Zhang, J. (2023). Characterization of meat quality traits, fatty acids and volatile compounds in hu and tan sheep. Frontiers in Nutrition, 10, 1072159. https://doi.org/10.3389/fnut.2023.1072159
- Li, S. B., Xiang, C., Ge, Y., Liu, H., Zhang, D., & Wang, Z. Y. (2022). Differences in eating quality and electronic sense of meat samples as a function of goat breed and postmortem rigor state. Food Research International, 152, 110923. https://doi.org/10.1016/j.foodres.2021.110923
- Liu, J., Han, L., Han, W., Gui, L., Yuan, Z., Hou, S., Wang, Z., Yang, B., Raza, S. H. A., Alowais, A. F. S., Alraddadi, A. A., & Alanazi, A. M. (2023). Effect of different heat treatments on the quality and flavor compounds of black Tibetan sheep meat by HS-GC-IMS coupled with multivariate analysis. Molecules, 28(1), 165. https://doi.org/10.3390/molecules28010165
- Monika, M. K. (2012). Effects of tomato powder on color, lipid oxidation and sensory properties of comminuted meat products. Journal of Food Quality, 35(5), 323–330. https://doi.org/10.1111/j.1745-4557.2012.00457.x
- Qi, S., Zhan, P., Tian, H., Wang, P., Ma, X., & Li, K. (2022). Effects of thyme(Thymus vulgaris L.)addition on the volatile compounds of mutton broth during boiling. Food Science and Human Wellness, 11(2), 305–315. https://doi.org/10.1016/j.fshw.2021.11.025
- Roldán, M., Ruiz, J., Pulgar, J. S. D., Pérez-Palacios, T., & Antequera, T. (2015). Volatile compound profile of sous-vide cooked lamb loins at different temperature–time combinations. Meat Science, 100, 52–57. https://doi.org/10.1016/j.meatsci.2014.09.010
- Ruiz, J., Ventanas, J., & Cava, R. (2001). New device for direct extraction of volatiles in solid samples using SPME. Journal of Agricultural and Food Chemistry, 49(11), 5115–5121. https://doi.org/10.1021/jf0101298
- Sanchez-Pena, C. M., Luna, G., Garcia-Gonzalez, D. L., & Aparicio, R. (2015). Characterization of French and Spanish dry-cured hams: Influence of the volatiles from the muscles and the subcutaneous fat quantified by SPME-GC. Meat Science, 69(4), 635–645. https://doi.org/10.1016/j.meatsci.2004.10.015
- Tao, F., Yang, W., Zhi, W. Z., Shi, Q. S., Hai, N. Z., Zhi, M. X., Lin, Y. Y., & Min, S. (2019). Purification, Identifi cation, and sensory evaluation of kokumi peptides from Agaricus bisporus mushroom. Foods, 8(2), 43. https://doi.org/10.3390/foods8020043
- Wang, Y., Song, H. L., Zhang, Y., Tang, J., & Yu, D. (2016). Determination of aroma compounds in pork broth produced by different processing methods. Flavour and Fragrance Journal, 31(4), 319–328. https://doi.org/10.1002/ffj.3320
- Yang, Y., Sun, Y., Pan, D., Wang, Y., & Cao, J. (2018). Effects of high pressure treatment on lipolysis- oxidation and volatiles of marinated pork meat in soy sauce. Meat Science, 145, 186–194. https://doi.org/10.1016/j.meatsci.2018.06.036
- Zhang, L., Mei-Hu, M. A., Shu-Guo, S., Guo-Feng, J., Mei-Juan, Y. U., & Liang, G. (2012). Effects of different heat treatments on flavor and texture characteristics of cooked yak meat. Food Science, 33(15), 148–154. https://doi.org/10.0000/Y2012/V33/I15/148
- Zhang, X., Han, L., Hou, S., Raza, S. H. A., Gui, L., Sun, S., Wang, Z., Yang, B., Yuan, Z., Simal-Gandara, J., Ahmed, M. E. S., Alswat, A., Muneefah, A. A., Mustafa, S., Samy, M. S., & Bandar, H. (2022). Metabolo mics approach reveals high energy diet improves the quality and enhances the flavor of black Tibetan sheep meat by altering the composition of rumen Microbiota. Frontiers in Nutrition, 9, 915558. https://doi.org/10.3389/fnut.2022.915558