
 ?Mathematical formulae have been encoded as MathML and are displayed in this HTML version using MathJax in order to improve their display. Uncheck the box to turn MathJax off. This feature requires Javascript. Click on a formula to zoom.
ABSTRACT
In order to develop nutritious and healthy fermented fig juice, foure samples fermented were made using natural fermentation and fermentation by lactobacillus. Then the total acidity, total sugar, reducing sugar, total phenols, total flavones and characteristic organic acids, antioxidant activity, and inhibition of enzyme activity in fermented fig juice were compared. The results showed that natural fermentation could produce more reducing sugar, lactic acid, flavonoids, and exhibit stronger DPPH radical scavenging capacity and total reducing power. Inhibition of tyrosinase and pancreatic lipase was detected in fermented fig juice, of which the inhibition rate of tyrosinase by natural fermentation was 81.80%, and the inhibition rate of pancreatic lipase by mixed cultures was 38.72%, which was higher than that of other groups. The results indicated the functional activity of fermented fig juice could be improved by fermentation, and the natural fermentation method was found superior.
1. Introduction
Fermented vegetable and fruit juices are made of one or more fresh vegetables or fruits as raw materials, through a variety of beneficial strains of long-term fermentation, containing rich enzymes, organics, probiotics, secondary metabolites and other functional components with high nutritional value. They not only provide a unique flavor and taste, but also assist the human body with a variety of health functions, such as skin whitening, delaying aging, and improving immunity (Feng et al., Citation2017; Liang et al., Citation2020). The white cabbage fermented by Leuconostoc, the total phenol content, the results of DPPH and ABTS assays increased to fourfold (Kusznierewicz et al., Citation2008). The blueberry juice fermented by Lactobacillus plantarum, the total phenol content and antioxidant activities increased, four kinds of anthocyanins were found, the activities of α-glucosidase and α-amylase were inhibited (Yu et al., Citation2021). Zhao et al. (Citation2021) proved that noni fruit enzyme has potential whitening and obesity preventive effects by studying the effect of maturity on the quality of noni fruit enzyme. Siroli et al. (Citation2015) demonstrated that inoculation of Lactobacillus plantarum strains CIT3 and V7B3 on apples and lettuce, respectively, improved product safety and shelf life. Fermented vegetable and fruit juices have gradually become a research hotspot because an enlarged interest of current markets to find new probiotics non-diary vehicles led to increased use of vegetable and fruit juices as new matrices. However, it still had a long way to understand the relationships between fermentation substrates, fermentation strains and fermentation process.
Figs belong to the mulberry fruit genus, known as the “fruit of life”, containing more than 18 types of amino acids, of which 8 types are not only essential amino acids, and also contain essential vitamins, sugars, and other nutrients, which could lower blood pressure and moisten bowel (Park et al., Citation2013). Figs are rich in nutrients, while the epidermis is easily contaminated by microorganisms, and it is extremely difficult to transport and store after picking, thus, in-situ fermentation is a superior treatment method. At present, there are few in-depth studies on application of figs in functional foods, in which fresh food or processed dried fruits, fruit pulp, preserved fruits, etc. are mainly used, and some problems are noteworthy, such as relatively low product development value and added value (Owino et al., Citation2004). From the perspective of nutrition and health benefits, figs are an excellent plant resource for the development of functional fermented fruit juices (Khadivi & Mirheidari, Citation2022). In recent years, fermented fruit juices have become the mainstream of current markets with a great potential for improving human health and providing economic prosperity. However, fermented fruit juices in China are still in the initial stage of research, as well as the lack of independent intellectual property rights. To date, fermented fig juice have been rarely reported. Processing figs into fermented fig juice with high nutritional value is conducive to the transformation and upgrading of the fig industry.
Lactic acid bacteria (LAB) fermentation is one of the oldest methods used to preserve grains and vegetables in the world. LAB may produce some substances, such as bacteriocin, extracellular polysaccharide, aromatic compounds, enzymes, B vitamins or low-calorie polyols in the fermentation process, improving food safety, nutritional quality, sensory properties or antioxidant activity (Fessard et al., Citation2017). Khezri et al. explored the applicability of the fig juice as the fermentation raw material by inoculating three types of LAB to ferment the fig juice, and found that the fig juice sample after fermentation was significantly different from the control sample in terms of taste, smell, consistency, and overall acceptability, which could provide healthy beverages for lactose allergic vegetarians and consumers (Khezri et al., Citation2016). Wijayanti et al. (Citation2017) studied the effects of LAB fermentation on the total phenolic content and antioxidant activity of fig juice, and demonstrated that LAB fermentation could improve the total phenolic content and maintain antioxidant activity, of which the antioxidant activity of fig juice fermented by Lactobacillus bulgaricus and Lactobacillus casei was significantly enhanced (Wijayant et al., Citation2017). However, the effects of different fermentation methods on the functionality of fermented products of lactic acid bacteria still need to be explored.
In the present study, fermented fig juice were prepared by natural fermentation (NF), single inoculation fermentation, and mixed inoculation fermentation, and the contents of total acidity, total sugar, reducing sugar, total phenols, total flavones and characteristic organic acids, antioxidant activity, and enzymatic inhibition abilities of three groups of fermented fig juice were compared with those of the original fig pulp as the control. Generally, the objective of this work was to investigate the functional characteristics of fig juice fermented by different fermentation methods.
2. Materials and methods
2.1. Preparation of fig pulp
Figs were purchased from local market (Kunming, China) in October 2022, which were of similar shape and size, with intact skin, no mechanical damage, no pests or diseases, and no stalks were retained. The skins of fully ripened fig were gently washed in sterile water. Before fermentation, figs were pulped with a beater (MOKUSAN, LT-02 model, Ningbo, China) for 2 min under sterile conditions, and the fig pulp was then pasteurized using a pasteurizer (NIO BIO, 1.25 kg model, Shanghai, China) for 5 min at 95°C.
2.2. Bacterial strains and cultures
Lactobacillus plantarum SZ0606 and Lactobacillus plantarum SZ0627 were obtained from the School of Biological and Food Engineering of Suzhou University (Suzhou, China). De Mann Rogosa and Sharp (MRS) broth medium (Qingdao Haibo Biotechnology Co., Ltd., Qingdao, China) was used to incubate for 18 h at 37°C, in which the number of viable bacteria could reach about 1 × 10⁸ CFU/mL for two consecutive generations, and could be used as inoculum in the fermentation process. Lactobacillus plantarum SZ0606 (LF1), Lactobacillus plantarum SZ0627 (LF2), and a mixture of Lactobacillus plantarum SZ0606 and Lactobacillus plantarum SZ0627 (1:1) (MF) were utilized as three types of starter culture, respectively.
2.3. Preparation of raw materials of fermented fig juice
Fig pulp and rock sugar were added into the sterile fermentation tanks (Myonly, NRPJP model, Qingdao, China) according to the mass ratio of 2:1 (w: w), and three types of starters were then added into three fermentation tanks, respectively, with 5% inoculation and fermented for 3 days at 37°C. The unpasteurized fig pulp and the same proportion of sugar were fermented naturally at 37°C for 70 days, which the fermentation time is derived from the previous studies on the national fermentation of figs. After fermentation, samples were centrifugated at 4000 r/min for 15 min to take the supernatant, which was then stored at −80°C. The original fig pulp (BF) was served as the control.
2.4. Determination of physical and chemical indices
2.4.1. Determination of pH and total acidity
A digital pH meter (Sartorius PB-10, Berlin, Germany) was used for pH measurement. NaOH (1 mol/L) was used to titrate the sample (5 mL) to determine the acid content.
2.4.2. Determination of organic acid content
Quantitative determination of organic acids was performed using an HPLC system (SPD-20A; Shimadzu Co., Ltd., Tokyo, Japan) (E. Z. Mousavi et al., Citation2013). The separation column was a ChromCore AQ C18 (250 × 4.6 mm, 5 μ-m). The mobile phase was 0.01 mol/L KH2PO4 (pH = 2.7). The detection wavelength was 210 nm, and the chromatographic column temperature was 20°C.
2.5. Bioactive compounds
2.5.1. Determination of content of total sugar and reducing sugar
Total sugar content was determined using the anthrone-sulfuric acid method (Graham & Smydzuk, Citation1965). Briefly, the sample dilution (1 mL) was mixed with 2 mg/mL anthrone-sulfuric acid solution (4 mL), boiled in a water bath for 10 min, and the absorbance was then measured at 620 nm using a microplate reader (Multiskan Go; Thermo Fisher Scientific, Waltham, MA, USA) after cooling. The reducing sugar content was measured using the 3,5-dinitrosalicylic acid (DNS) method(Division et al.) The sample dilution (0.5 mL) was mixed with DNS reagent (1.5 mL), boiled in a water bath for 5 min, and the absorbance was then measured at 540 nm. The results were expressed as glucose equivalent (g/L).
2.5.2. Determination of total phenolic content
Total phenolic content was measured based on the previously reported method with minor modification (Natić et al., Citation2015). Briefly, 10% (v/v) Folin-Ciocalteu’s phenol reagent (5 mL), which was purchased from Yuanye Bio-technology Co., Ltd. (Shanghai, China), was added to the sample dilution (1 mL) and placed at room temperature for 5 min. Then, 7.5 (w/v) Na2CO3 solution (4 mL) was added and vortexed for 1 h. The absorbance was measured at 765 nm using a microplate reader. The standard curve was plotted with gallic acid standard solution (10–50 mg/L), and total phenolic content was reported as gallic acid equivalent (mg/L).
2.5.3. Determination of total flavone content
Total flavone content was measured based on the colorimetric method of NaNO2-Al(NO)3-NaOH (Liu et al., Citation2020). The sample dilution (1 mL) was homogenized to 10 mL with 80% (v/v) ethanol, then, 5%(w/v) NaNO2 (0.7 mL), 10%(w/v) Al(NO)3 (0.7 mL) and 10%(w/v) NaOH (5 mL) were added in turn, respectively, mixing for 6 min. The above-mentioned mixed solution was filled with 80% (v/v) ethanol to 25 ml and kept for 15 min. The absorbance was measured at 510 nm using a microplate reader. The standard curve was plotted with rutin standard solution (0–200 mg/L), and total flavone content was reported as rutin equivalent (mg/L).
2.6. Antioxidant activity
2.6.1. Radical scavenging capacity of 2, 2-diphenyl-1-picrylhydrazyl (DPPH)
The radical scavenging capacity of DPPH was measured through the previously reported method with some modifications (Gao et al., Citation2022). For this purpose, 0.2 mM DPPH (Yuanye Bio-technology Co., Ltd.) was prepared with ethyl alcohol. After that, 3 mL DPPH and 1 mL sample or absolute ethyl alcohol (control) were mixed and incubated at 37°C for 30 min. Subsequently, the absorbance was measured at 517 nm using a microplate reader. The scavenging capacity was calculated as follows:
where A0 is the absorbance of the mixed solution of absolute ethanol and DPPH, A1 is the absorbance of the mixed solution of sample and DPPH, and A2 is the absorbance of the mixed solution of sample and absolute ethanol.
2.6.2. Hydroxyl radical scavenging capacity
Hydroxyl radical scavenging capacity was measured through Zheng et al.’s method with some modifications (Citation2021). The reaction mixture in the sample group was consisted of 1 mL of sample, 1.4 mL of 6 mM H2O2, 0.6 mL of 20 mM sodium salicylate, and 2 mL of 1.5 mM FeSO2, which were purchased from China Pharmaceutical Group Limited (Beijing, China). The sample was replaced with 1 mL of distilled water in the blank group. In addition, 6 mM H2O2 was replaced with 1.4 mL of distilled water in the background group. Then, the mixture was incubated at 37°C for 1 h. Finally, the absorbance was measured at 562 nm using a microplate reader. The scavenging capacity was calculated as follows:
where A0 represents the absorbance value in the blank group, A1 represents the absorbance value in the sample group, and A2 represents the absorbance value in the background group.
2.6.3. Radical scavenging capacity of 2,2’-azino-bis(3-ethylbenzothiazoline-6-sulfonic acid (ABTS)
The radical scavenging capacity of ABTS was measured using method with some modifications (Tahir et al., Citation2022). For this purpose, 7.4 mM ABTS solution and 2.6 mM K2S2O8 were mixed in equal proportions, which were purchased from Yuanye Bio-technology Co., Ltd., and placed at room temperature for 12 h under dark condition. Afterward, the above-mentioned mixture was diluted to A734nm = 0.7 ± 0.02 using distilled water, which was ABTS reaction mixture. The ABTS reaction mixture (2 mL) and sample (1 mL) or distilled water (control) were mixed, and the absorbance of the mixture was then measured at 734 nm after incubation at room temperature for 20 min. The radical scavenging capacity of ABTS was calculated as follows:
where A0 represents the absorbance value in the control group, and A1 represents the absorbance value in the sample group.
2.6.4. Total reduction force
The total reduction force was measured according to Kwaw et al.’s method (Citation2018) that was slightly modified. For this purpose, 1 mL of sample was mixed with 2.5 mL of phosphate-buffered saline (PBS) (0.2 mmol/l, pH = 6.6) and 2.5 mL of 1% (w/v) potassium ferricyanide (China Pharmaceutical Group Limited), reacted at 50°C for 20 min, and 2.5 mL of 10% (w/v) trichloroacetic acid (China Pharmaceutical Group Limited) was then added in order to terminate the reaction. After that, 2.5 mL of the reaction termination solution was mixed with 2.5 mL of distilled water and 0.5 mL of 0.1% (w/v) ferric chloride (China Pharmaceutical Group Limited), and reacted for 10 min. The absorbance was measured at 700 nm. The standard curve was plotted with ascorbic acid standard solution (0–140 mg/L), and total reduction force was reported as ascorbic acid equivalent (mg/L).
2.7. Enzymatic inhibition
2.7.1. Tyrosinase inhibition assay
The tyrosinase inhibition was measured using the previously described method with minor modification (Murata et al., Citation2022). A0 means a mixture of 0.75 mL PBS (0.02 M, pH = 6.8), 0.4 mL of 0.1% L-tyrosine and 0.25 mL of 200 µg/ml Tyrosinase. A1 means a mixture of 1.00 mL PBS and 0.4 mL L-tyrosine. A2 means a mixture of 0.35 mL PBS, 0.4 mL sample, 0.4 mL L-tyrosine and 0.25 mL Tyrosinase. A3 means a mixture of 0.60 mL PBS, 0.4 mL sample and 0.4 mL L-tyrosine. Above mixtures reacted at 37°C for 20 min, and the absorbance was measured at 475 nm. The inhibition rate of the sample on tyrosinase was calculated as follows:
2.7.2. The α-amylase inhibition assay
The α-amylase inhibition activity was measured via the previously described method with minor modification (Mccue et al., Citation2005). Firstly, 0.5 mL of 6.5 U/ml α-amylase and 0.5 mL sample were mixed and reacted at 37°C for 10 min, and 0.5 mL of 1% soluble starch was then added as the reaction substrate, reacting at 37°C for 10 min. Afterward, 0.5 mL DNS was added to terminate the reaction. After 5 min of boiling in a water bath, the absorbance was measured at 540 nm. The inhibition rate of the sample on amylase was calculated as follows:
where the A0 means a mixture of 0.5 mL α-amylase, 0.5 mL PBS (0.02 mol/L, pH 6.9), 0.5 mL soluble starch and 0.5 mL DNS. The A1 means a mixture of 1.0 mL PBS, 0.5 mL soluble starch and 0.5 mL DNS. The A3 means a mixture of 0.5 mL sample, 0.5 mL PBS, 0.5 mL soluble starch and 0.5 mL DNS.
2.7.3. Pancreatic lipase inhibition assay
The pancreatic lipase activity was measured according to Taha et al.’s method with some modifications (Taha et al., Citation2008). A mixture of 30 μl Tris-HCl (0.25 mol/L, pH 8.0), 50 μl of 15 U/ml pancreatic lipase and 20 μl sample was incubated at 37°C for 15 min, then, 100 μl of 10 mmol/L 4-nitrophenylbutyrate (p-NPB) was added as a substrate to react at 37°C for 15 min. The absorbance was measured at 405 nm. The inhibition rate of the sample on pancreatic lipase was calculated as follows:
where the A0 means a mixture of 50 μl Tris-HCl, 50 μl pancreatic lipase and 100 μl p-NPB. The A1 means a mixture of 100 μl Tris-HCl and 100 μl p-NPB. The A3 means a mixture of 80 μl Tris-HCl, 20 μl sample and 100 μl p-NPB.
2.8. Statistical analysis
All experiments were performed in triplicate. Differences between the variables were tested by analysis of variance (one-way ANOVA). Duncan and LSD tests were applied to determine significant differences (P < .05) and Pearson’ s correlation coefficient using the software SPSS 23, which p < .05 indicates a significant correlation between the two variables, and p < .01 indicates a very significant correlation between the two variables.
3. Results and discussion
3.1. The acidity and pH of fermented fig juice
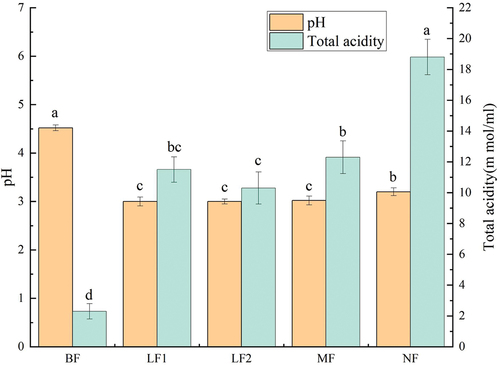
The pH value can reflect the abnormal situation in the fermentation process, and the total acidity content also indicates the metabolic changes of microorganisms in the fermentation process (Hur et al., Citation2014). The acidity and pH of fermented fig juice are shown in . The pH values of LF1, LF2, MF, and NF were significantly reduced (p < .05) after fermentation of fig pulp, and pH values in different fermentation groups were lower than 3.5. Muyanja et al. (Citation2003) showed that pH value in the early stage of fermentation decreased to below 4.0 to make Escherichia coli and its bacterial community disappeared, indicating that a low pH value could inhibit the growth of pathogenic and putrefactive microorganisms, ensuring the quality of fermentation products. The decrease of pH value during fermentation is mainly attributed to the dissolution and formation of a large amount of acidic substances (i.e. a large amount of lactic acid is produced during LAB fermentation) (Resende Oliveira et al., Citation2018). The total acidity of fig pulp after fermentation was significantly elevated (p < .05). The total acidity in NF significantly increased from 2.3 ± 0.5 to 18.8 ± 1.15 mmol/100 ml, indication an elevation for 8.17 times. These results are consistent with those reported by Chakravorty et al. (Citation2016). and Velićanski et al. (Citation2014), which may be because acid substances in the NF system are not excessively consumed by some probiotics as alternative carbon sources.
Figure 1. Effects of fermentation on pH value and total acidity content.
3.2. Contents of organic acids
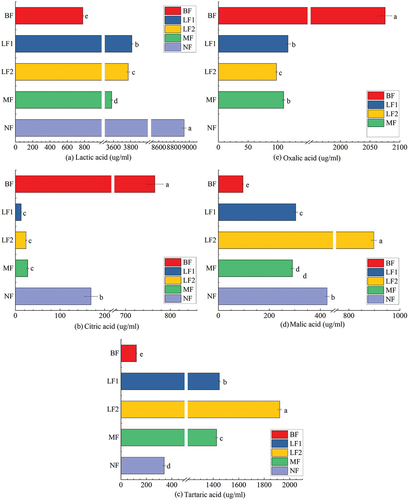
Due to the growth and metabolism of microorganisms, a large amount of acidic substances were produced after fermentation, which led to a decrease in pH value and a significant increase in total acidity content. Therefore, the compositions of organic acids in the system before and after fermentation of fig pulp were further analyzed and determined. As shown in , except for oxalic acid that was not detected in NF, lactic acid, citric acid, malic acid, tartaric acid, and oxalic acid were detected in LF1, LF2, and MF. The contents of organic acids in BF from high to low were oxalic acid (2075.32 ± 11.27) >lactic acid (783.07 ± 6.10) >citric acid (765.71 ± 18.82) >tartaric acid (122.00 ± 4.03) >malic acid (96.40 ± 1.10). The contents of organic acids in NF from high to low were lactic acid (8932.60 ± 22.57) >malic acid (426.97 ± 7.73) >tartaric acid (340.10 ± 9.00) >gcitric acid (169.47 ± 14.41). The contents of organic acids in LF1, LF2, and MF from high to low were lactic acid (3814.41 ± 13.13; 3771.96 ± 17.44; 3579.74 ± 11.98) >tartaric acid (1448.51 ± 6.85; 1921.79 ± 11.48; 1426.26 ± 5.94) >malic acid (304.38 ± 5.43; 898.30 ± 9.50; 290.73 ± 5.53) >oxalic acid (117.17 ± 3.59; 97.82 ± 1.10; 109.96 ± 1.94) >citric acid (12.92 ± 0.31; 24.03 ± 1.77; 27.73 ± 2.55). As the main fermented product of lactic acid bacteria, lactic acid accounted for the largest proportion of organic acids in fig pulp after fermentation, and the content in each group significantly increased after fermentation (p < .05), of which the NF content more significantly increased from 783.07 ± 6.10 µg/ml before fermentation to 8932.60 ± 22.57 µg/ml after fermentation, indication an elevation for 11.41 ± 0.08 times. The lactic acid content of LF1, LF2, and MF was 4.87 ± 0.03, 4.82 ± 0.03, and 4.57 ± 0.04 times of the original fruit pulp, respectively. The contents of tartaric acid and malic acid also significantly increased (p < .05). Malic acid can be accumulated through the reduction of oxaloacetic acid and oxidation of fumaric acid (Suto & Kawashima, Citation2022). Tartaric acid is generally not metabolized because of its strong acidity, and the decrease of pH value may cause dissolution of tartrate, leading to the increase of tartaric acid content (Radin et al., Citation1994). Oxalic acid accounted for the largest proportion in raw fruit pulp, while oxalic acid content significantly decreased after fermentation (p < .05), and oxalic acid was not detected in the NF group. Citric acid also showed a similar change, accounting for 19.93 ± 0.39% of the original pulp, and citric acid content in each group significantly decreased after fermentation (p < .05). Because citric acid and oxalic acid both participate in the cyclic metabolism of tricarboxylic acid, they are not easy to accumulate, which can be used by LAB to produce lactic acid and other products in the fermentation process, resulting in a high lactic acid content (S. Y. Lee et al., Citation2014). Similar behavior of fermented sweet lemon juice using Lactobacillus plantarum was reported previously, which lactic acid increased while citric acid decreased throughout the fermentation (Hashemi et al., Citation2017).
Figure 2. The effects of fermentation on lactic acid (a), citric acid (b), tartaric acid (c), malic acid (d), oxalic acid (e) of fermented fig juice.
3.3. Contents of total sugar and reducing sugar
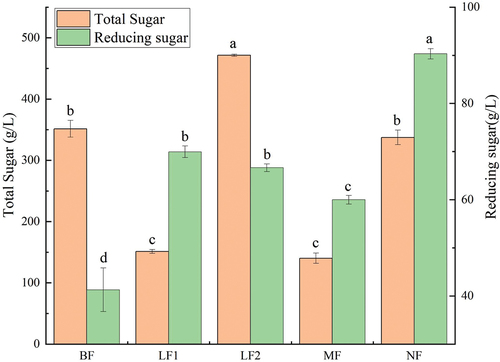
The contents of total sugar and reducing sugar before and after fig fermentation are shown in . The total sugar contents of LF1, MF, and NF were lower than raw fruit pulp, of which the total sugar contents of LF1 and MF were significantly lower (p < .05), which were 0.43 ± 0.01 and 0.40 ± 0.02 times of that of raw fruit pulp, respectively. However, the total sugar content of LF2 significantly increased (p < .05), which was 1.34 ± 0.05 times that of the original fruit pulp. The reducing sugar content in each group significantly increased after fermentation, and reducing sugar content in NF increased by 2.19 ± 0.25 times from 41.30 ± 4.53 g/L before fermentation to 90.32 ± 1.07 g/L after fermentation. The decrease of total sugar content and the increase of reducing sugar content could be related to the enzymatic hydrolysis of microorganisms during fermentation. Enzymatic hydrolysis could degrade macromolecular substances into small molecules, such as low-molecular-weight sugar (Sharma et al., Citation2017). Lao et al. (Citation2020)found that the enzymatic hydrolysis of cellulase and pectinase significantly increased reducing sugar content in Cordyceps sinensis beverage. The slight decrease of total sugar content in the NF group may be due to the complexity of the microbial community in the system. Although the growth and reproduction of microorganisms may cause consuming sugar substances, the microbial decomposition of figs may generate sugar containing metabolites, leading to no significant reduction in total sugar content of fermented fig juice. The total sugar content of LF2 increased, which could be related to the production of a large number of extracellular polysaccharides in the fermentation process of lactic acid bacteria (Lynch et al., Citation2018). Fermentation of sugars by microorganisms could be correlated to the strain, fermentation time and substrate. For instance, Mousavi (Z. E. Mousavi et al., Citation2011) reported that glucose and fructose could be considered as suitable energy and carbon sources for Lactobacillus strains. During the fermentation of the noni juice, sugar metabolism was characterized by the assimilation of glucose, but the fermented noni juice retained the sugars when acidification started (Wang et al., Citation2009).
Figure 3. Effects of fermentation on total sugar and reducing sugar contents.
3.4. Total phenolic content
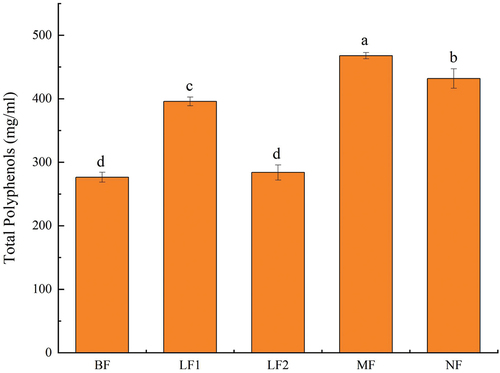
Phenolic substances are important active ingredients in plants. As free radical scavengers, they have significant benefits for human health (Daliri et al., Citation2019). As shown in , except for LF2, the total phenolic contents of LF1, MF, and NF were 1.43 ± 0.06, 1.69 ± 0.04, and 1.56 ± 0.01 times higher than the original pulp, respectively (p < .05). MF and NF were at higher levels, indicating that the complex bacteria group was more conducive to the production and accumulation of polyphenols during fermentation. This result was similar with previous researches. The phenolic compounds content was investigated during fermentation of cherry juice and broccoli puree by L. plantarum strain, and these two fermented products possesses more phenolic compounds than before fermentation (Filannino et al., Citation2015). However, some surveys yielded to the opposite results of this study. Liao et al. (Citation2016) invented that content of total phenolics in mango juice was decreased signiffcantly after fermented by L. brevis MPL39. During fermentation, various changes of phenolic substances could be attributed to the depolymerization and degradation of macromolecular polyphenols and microbial metabolism (DiCagno et al., Citation2013). Y. G. Lee et al. (Citation2016). found that in plants, some polyphenols mainly form chemical bonds with polysaccharides, which are closely bound. However, fermentation may destroy plant cell wall and release glycosidase or hydrolase, which may hydrolyze the conjugate into a free and soluble form, leading to an increase in the total phenolic content. The carbon source in the system may be exhausted when the fermentation time is extremely long, thus, the microorganism may decompose and utilize polyphenols in this case, resulting in a decrease in the content (Septembre-Malaterre et al., Citation2018). As the fermentation time of NF (70 d) was remarkably longer than that of MF (3 d), the polyphenols in the NF group were likely to be decomposed and utilized, which might justify why total phenolic content of NF was lower than that of MF. These findings suggested that the change of total phenolic content could be caused by the dissolution of phenols in raw materials, consumption and production of microbial growth and metabolism, or the mutual transformation of phenols.
Figure 4. Effects of fermentation on total phenolic content.
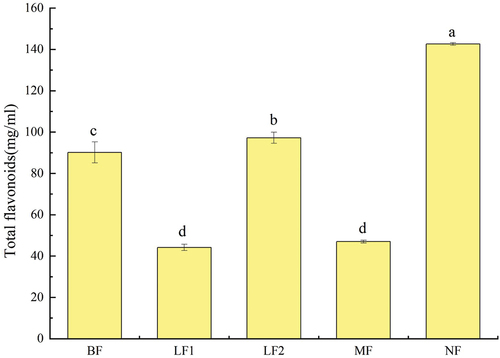
3.5. Total flavone content
Flavonoids have exhibited great antioxidant, anti-inflammatory, and immunity-enhancing capabilities (Terahara, Citation2015). As illustrated in , the flavone contents of LF1 and MF significantly decreased (p < .05), which were 0.49 ± 0.01 and 0.52 ± 0.02 times higher than that of 90.16 ± 5.08 of the original pulp, respectively. However, the flavonoid contents of LF2 and NF increased as 1.08 ± 0.03 and 1.58 ± 0.10 times of original pulp, respectively, and that of NF was significantly higher than that of original pulp (p < .05). The increase of flavonoid content during fermentation could be related to β-glucosidase, because glucosidase could release insoluble dietary flavonoids into water-soluble flavonoid glycosides to increase the total flavonoid content (Vinusha et al., Citation2018). Microbes can also metabolize phenolic compounds through the enzymatic reaction of dehydrogenase, reductase, decarboxylase, and esterase, and convert them into flavonoids with additional biological value (Multari et al., Citation2020). The total phenolic content measured in the present study supported this speculation. Similar behavior of fermented blueberry juice by Lactobacillus plantarum was reported previously, which the content of flavone was increased from 45.93 ± 1.35 mg/L to 52.12 ± 0.66 mg/L after fermentation (Yu et al., Citation2021). However, some surveys yielded to the different results of this study. There was no change in total flavone content between vegetable and fermented vegetable juices containing germinated seeds and sprouts of lentil and cowpea (Simsek et al., Citation2014). Tkacz et al. (Citation2020) studied the changes of flavonoid substances during the fermentation of sea buckthorn juice by LAB, and found that the total flavone content in the fermentation of sea buckthorn juice by Lactobacillus plantarum DSM 100,813 and DSM 10,492 decreased by 8.3 ± 1.50% and 10.3 ± 1.31%, respectively. It can be inferred that the strain and substrate may determine the difference in total flavonoid content. In the present study, the different total flavonoid contents in different fermentation groups could be attributed to the specificity of microorganisms in the fermentation system for flavonoids.
Figure 5. Effects of fermentation on the total flavone content.
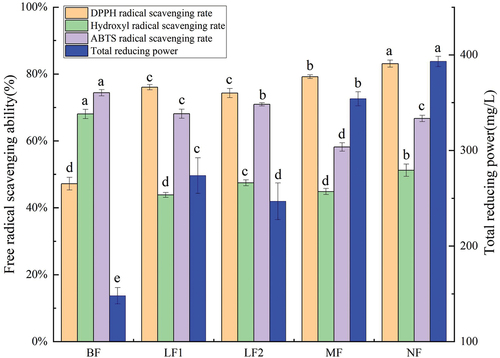
3.6. Antioxidant activity
The radical scavenging capacities of DPPH, hydroxyl, and ABTS, as well as total reduction force were investigated before and after fermentation. As illustrated in , DPPH radical scavenging capacity and total reducing power in each group were significantly improved by fermentation (p < .05). The levels of DPPH radical scavenging capacity and reducing power of NF reached the peak, in which DPPH radical scavenging capacity increased from 47.22 ± 2.01% to 83.10 ± 1.21%, and total reducing power was elevated from 148.05 ± 8.50 to 393.17 ± 5.33 mg/L, which were 1.76 ± 0.05 and 2.66 ± 0.17 times higher than those before fermentation, respectively. However, the ABTS free-radical scavenging rate and the hydroxyl radical scavenging rate in each group were significantly reduced after fermentation (p < .05), especially in MF. The ABTS free-radical scavenging rate decreased from 74.40 ± 0.93% before fermentation to 58.17 ± 1.26% after fermentation, and the hydroxyl radical scavenging rate was reduced from 68.06 ± 1.38% before fermentation to 44.86 ± 0.91% after fermentation.
Figure 6. Effects of fermentation on antioxidant activity.
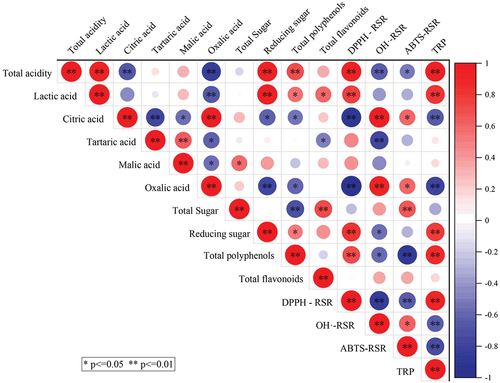
The correlation between physicochemical indices and active substances of fig pulp and antioxidant capacity was analyzed (). The contents of total acidity, lactic acid, reducing sugar, and total polyphenol showed a very significantly positive correlation with DPPH radical scavenging rate and total reducing power (p < .01). The reducing sugar of fig pulp may contain polysaccharides with antioxidant capacity, which may regulate the expression levels of downstream antioxidant enzymes, and further block free radical-chain reaction, thereby reducing the production of free radicals and alleviating oxidative stress damage (Mu et al., Citation2021). The clearance rates of ABTS free-radical and hydroxyl radical showed a significantly positive correlation with the contents of citric acid and oxalic acid (p < .05). Citric acid can not only provide sour taste but also enhance antioxidant and anti-corrosion activities and improve the stability of food (Tong et al., Citation2021). Aryal et al. (Citation2019) demonstrated that the DPPH clearance rate had a strong correlation with the total phenolic and flavonoid contents. S. Zhang et al. (Citation2020) found that the total phenolic content in the fermentation broth of rose and wild jujube kernel fermented with Kombucha SCOBY had a strong correlation with the reduction ability (R = 0.929), which was similar to the results of the present study.
Figure 7. Thermograph of correlations among physicochemical indices, active substances, and antioxidant capacity DPPH-RSR indicates DPPH radial scavenging rate; OH·-RSR represents hydrogen radial scavenging rate; ABTS-RSR indicates ABTS radial scavenging rate; TRP represents total reducing power. ”*‘ indicates a significant correlation (p < .05), ’**” represents a very significantly positive correlation (p < .01).
3.7. Enzymatic inhibitory capability
Tyrosinase is an important biological enzyme with the dual catalytic function in the human body, playing a key role in the formation of melanin in the human body (Yang et al., Citation2021). As shown in , the activity of tyrosinase was inhibited before fermentation, and the inhibition rate was 34.87 ± 0.65%. After fermentation, the inhibition rates of tyrosinase in LF1, MF, and NF were 35.96 ± 0.49%, 60.08 ± 0.52%, and 81.80 ± 0.29%, respectively. The inhibition of tyrosinase significantly increased (p < .05). The NF showed a higher tyrosinase inhibitory capability, indicating that the rich microbial community fermentation could improve the inhibitory capacity of fig pulp on tyrosinase. A previous study indicated that polyphenols would be the most common tyrosinase inhibitors with low side effects (Zolghadri et al., Citation2019). Thörneby et al. also found that flavonoids could also have tyrosinase inhibitory capability due to their phenolic hydroxyl groups (Thörneby-Andersson et al., Citation2000).
Figure 8. The inhibitory effects of fermentation on the enzymatic activity.
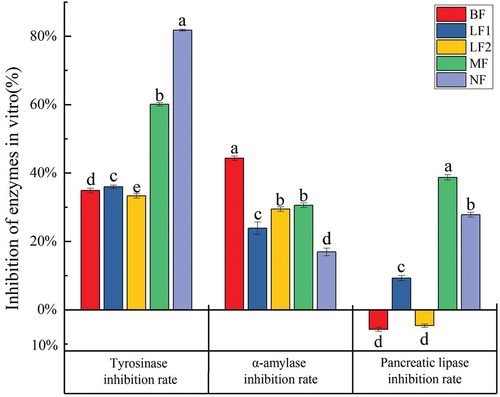
α-amylase was reported as an important hydrolase that could metabolize carbohydrates and regulate the blood sugar level in the human body. Therefore, α-amylase could play an important role in regulating metabolic diseases (Y. Zhang et al., Citation2021). As illustrated in , the inhibition rate of α-amylase in BF was 44.33 ± 0.59%, which was higher than that of acarbose (35.38 ± 1.56%) in positive control group. After fermentation, the inhibition rates of α-amylase in LF1, LF2, MF, and NF were 23.85 ± 1.81%, 29.44 ± 0.65%, 30.59 ± 0.64%, and 16.92 ± 1.11%, respectively, indicating that the ability of α-amylase in reducing blood sugar level was not be increased after fermentation.
Pancreatic lipase is an important hydrolase, which could hydrolyze fat in the human body. Therefore, inhibition of pancreatic lipase may reduce weight, attenuate hyperlipidemia, and prevent obesity-related diseases (Tiss et al., Citation2020). As displayed in , the inhibition rates of pancreatic lipase in LF1, MF, and NF were 9.29 ± 0.76%, 38.72 ± 0.78%, and 27.79 ± 1.68% respectively. The MF exhibited to have the greatest inhibitory capability to pancreatic lipase. However, the activity of pancreatic lipase was promoted in BF and LF2. The results were attributed to the increase of functional substances, such as phenolic in LF1, MF, and NF. A previous study demonstrated that phenol compounds are the most studied pancreatic lipase inhibitors, in which saponins, terpenoids, and phenols are all active components inhibiting pancreatic lipase. Gondoin et al. found that green tea, white tea, and black tea polyphenols all could inhibit pancreatic lipase activity (Gondoin et al., Citation2010). It was shown that the inhibition rate of tea polyphenols on α-amylase and pancreatic lipase reached 61% and 54%, respectively (He et al., Citation2006).
4. Conclusions
In order to comprehend functional characteristics of fermented fig juice by fermentation, NF and fermentation of lactic acid bacteria were selected as fermentation methods. Acidity was reduced in all fermentation groups, and a large amount of lactic acid was produced. The comparison of chemical composition showed that NF could produce more reducing sugar, lactic acid, and flavonoids. The scavenging abilities of DPPH radical and total reducing power were significantly enhanced in NF. Finally, the inhibition rates of tyrosinase and pancreatic lipase were both elevated in MF and NF. Mixed strains and NF produced more functional substances and beneficial activities than single strain fermentation; thus, further optimization of fermentation strains and fermentation process is subsequently essential. In summary, the nutritional properties of figs can be effectively improved by fermentation, leading to develop a functional fruit enzyme, in which the lactic acid bacteria can be combined with figs.
Author contributions
Peilin Yao and Suyuan Zhao carried out the studies, participated in collecting data, and drafted the manuscript. Lulu Cheng performed the statistical analysis and participated in its design. Chuanping Zhao participated in acquisition, analysis, or interpretation of data and draft the manuscript. All authors read and approved the final manuscript.
Disclosure statement
No potential conflict of interest was reported by the author(s).
Data availability statement
All data generated or analysed during this study are included in this published article.
Additional information
Funding
References
- Aryal, S., Baniya, M. K., Danekhu, K., Kunwar, P., Gurung, R., & Koirala, N. (2019). Total phenolic content, flavonoid content and antioxidant potential of wild vegetables from Western Nepal. Plants (Basel), 8(4), 96. https://doi.org/10.3390/plants8040096
- Chakravorty, S., Bhattacharya, S., Chatzinotas, A., Chakraborty, W., Bhattacharya, D., & Gachhui, R. (2016). Kombucha tea fermentation: Microbial and biochemical dynamics. International Journal of Food Microbiology, 220, 63–12. https://doi.org/10.1016/j.ijfoodmicro.2015.12.015
- Daliri, E. B., Kim, S. H., Park, B. J., Kim, H. S., Kim, J. M., Kim, H. S., & Oh, D. H. (2019). Effects of different processing methods on the antioxidant and immune stimulating abilities of garlic. Food Science & Nutrition, 7(4), 1222–1229. https://doi.org/10.1002/fsn3.942
- DiCagno, R., Coda, R., De Angelis, M., & Gobbetti, M. (2013). Exploitation of vegetables and fruits through lactic acid fermentation. Food Microbiology, 33(1), 1–10. https://doi.org/10.1016/j.fm.2012.09.003
- Division, P. R., Research, Q., Center, E., Natick, & Mass. (1959). Use of dinitrosaIicyIic acid reagent for determination of reducing sugar. Analytical Chemistry, 31(3), 426–428. https://doi.org/10.1021/ac60147a030
- Feng, Y., Zhang, M., Mujumdar, A. S., & Gao, Z. (2017). Recent research process of fermented plant extract: A review. Trends in Food Science & Technology, 65, 40–48. https://doi.org/10.1016/j.tifs.2017.04.006
- Fessard, A., Kapoor, A., Patche, J., Assemat, S., Hoarau, M., Bourdon, E., Bahorun, T., & Remize, F. (2017). Lactic fermentation as an efficient tool to enhance the antioxidant activity of tropical fruit juices and teas. Microorganisms [Internet], 5(2), 23. https://doi.org/10.3390/microorganisms5020023
- Filannino, P., Bai, Y., DiCagno, R., Gobbetti, M., & Gänzle, M. G. (2015). Metabolism of phenolic compounds by lactobacillus spp. during fermentation of cherry juice and broccoli puree. Food Microbiology, 46, 272–279. https://doi.org/10.1016/j.fm.2014.08.018
- Gao, Q., Song, Y., Liang, Y., Li, Y., Chang, Y., Ma, R., Cao, X., & Wang, S. (2022). Dynamics of physicochemical properties, functional compounds and antioxidant capacity during spontaneous fermentation of lycium ruthenicum Murr. (Qinghai–tibet plateau) natural vinegar. Foods, 11(9), 1344. https://doi.org/10.3390/foods11091344
- Gondoin, A., Grussu, D., Stewart, D., & McDougall, G. J. (2010). White and green tea polyphenols inhibit pancreatic lipase in vitro. Food Research International, 43(5), 1537–1544. https://doi.org/10.1016/j.foodres.2010.04.029
- Graham, D., & Smydzuk, J. (1965). Use of anthrone in the quantitative determination of hexose phosphates. Analytical Biochemistry, 11(2), 246–255. https://doi.org/10.1016/0003-2697(65)90012-6
- Hashemi, S. M. B., Khaneghah, A. M., Barba, F. J., Nemati, Z., Sohrabi Shokofti, S., & Alizadeh, F. (2017). Fermented sweet lemon juice (citrus limetta) using lactobacillus plantarum LS5: Chemical composition, antioxidant and antibacterial activities. Journal of Functional Foods, 38, 409–414. https://doi.org/10.1016/j.jff.2017.09.040
- He, Q., Lv, Y., & Yao, K. (2006). Effects of tea polyphenols on the activities of α-amylase, pepsin, trypsin and lipase. Food Chemistry, 101(3), 1178–1182. https://doi.org/10.1016/j.foodchem.2006.03.020
- Hur, S. J., Lee, S. Y., Kim, Y. C., Choi, I., & Kim, G. B. (2014). Effect of fermentation on the antioxidant activity in plant-based foods. Food Chemistry, 160, 346–356. https://doi.org/10.1016/j.foodchem.2014.03.112
- Khadivi, A., & Mirheidari, F. (2022). Selection of the promising fig (Ficus carica L.) accessions using fruit-related characters. Food Science & Nutrition, 10(9), 2911–2921. https://doi.org/10.1002/fsn3.2886
- Khezri, S., Dehghan, P., Mahmoudi, R., & Jafarlou, M. (2016). Fig juice fermented with lactic acid bacteria as a nutraceutical product. Pharmaceutical Sciences, 22(4), 260–266. https://doi.org/10.15171/PS.2016.40
- Kusznierewicz, B., Śmiechowska, A., Bartoszek, A., & Namieśnik, J. (2008). The effect of heating and fermenting on antioxidant properties of white cabbage. Food Chemistry, 108(3), 853–861. https://doi.org/10.1016/j.foodchem.2007.11.049
- Kwaw, E., Ma, Y., Tchabo, W., Apaliya, M. T., Wu, M., Sackey, A. S., Xiao, L., & Tahir, H. E. (2018). Effect of lactobacillus strains on phenolic profile, color attributes and antioxidant activities of lactic-acid-fermented mulberry juice. Food Chemistry, 250, 148–154. https://doi.org/10.1016/j.foodchem.2018.01.009
- Lao, Y., Zhang, M., Li, Z., & Bhandari, B. (2020). A novel combination of enzymatic hydrolysis and fermentation: Effects on the flavor and nutritional quality of fermented cordyceps militaris beverage. LWT, 120, 108934. https://doi.org/10.1016/j.lwt.2019.108934
- Lee, Y. G., Cho, J. Y., Kim, Y. M., & Moon, J. H. (2016). Change in flavonoid composition and antioxidative activity during fermentation of onion (Allium cepa L.) by Leuconostoc mesenteroides with different salt concentrations. Journal of Food Science, 81(6), C1385–1393. https://doi.org/10.1111/1750-3841.13329
- Lee, S. Y., Lee, S., Lee, S., Oh, J. Y., Jeon, E. J., Ryu, H. S., & Lee, C. H. (2014). Primary and secondary metabolite profiling of doenjang, a fermented soybean paste during industrial processing. Food Chemistry, 165, 157–166. https://doi.org/10.1016/j.foodchem.2014.05.089
- Liang, H., Liu, J., & Shi, H. (2020). Research progress of edible plant enzymes. The Food Industry, 41(7), 193–197.
- Liao, X. Y., Guo, L. Q., Ye, Z. W., Qiu, L. Y., Gu, F. W., & Lin, J. F. (2016). Use of autochthonous lactic acid bacteria starters to ferment mango juice for promoting its probiotic roles. Preparative Biochemistry & Biotechnology, 46(4), 399–405. https://doi.org/10.1080/10826068.2015.1045615
- Liu, N., Song, M., Wang, N., Wang, Y., Wang, R., An, X., Qi, J., & Šiler, B. T. (2020). The effects of solid-state fermentation on the content, composition and in vitro antioxidant activity of flavonoids from dandelion. Public Library of Science One, 15(9), e0239076. https://doi.org/10.1371/journal.pone.0239076
- Lynch, K. M., Zannini, E., Coffey, A., & Arendt, E. K. (2018). Lactic acid bacteria exopolysaccharides in foods and beverages: Isolation, properties, characterization, and health benefits. Annual Review of Food Science and Technology, 9(1), 155–176. https://doi.org/10.1146/annurev-food-030117-012537
- Mccue, P., Kwon, Y.-I., & Shetty, K. (2005). Anti-amylase, anti-glucosidase and anti-angiotensin iconverting enzyme potential of selected foods. Journal of Food Biochemistry, 29(3), 278–294. https://doi.org/10.1111/j.1745-4514.2005.00020.x
- Mousavi, Z. E., Mousavi, S. M., Razavi, S. H., Emam-Djomeh, Z., & Kiani, H. (2011). Fermentation of pomegranate juice by probiotic lactic acid bacteria. World Journal of Microbiology and Biotechnology, 27(1), 123–128. https://doi.org/10.1007/s11274-010-0436-1
- Mousavi, E. Z., Mousavi, S. M., Razavi, S. H., Hadinejad, M., Emam-Djomeh, Z., & Mirzapour, M. (2013). Effect of fermentation of pomegranate juice by lactobacillus plantarum and Lactobacillus acidophilus on the antioxidant activity and metabolism of sugars, organic acids and phenolic compounds. Food Biotechnology, 27(1), 1–13. https://doi.org/10.1080/08905436.2012.724037
- Multari, S., Carafa, I., Barp, L., Caruso, M., Licciardello, C., Larcher, R., Tuohy, K., & Martens, S. (2020). Effects of lactobacillus spp. On the phytochemical composition of juices from two varieties of Citrus sinensis L. Osbeck: ‘Tarocco’ and ‘Washington navel’. LWT, 125, 109205. https://doi.org/10.1016/j.lwt.2020.109205
- Murata, K., Suzuki, S., Miyamoto, A., Horimoto, M., Nanko, S., Mori, D., Kanamaru, H., & Endo, Y. (2022). Tyrosinase inhibitory activity of extracts from Prunus persica. Separations, 9(5), 107. https://doi.org/10.3390/separations9050107
- Mu, S., Yang, W., & Huang, G. (2021). Antioxidant activities and mechanisms of polysaccharides. Chemical Biology & Drug Design, 97(3), 628–632. https://doi.org/10.1111/cbdd.13798
- Muyanja, C. M., Narvhus, J. A., Treimo, J., & Langsrud, T. (2003). Isolation, characterisation and identification of lactic acid bacteria from bushera: A ugandan traditional fermented beverage. International Journal of Food Microbiology, 80(3), 201–210. https://doi.org/10.1016/s0168-1605(02)00148-4
- Natić, M. M., Dabić, D., Papetti, A., Fotirić Akšić, M. M., Ognjanov, V., Ljubojević, M., & Tešić, Ž. (2015). Analysis and characterisation of phytochemicals in mulberry (Morus alba L.) fruits grown in Vojvodina, North Serbia. Food Chemistry, 171, 128–136. https://doi.org/10.1016/j.foodchem.2014.08.101
- Owino, W. O., Nakano, R., Kubo, Y., & Inaba, A. (2004). Alterations in cell wall polysaccharides during ripening in distinctanatomical tissue regions of the fig (Ficus carica L.) fruit. Postharvest Biology and Technology, 32(1), 67–77. https://doi.org/10.1016/j.postharvbio.2003.10.003
- Park, S., Han, J., Im, K., Whang, W. K., & Min, H. (2013). Antioxidative and anti-inflammatory activities of an ethanol extract from fig (ficus carica) branches. Food Science & Biotechnology, 22(4), 1071–1075. https://doi.org/10.1007/s10068-013-0185-7
- Radin, L., Pronzato, C., Casareto, L., & Calegari, L. (1994). Tartaric acid in wines may be useful for preventing renal calculi: Rapid determination by HPLC. Journal of Liquid Chromatography, 17(10), 2231–2246. https://doi.org/10.1080/10826079408013543
- Resende Oliveira, É., Caliari, M., Soares Soares Júnior, M., Ribeiro Oliveira, A., Cristina Marques Duarte, R., & Valério de Barros Vilas Boas, E. (2018). Assessment of chemical and sensory quality of sugarcane alcoholic fermented beverage. Journal of Food Science and Technology, 55(1), 72–81. https://doi.org/10.1007/s13197-017-2792-4
- Septembre-Malaterre, A., Remize, F., & Poucheret, P. (2018). Fruits and vegetables, as a source of nutritional compounds and phytochemicals: Changes in bioactive compounds during lactic fermentation. Food Research International, 104, 86–99. https://doi.org/10.1016/j.foodres.2017.09.031
- Sharma, H. P., Patel, H., Sugandha, S. (2017). Enzymatic added extraction and clarification of fruit juices–A review. Critical Reviews in Food Science and Nutrition, 57(6), 1215–1227. https://doi.org/10.1080/10408398.2014.977434
- Simsek, S., El, S. N., Kancabas Kilinc, A., & Karakaya, S. (2014). Vegetable and fermented vegetable juices containing germinated seeds and sprouts of lentil and cowpea. Food Chemistry, 156, 289–295. https://doi.org/10.1016/j.foodchem.2014.01.095
- Siroli, L., Patrignani, F., Serrazanetti, D. I., Tabanelli, G., Montanari, C., Gardini, F., & Lanciotti, R. (2015). Lactic acid bacteria and natural antimicrobials to improve the safety and shelf-life of minimally processed sliced apples and lamb’s lettuce. Food Microbiology, 47, 74–84. https://doi.org/10.1016/j.fm.2014.11.008
- Suto, M., & Kawashima, H. (2022). Discrimination for sake brewing methods by compound specific isotope analysis and formation mechanism of organic acids in sake. Food Chemistry, 381, 132295. https://doi.org/10.1016/j.foodchem.2022.132295
- Taha, M. O., Dahabiyeh, L. A., Bustanji, Y., Zalloum, H., & Saleh, S. (2008). Combining ligand-based pharmacophore modeling, quantitative structure-activity relationship analysis and in silico screening for the discovery of new potent hormone sensitive lipase inhibitors. Journal of Medicinal Chemistry, 51(20), 6478–6494. https://doi.org/10.1021/jm800718k
- Tahir, Z., Saeed, F., Nosheen, F., Ahmed, A., & Anjum, F. M. (2022). Comparative study of nutritional properties and antioxidant activity of raw and fermented (black) garlic. International Journal of Food Properties, 25(1), 116–127. https://doi.org/10.1080/10942912.2022.2026954
- Terahara, N. (2015). Flavonoids in foods: A review. Natural Product Communications, 10(3), 521–528. https://doi.org/10.1177/1934578X1501000334
- Thörneby-Andersson, K., Sterner, O., & Hansson, C. (2000). Tyrosinase-mediated formation of a reactive quinone from the depigmenting agents, 4-tert-butylphenol and 4-tert-butylcatechol. Pigment Cell Research, 13(1), 33–38. https://doi.org/10.1034/j.1600-0749.2000.130107.x
- Tiss, M., Souiy, Z., Abdeljelil, N. B., Njima, M., Achour, L., & Hamden, K. (2020). Fermented soy milk prepared using kefir grains prevents and ameliorates obesity, type 2 diabetes, hyperlipidemia and liver-kidney toxicities in HFFD-rats. Journal of Functional Foods, 67, 103869. https://doi.org/10.1016/j.jff.2020.103869
- Tkacz, K., Chmielewska, J., Turkiewicz, I. P., Nowicka, P., & Wojdyło, A. (2020). Dynamics of changes in organic acids, sugars and phenolic compounds and antioxidant activity of sea buckthorn and sea buckthorn-apple juices during malolactic fermentation. Food Chemistry, 332, 127382. https://doi.org/10.1016/j.foodchem.2020.127382
- Tong, Z., Tong, Y., Wang, D., & Shi, Y.-C. (2021). Whole maize flour and isolated maize starch for production of citric acid by Aspergillus niger: A review. Starch - Stärke, 75(3–4), 1–11. https://doi.org/10.1002/star.202000014
- Velićanski, A. S., Cvetković, D. D., Markov, S. L., Šaponjac, V. T., & Vulić, J. J. (2014). Antioxidant and antibacterial activity of the beverage obtained by fermentation of sweetened lemon balm (Melissa officinalis L.) tea with symbiotic consortium of bacteria and yeasts. Food Technology and Biotechnology, 52(4), 420–429. https://doi.org/10.17113/ftb.52.04.14.3611
- Vinusha, K. S., Deepika, K., Johnson, T. S., Agrawal, G. K., & Rakwal, R. (2018). RETRACTED: Proteomic studies on lactic acid bacteria: A review. Biochemistry and Biophysics Reports, 14, 140–148. https://doi.org/10.1016/j.bbrep.2018.04.009
- Wang, C. Y., Ng, C. C., Su, H., Tzeng, W. S., & Shyu, Y. T. (2009). Probiotic potential of noni juice fermented with lactic acid bacteria and bifidobacteria. International Journal of Food Sciences and Nutrition, 60(sup6), 98–106. https://doi.org/10.1080/09637480902755095
- Wijayant, E. D., Setiawan, N. C. E., & Cristi, J. P. (2017). Effect of lactic acid fermentation on total phenolic content and antioxidant activity of fig fruit juice (Ficus carica). Health Science International Conference, 2. https://doi.org/10.2991/hsic-17.2017.44
- Yang, D., Wang, L., Zhai, J., Han, N., Liu, Z., Li, S., & Yin, J. (2021). Characterization of antioxidant, α-glucosidase and tyrosinase inhibitors from the rhizomes of potentilla anserina L. and their structure-activity relationship. Food Chemistry, 336, 127714. https://doi.org/10.1016/j.foodchem.2020.127714
- Yu, Z., Weipeng, L., & Zehua, W. (2021). Enhancement of functional characteristics of blueberry juice fermented by lactobacillus plantarum. LWT-Food Science and Technology, 139, 110590. https://doi.org/10.1016/j.lwt.2020.110590
- Zhang, S., Cheng, M., Li, Z., Guan, S., Cai, B., Li, Q., & Rong, S. (2020). Composition and biological activity of rose and jujube kernel after fermentation with kombucha SCOBY. Journal of Food Processing and Preservation, 44(10), e14758. https://doi.org/10.1111/jfpp.14758
- Zhang, Y., Liu, W., Wei, Z., Yin, B., Man, C., & Jiang, Y. (2021). Enhancement of functional characteristics of blueberry juice fermented by lactobacillus plantarum. LWT, 139, 110590. https://doi.org/10.1016/j.lwt.2020.110590
- Zhao, W., Xiao, C., Zhang, X., & Al, E. (2021). Effect of maturity on the quality of Noni fruit enzymes. Food Science, 42(2), 164–169.
- Zheng, M., Liu, X., Chuai, P., Jiang, Z., Zhu, Y., Zhang, B., Ni, H., & Li, Q. (2021). Effects of crude fucoidan on physicochemical properties, antioxidation and bacteriostasis of surimi products. Food Control, 122, 107806. https://doi.org/10.1016/j.foodcont.2020.107806
- Zolghadri, S., Bahrami, A., Hassan Khan, M. T., Munoz-Munoz, J., Garcia-Molina, F., Garcia-Canovas, F., & Saboury, A. A. (2019). A comprehensive review on tyrosinase inhibitors. Journal of Enzyme Inhibition and Medicinal Chemistry, 34(1), 279–309. https://doi.org/10.1080/14756366.2018.1545767