
 ?Mathematical formulae have been encoded as MathML and are displayed in this HTML version using MathJax in order to improve their display. Uncheck the box to turn MathJax off. This feature requires Javascript. Click on a formula to zoom.
ABSTRACT
Coffee processing methods have a noteworthy impact on coffee quality. The aim of this study was to investigate the influence of coffee processing methods on raw and cup quality at Jimma, Gera and Tepi locations. Accordingly, the highest total raw quality (36.34 and 36.39%) was recorded under Tepi locations for washed and semi-washed coffee respectively followed by 35.57% for washed coffee in Jimma and 35.07% for washed coffee in Gera. However, the cup quality of dry processed coffee is significantly higher at Tepi (47.24) and Jimma (45.07) locations. But, under Gera, washed and semi-washed coffee scored the highest cup quality (45.37 and 45.07%), respectively. Highest caffeine (1.51 and 1.55 g/100 g) and lipid (14.46–15.03 g/100 g) were recorded for Tepi and Gera, respectively, which were attributed to location. In general, all processing methods can result in acceptable coffee quality, provided that carried out in accordance with expert advice.
1. Introduction
Coffee genus Coffea, which belongs to the Rubiaceae family, is a very important agricultural product in the world. It is widely cultivated in tropical and subtropical regions of Africa, Southeast Asia, and South America (Haile & Kang, Citation2019). Coffee is an important global commodity due to its popular beverages, which generate substantial exchange earnings for many developing nations (Tadesse et al., Citation2016). Arabica coffee is an indigenous Ethiopia crop that plays a major role in the country’s economy by generating 5% of gross domestic product (GDP) and supporting many livelihoods (Worako et al., Citation2008). Ethiopia reported a 2.9 million MT export volume in 2021/22 valued at $1.52 billion, making it the largest producer of Arabica coffee in Africa and the world’s fifth largest exporter (USDA, Citation2023).
However, the export standard and coffee market price values are determined by the quality of coffee beans and their beverages (Haile & Kang, Citation2019). The quality of coffee beans and final beverages are varied depending on pre-and post-harvest factors such as place of origin, growing conditions, cultivation system, harvesting, processing and drying methods (Bastian et al., Citation2021; Haile & Kang, Citation2019; Hameed et al., Citation2018; Velásquez & Banchón, Citation2023). All of the aforementioned factors have an impact on the quality characteristics of coffee beans, which are used to grade coffee for marketing purposes, either directly or indirectly. Furthermore, genetics, environmental, postharvest handling and processing all affect coffee quality; post-harvest processing accounts for about 60% of the total coffee quality (Haile & Kang, Citation2019; Hameed et al., Citation2018; Velásquez & Banchón, Citation2023).
The biochemical constituents of coffee beans and the final cup quality can be altered based on contributing factors. For instance, growing conditions and processing methods can influence the composition of coffee beans, which in turn affects the quality attributes of final beverages (Kassaye et al., Citation2017; Worku et al., Citation2018). Furthermore, postharvest processing methods could change the level and metabolism of aromatic compounds in coffee, resulting in varying cup quality (Gonzalez-Rios et al., Citation2007). There are three different coffee processing methods: washed, semi-washed, and dry. Ethiopian coffee is mostly processed using dry (~65%) and wet (35%) methods, with basic quality issues that impact its market competency and price across locations (Tadesse et al., Citation2016). Semi-washed method is still relatively new in Ethiopia, but becoming popular among small-scale coffee growers due to water use efficiency, time saving, minimum weight loss and simplicity (Elfinesh et al., Citation2022).
However, the choice of these processing methods largely depends on environmental conditions. Accordingly, a particular processing method can produce premium quality coffee in specific environments but may not be acceptable in others. For example, dry processing in some highly humid environments like Jimma, Gambela, and Kaffa in Ethiopia resulted in low quality coffee beans (Birhanu et al., Citation2013), while it is best method to produce high quality forest coffee at higher elevations (Tassew et al., Citation2021). Therefore, the selection of most suitable processing method based on environmental conditions is essential for achieving superior coffee quality with minimal impact on biochemical constituents. Caffeine, chlorogenic acids, and trigonelline are among the biochemical contents of coffee that are usually considered to be responsible for its flavor, aroma and cup quality as whole (Cheng et al., Citation2016; Kassaye et al., Citation2019; Mohammed et al., Citation2022).
Lipid is another component (7–17%) that contributes to the mouthfeel and texture of coffee beverages (Cheng et al., Citation2016; Joët et al., Citation2010). Caffeine is responsible for bitterness of coffee cups, while chlorogenic acids contributed to astringency, acidity bitterness and aroma of coffee beverages (Farah et al., Citation2006). Trigonelline is responsible for aroma formation through Millard and Strecker reaction during roasting (Cheng et al., Citation2016; Farah et al., Citation2006). Consequently, biochemical analysis of coffee beans is important for the sector as it greatly determines cup quality. Evaluation of the impact of different coffee processing methods on quality and chemical composition in diverse environment is vital. Studies has been conducted on one or two coffee processing methods in combinations with other factors like, variety, shade conditions and elevations on coffee quality attributes (Elfinesh et al., Citation2022; Kassaye et al., Citation2019; Tassew et al., Citation2021; Worku et al., Citation2018).
However, study on the potential impact of three processing methods on coffee, particularly in terms of chemical composition has not been comprehensively evaluated. Thus, the present study aimed to investigate the effect of different coffee processing methods on coffee quality attributes in varying agro ecological locations.
2. Materials and methods
2.1. Study area description
The study was conducted in three locations of Southwestern Ethiopia (): Jimma, Gera, and Tepi, representing mid, high and lowland coffee growing agro-ecologies as per described in literature (Legese, Citation2019; Lemi et al., Citation2018). The coffee plants in the study area were established by breeders for field experiments, and all managements were performed in compliance with provided guidelines (Taye et al., Citation2008). Coffees were planted at 2 m × 2 m spacing between plants, with population no more than 5000 tree h−1. The shade canopy (60% to 75%), consisted of mostly leguminous trees like Millettia ferruginea, Acacia abyssinica, Albizia sp., Erythrinia abyssinica, Calpurinea subdecondra, and Cordia African. The coffee management, including mulching and organic manure applications, was consistently followed according the recommendations (Taye et al., Citation2008).
Table 1. Agro-ecological profiles of coffee sampling sites.
2.2. Research design
The study was designed as a CRD factorial with three coffee processing methods across three locations and in three replications. The experiments were done at Jimma Agricultural Research Center, Coffee Processing and Quality Research Laboratory and Food Science and Nutrition Laboratory, in Addis Ababa.
2.3. Sample collection
Fully ripened red cherries (54 kg) were harvested from coffee plants aged 10 to 12 years in breeding fields of each. The harvesting was performed in bulk (genotype not specified) using selective hand-picking methods during the peak seasons of 2018–19 in Tepi (September), Jimma and Gera (October-November).
2.4. Sample preparation
The coffee samples for each location were prepared in accordance with the recommended procedure (Abrar & Negussie, Citation2020; Ashenafi et al., Citation2018). The cherries (Section 2.2) were divided into three equal 18 kg portions after sorted for improper color, ripeness, and any foreign materials. Next, three replications (6 kg) of each 18 kg portion were prepared using three methods: washed, semi-washed and dry. For the washed sample preparation, the cherries were pulped into a fermenter tank using a motorized single-disc coffee pulper (IRIMA-67, England) with a constant water supply. The pulped wet samples were allowed to ferment for 36 h, 48 h, and 24 h at Jimma, Gera, and Tepi, respectively. After these fermentation times, the samples were rinsed with fresh water and soaked for additional 24 h. Regarding semi-washed samples, the pulp and mucilage were mechanically removed without fermentation using an artificial demucilaging unit (EZMA Lodosa, Spain).
For dry processed samples, the cleaned cherries were directly dried in an open sun on elevated wire mesh bed. After each processing step, the samples were uniformly dried in the sun by spreading on an elevated wire mesh bed until they reached the desired moisture content (10–11%). The prepared coffee samples were packed in a plastic bag and stored at room temperature until they were needed for sensory and biochemical analysis.
2.5. Physical and cup quality evaluation
The physical and organoleptic attributes of coffee were evaluated following the standard procedures outlined in the laboratory manual (Abrar & Negussie, Citation2020). The coffee samples (Section 2.3) were manually dehusked using a wood mortar and pestle, followed by winnowing to separate the fruits and parchments. In terms of physical attributes, the size of coffee beans was calculated by dividing the weight of beans on a 14-mm screen by the original weight of the beans shaken over it and multiplying by 100. Five trained and certified panelists (one female and four male with age range of 28–40 years) were evaluated physical attributes of coffee including shape and make (SM), color, odor and cup quality attributes including aromatic intensity, aromatic quality, acidity, astringency, bitterness, body, flavor and overall cup quality of coffee using hedonic scales. The coffee beans (100 g) were medium roasted at 210°C for 10 min using coffee roaster (Probat BRZ6, Germany) and ground into fine powder using coffee grinder (Mahlkoing, Germany). About 8 g of this was infused with 180 mL of hot water (~93–95°C) and then cooled for testing.
Three brewed coffee cups per treatment were labeled with three-digit blind code and randomly presented for testing in a separate cupping room. The cuppers were evaluated and recorded brewed coffee for attributes including Aromatic intensity, Aromatic quality, Acidity, Astringency, Bitterness, Body, Flavor, and Overall quality using format prepared for this purpose (). Bottled water was provided to rinse their mouths between each test.
Table 2. Raw and cup quality record sheet.
2.6. Biochemical analysis
2.6.1. Extract preparation
The green coffee beans were ground into a fine powder using a coffee grinder (High speed multi-function comminutor, RRH-A400) and sieved through a 0.46 mm sieve before extract preparation. The extract for the analysis of caffeine, chlorogenic acids and trigonelline was prepared according to a modified method of Farah et al. (Citation2006). Briefly, 0.5 g of powdered green coffee samples were mixed with 50 mL of distilled water in a flask and heated at 95°C for 20 min on a hot plate. Then, the samples were filtered using Whatman No. 1filter paper and a 0.45 µm pore size syringe filter after cooling. The extract was poured into vails and stored in a deep freezer until it was ready for analysis.
2.6.2. Chemical analysis using HPLC
The green coffee’s caffeine, chlorogenic acids and trigonelline contents was analyzed using HPLC (HPL AGILENT, U.S.A.) with Discovery C18 (250 × 4.6 mm, 5 μm, Alltech, Belgium) and Isocratic flow of 1 mL/min as described in Farah et al. (Citation2006). The working standards of 10, 20, 40, 60 and 80 mg/100 ml of mobile phase (0.2% acetic acid in water (v/v) and HPLC grade methanol) were injected into the HPLC. A calibration curve was created using the standard concentrations and samples area to determine biochemical composition based on the area generated after the retention time. The detection was performed using HPLC equipped with a photodiode array (PDA) detector (Surveyor, Thermo Finnigan, U.S.A.) at 266 nm (trigonelline), 324 nm (CGA) and 278 nm (caffeine).
2.7. Determination of crude lipid content
The crude lipid content of green coffee was determined gravimetrically using Soxhlet extraction (Soxtec 8000, Tecator Line, FOSS, Sweden), following AOAC (Citation2016), method No. 2003.06. Powdered green coffee (3 g) was placed in a cotton-covered thimble, and crude lipid was extracted into pre-dried, weighed vessels using an extraction chamber at 60°C. On the heating mantle, 60 mL of N-hexane was added, and the system was fitted with a continuous water flow condenser. The extraction process which lasted 120 min, involved boiling, rinsing, and solvent recovery. Finally, the vessels with oil residue were dried at 105°C for 30 min in oven, cooled and then weighed to calculate crude lipid content as follows:
where W2 = Weight of fat with vessels, W1= Vessel Weight, and Ws = Samples Weight.
2.8. Statistical analysis
All treatments were done in triplicate, and the data were analyzed by SAS software version 9.3. A Two-way Analysis of Variance (ANOVA) was performed and the difference between groups of mean was analyzed using least significant difference (LSD) at 5% probability level. The correlation between measured coffee quality attributes was computed by Pearson’s correlation using R software (Metan Package) version 4.3.2 (R core team, Austria).
3. Results and discussion
3.1. Physical and raw coffee quality attributes
The physical parameters of beans (size and color) were significantly (p < .05) affected by interaction of locations and processing methods (). The semi-washed beans had the highest screen retention (96%) under Jimma and lowest screen retention (91.30%) under Tepi conditions. Ameyu et al. (Citation2017) obtained comparable screen retention for washed (90.53%) and dry (85.87%) processed coffee in Ethiopia, Hararge Zone, harvested by selective handpicking and dried on raised wire mesh. Another study in the Kafa Districts Biosphere Reserve of Southwest Ethiopia reported higher scree retention (97.67% to 99%) for washed, semi-washed, and dry forest coffee, particularly at mid (1600–1800 m.a.s.l.) and low (<1600 m.a.s.l.) elevation gradients (Tassew et al., Citation2021). The discrepancies in screen retention (bean size) can be attributed to various factors such as coffee cultivation systems (forest, shade, and management), soil types, processing methods and bean final moisture content (Addis et al., Citation2022; Elfinesh et al., Citation2022).
Table 3. Environment by processing methods interaction effect on raw quality of coffee.
The percentage of screen retention, which pertains to the size of bean, is a crucial quality characteristic of coffee. The size of the beans is the primary consideration when purchasing coffee, as consumer often prefer medium to large bean sizes (Mulindwa et al., Citation2022). The shape and make (SM) of coffee beans were not significantly (p > .05) affected by the interaction of locations and processing methods (). The lowest SM (11.67) was recorded for washed coffee at Tepi and the highest SM (12.80) for semi-washed coffee at Gera. The shape of coffee beans can be described as oval, rounded, elongated, or flat, while make represents the uniformity/structure when the beans are observed together (Garuma et al., Citation2015). According to Abrar and Negussie (Citation2020), coffee beans with shape and make value ca.12 is considered “good” quality. Therefore, the results of all treatments in the present study matched the specified standard in terms of shape and make ().
However, the shape and make of coffee beans are influenced by their genetic makeup (variety), growing conditions (soil nutrients), processing (fermentation and drying) and method of dehusking. As an example, the best uniformity, shape and make quality scores (12.57–12.80) in present study were recorded under Gera conditions. The Gera condition’s high altitude (ca. 2185 m.a.s.l.) and low temperature (10.50–24.45°C) () may prolong bean maturity periods, leading to larger and more uniform bean sizes, followed by Jimma (midland) conditions (Mohammed et al., Citation2022). This result revealed that the variation in shape and make was primarily due to growing conditions rather than the employed processing methods. Moreover, the shape and make of coffee beans can be affected by multiple variables, including variety, processing and drying methods like artificial, solar and sun (Elfinesh et al., Citation2022; Shitaye Gure et al., Citation2014).
Concerning processing, semi-washed beans displayed better physical attributes when dried in a solar tunnel dryer compared to washed beans (Elfinesh et al., Citation2022) and when soaked for an additional 12 h (Shitaye Gure et al., Citation2014). The shape and make of coffee beans are essential to the coffee industry, along with other raw and cup quality attributes. The interactions of environmental and processing methods significantly (p < .05) altered the color of coffee beans (). Dry-processed beans under Gera conditions (highland) had the lowest color score (11.53), while washed coffee under Tepi conditions (lowland) attained the highest color score (14.67). The warmer temperature in Tepi conditions could reduce the fading of beans that might be caused by repeated drying by shortening the drying times compared to other conditions. On the other hand, the washed coffee scored the highest in terms of color relative to its respective semi-washed and dry-processed counterparts.
This showed that washed coffee beans have superior color quality compared to dry-processed and semi-washed beans. Nevertheless, all treatments in this study were judged acceptable in terms of color, with a score higher than 12, which was described as “greyish” by sensory terminology (Abrar & Negussie, Citation2020). The final color of coffee beans is primarily influenced by location of the growing environment and postharvest processing (Franca & Oliveira, Citation2008). Likewise, the final color of coffee beans was influenced by locations (lowland, highland and midland) and processing methods (washed, semi-washed and dry processed) in present study. Coffee bean’s color is an essential and primary attribute in determining its market value (Kulapichitr et al., Citation2022).
The odor of coffee beans was not significantly (p > .05) affected by the interaction of processing methods and locations (). The panelists reported no defects in the odor attribute for all treatments. Conversely, a study on forest coffee in Kafa, southwest Ethiopia, reported significant interaction effects between three coffee-growing districts (low, mid and high altitude) and with similar processing methods used in this study (Tassew et al., Citation2021). The odor of coffee beans can be influenced by the quality of the water used for fermentations, the types of microbes involved, and the extent of mucilage removal.
3.2. Coffee cup quality attributes
shows the interaction effects of environment and processing methods on cup quality attributes of coffee. Aromatic intensity (AI) was not significantly (p > .05) influenced by location and processing methods (). The lowest AI (3.73) was recorded for semi-washed coffee beans under Jimma conditions, and the highest AI (4.11) was recorded for dry-processed coffee at Tepi. Aromatic intensity refers to the degree to which the aroma of coffee beverage is perceived. The aromatic intensity of coffee beverages is influenced by various factors, growing conditions, fermentation and roasting process (Bhumiratana et al., Citation2019). The aromatic quality (AQ) was not significantly (p > .05) affected by location and processing methods employed (). The AQ ranged from 3.77 to 4.06, which can be classified as “very good” in sensory evaluation terminology According to Ethiopian cupping, the aromatic quality can be expressed as winey, citrus, mocha, fruity, spicy and floral (Abrar & Negussie, Citation2020).
Table 4. Environment by processing methods interaction effect on cup quality.
Similarly, Indonesian coffee beverages grown at high altitudes exhibit fruity, spicy and floral flavor, while those grown at mid-altitude had herbal, green and grassy characters (Nugroho et al., Citation2020). The aroma quality of a coffee beverage is somewhat similar to its flavor. The acidity of coffee cup was not significantly (p > .05) affected by the interaction of location and processing factors (). Semi-washed coffee beans at Jimma scored the lowest acidity (6.67) and washed beans at Tepi scored the highest acidity (7.44). These results are close to medium-point acidity but higher than medium, as stated in (Abrar & Negussie, Citation2020). The study also indicated that coffee cups processed by washed methods have higher acidity levels compared to those with semi-washed coffee (Rodriguez et al., Citation2020). Astringency of coffee cup was significantly (p < .05) affected by interaction of growing location and processing factors ().
The highest astringency score (5.56) was obtained for washed coffee under Tepi conditions (lowland), and the lowest (3.90) was recorded for dry-processed beans at Gera (highland) conditions. Similar processing method effects on coffee cup astringency have been documented in the literature (Scholz et al., Citation2019). Astringency is a mouth sensation resulting from the consumption of beverages like coffee and tea characterized by dryness, roughness, and puckery. It differs from acidity by its tactile sensation, while acidity is basic taste in the mouth (Fibrianto et al., Citation2021). High astringency in coffee beverages considered undesirable (Ribeiro et al., Citation2017) and can be affected by the concentrations of caffeine, trigonelline, and the secondary metabolite of chlorogenic acids (Hameed et al., Citation2018).
The bitterness of coffee cups was also significantly (p < .05) affected by location and processing methods interactions (). The bitterness score ranged from 3.73 to 4.67. Dry-processed coffee obtained the lowest and highest scores at Gera (highland) and Tepi (lowland) locations, respectively. These values are in the acceptable bitterness range, which varies between light (3) and nil (5) in terms of sensory terminology. The Alkaloids in coffee beans, such as caffeine, trigonelline and secondary metabolites of chlorogenic acids, were reported to impart bitterness in the final beverages (Hameed et al., Citation2018). The interaction of location and processing factors was significantly (p < .05) affected body of coffee cups (). The coffee beans processed using dry and washed methods at Tepi locations recorded the lowest (6.39) and highest (7.56) in terms of body. In accordance with earlier research (Elfinesh et al., Citation2022), semi-washed beans from midland and lowland areas have more body than washed beans ().
The current results of body cup quality attribute ranged between medium (6) to medium-full (8) (Abrar & Negussie, Citation2020). The content of caffeine, trigonelline, and chlorogenic acids can affect the body of coffee beverages (Hameed et al., Citation2018). In some instances, the term “body” can be used interchangeably with “mouth feel” and refers to oral-somatosensory sensation. Moreover, body has weight and texture aspects that are associated with the non-volatile components of coffee beverages (Spence & Carvalho, Citation2019). Therefore, it is all about viscosity of the coffee beverage, and heaviness on the tongue (thin to thick), which can be affected by factors like level of roasting (Bhumiratana et al., Citation2019). The flavor of coffee cup ranged from 6.53 to 7.50, with location and processing factors having no significantly (p > .05) impact (). Dry-processed coffee at Tepi location had the highest flavor score, while semi-washed coffee at Jimma location had the lowest flavor score. All flavor score results in this study were acceptable, with scores ranging from “average” (>6) to “good” (~8).
The flavor profile of coffee beverages varied based on either wet or dry processing methods (Subedi, Citation2010). The flavor is determined by a combination of genetic, environmental, processing and storage factors that can affect the quantity and nature of flavor inducing chemicals in coffee beverages (Kassaye et al., Citation2017). Dry-processed coffee at Tepi (lowland) scored the highest overall cup quality (7.56) and semi-washed coffee at Jimma scored the lowest (6.73), without significant effects of location and processing methods. Tepi coffee growing areas are considered lowland with relatively high temperatures (), which result in shorter fermentation times. Thus, the shorter fermentation time could lead to better coffee cup quality in the area (Howard, Citation2011).
Overall, coffee quality is a complex attribute influenced by pre- and post-harvest factors, such as environmental, agronomic, varietal, processing and storage (Cheng et al., Citation2016; Hameed et al., Citation2018; Velásquez & Banchón, Citation2023).
3.3. Total organoleptic quality
Interaction effects of location and processing methods on total raw quality (sum of screen size, shape and make, color and odor) attributes were found to be statistically significant (). The Tepi (lowland) location recorded the best total raw quality scores for semi-washed (36.39% and washed (36.34%) coffee beans. On the other hand, the beans with the lowest total raw quality scores were recorded for dry, and semi-washed at the three locations, ranging from 33.80 to 34.10%. These results agreed with those of Ameyu et al. (Citation2017), who found higher total raw quality for semi-washed beans compared to washed and dry processed beans in Ethiopia’s Hararge, Mechara area (altitude 1760 m.a.s.l. and temp 14–26°C). Another study by Hameed et al. (Citation2018) reported slightly lower raw coffee quality using similar processing methods, ranging from 29.72 to 32.33%.
Table 5. Interaction effects of environment and processing methods on total organoleptic quality.
The interaction of location and processing methods did not significantly (p > .05) affect the overall cup quality attributes (). However, the three processing methods at Tepi (lowland) conditions produced the highest overall cup quality, while washed and semi-washed at Jimma (midland) and semi-washed and dry beans Gera had the lowest overall cup quality. A study revealed that semi-washed coffee has a lower cup quality score compared to fully-washed beans, even though they are statistically similar (Hameed et al., Citation2018). In contrast, semi-washed processing, followed by sun- and solar-drying, led to coffee with a higher specialty cup quality than the washed method (Elfinesh et al., Citation2022; Shitaye Gure et al., Citation2014). Variations in overall cup quality can be attributed to factors such as growing conditions, variety, harvesting, fermentation, and drying methods. For instance, the final cup quality of a coffee beverage is determined by the quality of raw beans; the best cups are produced from the best raw (non-defective) beans, and vice versa (Farah et al., Citation2006).
The total quality (the sum of raw and cup quality) of coffee was found to be not significantly (p > .05) affected by interaction of location and processing factors (). Tassew et al. (Citation2021) reported similar outcomes using identical processing methods (wet, semi-washed and dry) across three distinct locations with varying elevations (low, mid and high) and habitats. However, the beans processed at Tepi location using three methods showed the highest total quality, with scores of 81.30% (dry-processed) and 82.47% (washed). Meanwhile, Jimma and Gera locations were found to have the highest total quality (out of 100%) for washed coffee beans. On the other hand, the lowest total quality (76.60) was awarded for semi-washed beans at Jimma. The total quality results in present work categorized as Grade 2 (75–84%) in accordance with ECX standard specifications (Ethiopian Commodity Exchange [ECX], Citation2015). Postharvest processing and handling practices have been reported to impact the quality of final coffee, both raw and cup (Hameed et al., Citation2018).
3.4. Biochemical composition
The impact of location and processing factors on the caffeine content of green beans was not statistically significant (). The caffeine content varied from 0.97 to 1.55 g/100 g, with the lowest value for washed beans at Gera and the highest for semi-washed beans at Tepi location. Our results are in line with those of Hameed et al. (Citation2018), who determined that there was no significant difference in the caffeine content of washed and semi-washed beans, ranging from 1.12 to 1.54 g/100 g. Another study by Eshetu et al. (Citation2022) found a significant interaction between varieties, processing (washed and semi-washed) and drying (solar, sun and artificial) methods on caffeine contents, ranging from 1.06 to 1.28 g/100 g. Similarly, study revealed a three-way interaction between shade, harvesting periods and altitude on caffeine contents (Kassaye et al., Citation2017). Accordingly, the caffeine contents of coffee beans were enhanced by washed method compared to semi-washed and dry, regardless of varieties and elevations (Eshetu et al., Citation2022; Kassaye et al., Citation2019).
Table 6. Interaction effect of growing environment and processing on chemical compositions.
The differences in caffeine content of coffee beans in this study could be attributed to growing conditions, altitude, cultivation systems, varieties and processing. Regarding altitude, our results agreed with those of Worku et al. (Citation2018), who found a 1.2 g/100 g reduction of caffeine contents in coffee beans as altitude increased by 100 m. Caffeine is a crucial constituents of beans for enhancing the bitterness and flavor profiles coffee beverages (Allison & Chambers, Citation2000; Hameed et al., Citation2018). Moreover, the study suggests moderate to low caffeine consumption, ranging from 38 and 400 mg or 0.3 to 4 brewed cups per day, can be helpful to reduce health risks (Ruxton, Citation2008). The interaction of location and processing methods did not significantly (p > .05) affect the concentration of chlorogenic acid. The chlorogenic acid contents ranged between 3.33 and 4.53 g/100 g. The lowest and highest values of CGA were obtained for washed and dry-processed beans at Gera, respectively. The study by Hameed et al. (Citation2018) reported an average CGA of 3.2%, which agreed with the current results. A higher CGA (7.65%) was determined for washed coffee beans (Joët et al., Citation2010). The study showed that genotype had a greater impact on chlorogenic content than altitude (Nugroho et al., Citation2020). Accordingly, chlorogenic acid contents were significantly influenced by the interaction of variety and processing methods (washed, semi-washed and dry), with the highest value for washed beans (Kassaye et al., Citation2019). On the other hand, as growing altitudes increased, the content of chlorogenic acid in coffee beans reduced (Worku et al., Citation2018), which coincided with our findings. Chlorogenic acids in coffee beans significantly enhance the bitterness, astringency and aroma of beverages through reactions like Millard and Strecker during roasting (Cheng et al., Citation2016).
The interaction effect of growing location and processing factors on trigonelline content was no statistically significant (p > .05). The trigonelline content ranged from 0.623 to 0.967 g/100 g, with higher values observed for mid and low altitudes compared to high altitudes (). Conversely, trigonelline content was found to be increased with altitudes (Nugroho et al., Citation2020). Another study determined a higher trigonelline content (0.87 to 1.21 g/100 g) than the present results, which was affected by the interaction of varieties, processing and drying methods (Eshetu et al., Citation2022). Trigonelline is essential for enhancing the aroma of coffee beverages, but its concentrations depend on the quality of the raw beans. Raw beans without defective beans had higher trigonelline contents, while poor quality defective beans resulted in lower trigonelline concentrations (Farah et al., Citation2006; Hameed et al., Citation2018).
The biochemical content variations in coffee beans can be attributed to factors such as growing conditions, genotype, processing, drying, biochemical extraction and analysis methods. The interaction effect of location and processing methods on lipid content was not statistically significant (p > .05). Semi-washed beans had the highest lipid content (15.03 g/100 g), but statistically similar with washed (14.46 g/100 g) and dry (14.89 g/100 g) processed beans at Gera (highland). Dry-processed beans had the lowest lipid content under Tepi (11.92 g/100 g) and Jimma (12.01 g/100 g) conditions, which were statistically similar (). The lipid contents in coffee beans was found to be 16.91 g/100 g for washed beans (Joët et al., Citation2010) and another literature reported that the lipid content ranged from 13 to 17 g/100 g (Patui et al., Citation2014). Lipids contain flavor and fat-soluble vitamins, which greatly impact the mouthfeel and texture of coffee beverages (Cheng et al., Citation2016).
3.5. Correlation between measured quality attributes
depicts the Pearson correlation between raw quality, cup quality, total quality and biochemical composition of coffee processed using three methods at three locations. The caffeine content was strongly associated with color (r = 0.56), odor (r = 0.62), and total raw quality (r = 0.56). The correlation analysis revealed a direct relationship between all cup quality attributes (), which coincided with previous findings (Merga Sakata et al., Citation2022). Lipid content was inversely correlated with flavor (r = −0.46), acidity (r = −0.43) and overall acceptability (r = −0.43). Dos Santos et al. (Citation2018) determined a significant negative correlation between lipid contents and coffee isomers, which significantly affects cup quality. Negative correlation between cup quality attributes and chemical composition was determined by Sualeh et al. (Citation2020), suggesting that biochemical contents of coffee significantly influence cup quality.
Figure 1. Pearson correlation among sensory quality attributes and chemical composition of coffee beans.
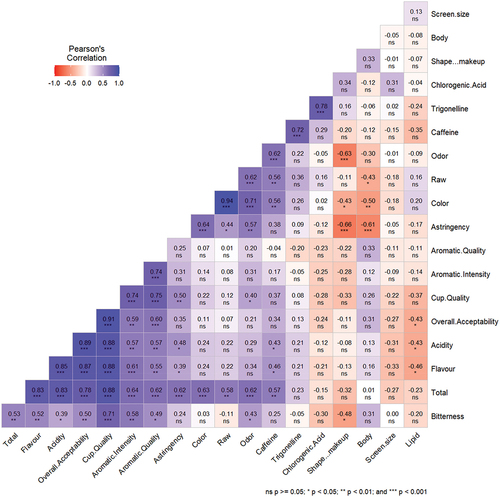
A weak relationship was previously observed between caffeine and trigonelline and final cup quality attributes (Fassio et al., Citation2016). Additionally, the study found that caffeine and chlorogenic acid contents were negatively associated with flavor, aftertaste, body and overall acceptability with r values ranging from −0.42 to −0.96 (Khapre et al., Citation2017). This indicates that chemical composition of coffee beans play a crucial role in determining the quality of coffee beverages (Farah et al., Citation2006). Furthermore, strong positive correlation was obtained between trigonelline and caffeine content (r = 0.72) and trigonelline and chlorogenic acid content (r = 0.78) (). The direct relationship between chemical constituents of coffee could be attributed to their metabolic and physiological origin (Barbosa et al., Citation2019).
4. Conclusion
Coffee quality is a complex characteristic that depends on many variables, the most important of which are growing conditions and processing methods. The result showed that the interaction of growing locations and processing methods significantly affected screen retention (beans size), color, astringency, bitterness, body and raw quality. Similarly, shape and make, odor, aromatic intensity, flavor, overall acceptability, cup quality and total quality of coffee beans were not significantly affected by the interaction of location and processing methods. The washed beans exhibited highest total raw quality across all locations, followed by semi-washed beans. Dry-processed beans showed higher bitterness and body, while washed beans had higher astringency in terms of cup quality. Furthermore, dry processed beans had the highest cup quality at lowland conditions. The growing locations had a greater influence on total quality and biochemical composition of coffee than the processing methods. Regarding quality, the employed processing methods resulted in acceptable coffee quality at the studied locations. Caffeine, chlorogenic acid, trigonelline and lipid contents were not significantly altered by the interaction of location and processing methods. The correlation analysis revealed a positive association between caffeine and raw quality attributes, positive significant relation between tested cup quality attributes, and significant positive relation between caffeine, chlorogenic acids and trigonelline. Future research should focus on the accessibility and cost-effectiveness of coffee processing methods across diverse coffee growing agro-ecologies over the years.
Disclosure statement
No potential conflict of interest was reported by the author(s).
Data availability statement
This manuscript contains all the data created during the study.
References
- Abrar, S., & Negussie, M. (2020). Manual for coffee quality laboratory. Ethiopian Institute of Agricultural Research (EIAR).
- Addis, A. T., Yadessa, G. B., Bote, A. D., Obso, T. K., & Abdelhamid, M. (2022). The coffee processing method had a more pronounced effect than location and production systems on the overall quality of Kaffa biosphere reserve coffees. International Journal of Agronomy, 2022, 1–9. https://doi.org/10.1155/2022/9913578
- Allison, A. M. A., & Chambers, E. R. (2000). The importance of caffeine as a flavor component in beverages. Journal of Sensory Studies, 15(4), 449–457. https://doi.org/10.1111/j.1745-459X.2000.tb00282.x
- Ameyu, M. A. Mohammed, W. & Shimber, T.(2017). Evaluation of harvesting and postharvest processing method on raw quality attributes of green Arabica Coffee beans produced in Hararghe, eastern Ethiopia. International. Journal of Plant Breeding and Crop Science, 4(2), 187–196.
- AOAC, Official Methods of Analysis of AOAC INTERNATIONAL. (2016). 20th. AOAC International.
- Ashenafi, A., Abush, T., Sentayehu, A., & Lemi, B. (2018). Heterosis and combining ability of coffee quality traits in Southwestern Ethiopian origin coffee hybrids. Ethiopian Journal of Applied Science and Technology, 9(1), 60–70.
- Barbosa, M. D. S. G., dos Santos Scholz, M. B., Kitzberger, C. S. G., & de Toledo Benassi, M. (2019). Correlation between the composition of green arabica coffee beans and the sensory quality of coffee brews. Food Chemistry, 292, 275–280. https://doi.org/10.1016/j.foodchem.2019.04.072
- Bastian, F., Hutabarat, O. S., Dirpan, A., Nainu, F., Harapan, H., Emran, T. B., & Simal-Gandara, J. (2021). From plantation to cup: Changes in bioactive compounds during coffee processing. Foods, 10(11), 2827. https://doi.org/10.3390/foods10112827
- Bhumiratana, N., Wolf, M., Chambers IV, E., & Adhikari, K. (2019). Coffee drinking and emotions: Are there key sensory drivers for emotions?. Beverages, 5(2), 27.
- Birhanu, B., Daniel, K., & Tirufat, D. (2013). Quality and value chain analyses of Ethiopian coffee. Journal of Agriculture and Social Research (JASR), 13(2), 35–41.
- Cheng, B., Furtado, A., Smyth, H. E., & Henry, R. J. (2016). Influence of genotype and environment on coffee quality. Trends in Food Science & Technology, 57, 20–30. https://doi.org/10.1016/j.tifs.2016.09.003
- dos Santos Scholz, M. B., Kitzberger, C. S. G., Durand, N., & Rakocevic, M. (2018). From the field to coffee cup: Impact of planting design on chlorogenic acid isomers and other compounds in coffee beans and sensory attributes of coffee beverage. European Food Research and Technology 244, 1793–1802.
- Elfinesh, F., Ali, M., Gezahegn, B., Weyessa, G., & Romeo, F. V. (2022). Coffee drying and processing method influence quality of arabica coffee varieties (Coffee arabica L.) at Gomma I and Limmu Kossa, Southwest Ethiopia. Journal of Food Quality, 2022, 1–8. https://doi.org/10.1155/2022/9184374
- Eshetu, E. F., Tolassa, K., Mohammed, A., Berecha, G., & Garedew, W. (2022). Effect of processing and drying methods on biochemical composition of coffee (coffea arabica L.) varieties in Jimma Zone, Southwestern Ethiopia. Cogent Food & Agriculture, 8(1), 2121203. https://doi.org/10.1080/23311932.2022.2121203
- Ethiopian Commodity Exchange. (2015). Coffee contracts.
- Farah, A., De Paulis, T., Moreira, D. P., Trugo, L. C., & Martin, P. R. (2006). Chlorogenic acids and lactones in regular and water-decaffeinated arabica coffees. Journal of Agricultural and Food Chemistry, 54(2), 374–381. https://doi.org/10.1021/jf0518305
- Fassio, L., Malta, M. R., Carvalho, G. R., Liska, G. R., De Lima, P. M., & Pimenta, C. J. (2016). Sensory description of cultivars (Coffea arabica L.) resistant to rust and its correlation with caffeine, trigonelline, and chlorogenic acid compounds. Beverages, 2(1), 1. https://doi.org/10.3390/beverages2010001
- Fibrianto, K., Yuwono, S. S., & Hasyati, N. (2021, March). Just about right analysis of coffee leaves tea bitterness and astringency by modifying brewing temperature and time. In IOP Conference Series: Earth and Environmental Science, Jember, East Java, Indonesia (Vol. 672, No. 1, p. 012053). IOP Publishing.
- Franca, A. S., & Oliveira, L. S. (2008). Chemistry of defective coffee beans. Food Chemistry Research Developments, 4(1), 105–138.
- Garuma, H., Berecha, G., & Abedeta, C. (2015). Influence of coffee production systems on the occurrence of coffee beans abnormality: Implication on coffee quality. Asian Journal of Plant Sciences, 14(1), 40–44. https://doi.org/10.3923/ajps.2015.40.44
- Gonzalez-Rios, O., Suarez-Quiroz, M. L., Boulanger, R., Barel, M., Guyot, B., Guiraud, J. P., & Schorr-Galindo, S. (2007). Impact of “ecological” post-harvest processing on coffee aroma: II. Roasted coffee. Journal of Food Composition and Analysis, 20(3–4), 297–307. https://doi.org/10.1016/j.jfca.2006.12.004
- Haile, M., & Kang, W. H. (2019). The harvest and post-harvest management practices’ impact on coffee quality. Coffee-Production and Research, 1–18. https://doi.org/10.5772/intechopen.82913
- Hameed, A., Hussain, S. A., Ijaz, M. U., Ullah, S., Pasha, I., & Suleria, H. A. R. (2018). Farm to consumer: Factors affecting the organoleptic characteristics of coffee. II: Postharvest processing factors. Comprehensive Reviews in Food Science and Food Safety, 17(5), 1184–1237. https://doi.org/10.1111/1541-4337.12365
- Howard, B. (2011). Factors influencing cup quality in coffee. Rwanda: Global Coffee Quality Research Initiative, 30.
- Joët, T., Laffargue, A., Descroix, F., Doulbeau, S., Bertrand, B., Kochko, A. D., & Dussert, S. (2010). Influence of environmental factors, wet processing and their interactions on the biochemical composition of green arabica coffee beans. Food Chemistry, 118(3), 693–701. https://doi.org/10.1016/j.foodchem.2009.05.048
- Kassaye, T., Alemayehu, D., Belew, D., & Boeckx, P. (2019). Biochemical composition of Ethiopian coffees (Coffea arabica L.) as influenced by variety and postharvest processing methods. African Journal of Food Science, 13(2), 48–56. https://doi.org/10.5897/AJFS2018.1770
- Kassaye, T., D’heer, J., Duchateau, L., & Boeckx, P. (2017). Influence of growing altitude, shade and harvest period on quality and biochemical composition of Ethiopian specialty coffee. Journal of the Science of Food and Agriculture, 97(9), 2849–2857. https://doi.org/10.1002/jsfa.8114
- Khapre, Y., Kyamuhangire, W., Njoroge, E. K., & Kathurima, C. W. (2017). Analysis of the diversity of some arabica and robusta coffee from Kenya and Uganda by sensory and biochemical components and their correlation to taste. IOSR Journal of Environmental Science, Toxicology and Food Technology (IOSR-JESTFT), 11(10), 39–43.
- Kulapichitr, F., Borompichaichartkul, C., Fang, M., Suppavorasatit, I., & Cadwallader, K. R. (2022). Effect of post-harvest drying process on chlorogenic acids, antioxidant activities and CIE-Lab color of Thai arabica green coffee beans. Food Chemistry, 366, 130504. https://doi.org/10.1016/j.foodchem.2021.130504
- Legese, H. (2019). Assessment of mycotoxigenic fungi and their toxins in coffee (Coffea Arabica L.) from major coffee growing areas of Jimma Zone, Southwest Ethiopia [ Masters dissertation]. Jimma University.
- Lemi, B., Alamerew, S., Ayano, A., & Daba, G. (2018). Genotype environment interaction and yield stability of Arabica coffee (Coffea arabica L.) genotypes. African Journal of Agricultural Research, 13(4), 210–219. https://doi.org/10.5897/AJAR2017.12788
- Merga Sakata, W., Gebreselassie Abtew, W., Garedew, W., & Piga, A. (2022). Organoleptic quality attributes and their association with morphological traits in Arabica Coffee (Coffea arabica L.) genotypes. Journal of Food Quality, 2022, 1–10. https://doi.org/10.1155/2022/2906424
- Mohammed, W., Astatkie, T. & Boeckx, P. (2022). Effect of growing conditions and postharvest processing on arabica coffee bean physical quality features and defects. Heliyon, 8(4).
- Mulindwa, J., Kaaya, A. N., Muganga, L., Paga, M., Musoli, P., Sseremba, G., Wagoire, W. W., & Bitalo, D. N. (2022). Cup quality profiles of Robusta coffee wilt disease resistant varieties grown in three agro‐ecologies in Uganda. Journal of the Science of Food and Agriculture, 102(3), 1225–1232. https://doi.org/10.1002/jsfa.11460
- Nugroho, D., Basunanda, P., & Yusianto, Y. (2020). Performance of biochemical compounds and cup quality of Arabica coffee as influenced by genotype and growing altitude. Pelita Perkebunan (A Coffee and Cocoa Research Journal), 36(1), 1–23. https://doi.org/10.22302/iccri.jur.pelitaperkebunan.v36i1.409
- Patui, S., Clincon, L., Peresson, C., Zancani, M., Conte, L., Del Terra, L., Navarini, L., Vianello, A., & Braidot, E. (2014). Lipase activity and antioxidant capacity in coffee (Coffea arabica L.) seeds during germination. Plant Science, 219–220, 19–25. https://doi.org/10.1016/j.plantsci.2013.12.014
- Ribeiro, L. S., Ribeiro, D. E., Evangelista, S. R., Miguel, M. G. D. C. P., Pinheiro, A. C. M., Borém, F. M., & Schwan, R. F. (2017). Controlled fermentation of semi-dry coffee (Coffea arabica) using starter cultures: A sensory perspective. LWT-Food Science and Technology, 82, 32–38. https://doi.org/10.1016/j.lwt.2017.04.008
- Rodriguez, Y. F., Guzman, N. G., & Hernandez, J. G. (2020). Effect of the postharvest processing method on the biochemical composition and sensory analysis of arabica coffee. Engenharia Agrícola, 40(2), 177–183. https://doi.org/10.1590/1809-4430-eng.agric.v40n2p177-183/2020
- Ruxton, C. H. S. (2008). The impact of caffeine on mood, cognitive function, performance and hydration: A review of benefits and risks. Nutrition Bulletin, 33(1), 15–25. https://doi.org/10.1111/j.1467-3010.2007.00665.x
- Scholz, M. B. D. S., Prudencio, S. H., Kitzberger, C. S. G., & Silva, R. S. D. S. F. D. (2019). Physico-chemical characteristics and sensory attributes of coffee beans submitted to two post-harvest processes. Journal of Food Measurement and Characterization, 13(1), 831–839. https://doi.org/10.1007/s11694-018-9995-x
- Shitaye Gure, A. M., Garedew, W., & Bekele, G. (2014). Effect of mucilage removal methods on the quality of different coffee (Coffea arabica L.) varieties in Jimma, South Western Ethiopia. World Applied Sciences Journal, 32(9), 1899–1905.
- Spence, C., & Carvalho, F. M. (2019). Assessing the influence of the coffee cup on the multisensory tasting experience. Food Quality and Preference, 75, 239–248. https://doi.org/10.1016/j.foodqual.2019.03.005
- Sualeh, A., Kassaye, T., & Mohammed, A. (2020). Biochemical composition of green and roasted coffee beans and their association with coffee quality from different districts of southwest Ethiopia. Heliyon, 6(12), e05812. https://doi.org/10.1016/j.heliyon.2020.e05812
- Subedi, R. N. (2010). Comparative analysis of dry and wet processing of coffee with respect to quality in Kavre District, Nepal [ Master’s Thesis]. Wageningen University, pp. 43–51.
- Tadesse, F. T., Jemal, Y., & Abebe, H. (2016). Effect of green coffee processing methods and roasting temperatures on physical and cup quality of Sidama coffee, Southern Ethiopia. Journal of Nutritional Ecology and Food Research, 3(1), 44–50. https://doi.org/10.1166/jnef.2016.1119
- Tassew, A. A., Yadessa, G. B., Bote, A. D., & Obso, T. K. (2021). Influence of location, elevation gradients, processing methods, and soil quality on the physical and cup quality of coffee in the Kafa biosphere reserve of SW Ethiopia. Heliyon, 7(8), e07790. https://doi.org/10.1016/j.heliyon.2021.e07790
- Taye, E., Kufa, T., Netsere, A., Shimber, T., Yilma, A., & Ayano, T. (2008). Research on Arabica coffee field management. Ethiopian Institute of Agricultural Research.
- U.S. Department of Agriculture, Foreign Agricultural Service. (2023). Coffee Annual: 2023 [ET2023-0014].
- Velásquez, S., & Banchón, C. (2023). Influence of pre-and post-harvest factors on the organoleptic and physicochemical quality of coffee: A short review. Journal of Food Science and Technology, 60(10), 2526–2538. https://doi.org/10.1007/s13197-022-05569-z
- Worako, T. K., van Schalkwyk, H. D., Alemu, Z. G., & Ayele, G. (2008). Producer price and price transmission in a deregulated Ethiopian coffee market. Agricultural Economics Research, Policy and Practice in Southern Africa, 47(4), 492–508. https://doi.org/10.1080/03031853.2008.9523812
- Worku, M., De Meulenaer, B., Duchateau, L., & Boeckx, P. (2018). Effect of altitude on biochemical composition and quality of green arabica coffee beans can be affected by shade and postharvest processing method. Food Research International, 105, 278–285. https://doi.org/10.1016/j.foodres.2017.11.016