
 ?Mathematical formulae have been encoded as MathML and are displayed in this HTML version using MathJax in order to improve their display. Uncheck the box to turn MathJax off. This feature requires Javascript. Click on a formula to zoom.
ABSTRACT
This study aimed to produce herbal tea using an infusion of Hibiscus with Lemon verbena. Dried Hibiscus calyces and lemon verbena leaves were combined in a percentage of: 90:5 (HL1), 90:10 (HL2), 85:15 (HL3), 80:20 (HL4), 75:25 (HL5), 70:30 (HL6), 65:35 (HL7), 60:40 (HL8), 55:45 (HL9), 50:50 (HL10), respectively, and commercial tea and 100% Hibiscus were used for comparison. The formulated tea was evaluated for pH, total soluble solids (TSS), color density, hue tint, total phenolics, total flavonoids, DPPH radical scavenging capacity and ferric reducing antioxidant power (FRAP), sensory acceptance (7-hedonic scale) and their correlation were determined. No significant differences (p > .05) were found for total soluble solids (TSS). The pH, total flavonoids, total phenolics and antioxidant capacities of blended tea were significantly decreased with the concentrations of calyces. The blended tea had sensory acceptance with incorporation of 10–45% dried lemon verbena leaves, and potential phytochemical and antioxidant capacities.
1. Introduction
Tea is the second most popular beverage regularly consumed worldwide for refreshment and health benefits. Herbal tea made with Hibiscus is one of this with the highest specialty beverages universally existed (Ramirez et al., Citation2010). Hibiscus sabdariffa usually known also as Roselle or Karkade is a herbaceous plant that belongs to the Malvaceae family native to Africa and widely distributed in the world (Paraíso et al., Citation2021). Hibiscus is a seasonal crop; thus, appropriate processing is required in order to prolong its shelf life, which involves adopting suitable drying, milling, packaging, and storage technologies as well as incorporation in a new food product development to explore its economic and health benefits (Ahiduzzaman et al., Citation2021; M’be et al., Citation2023).
From this perspective, the development of Hibiscus-based functional beverages namely herbal tea can be a good alternative for extensive utilization of Hibiscus (Mendonça et al., Citation2021) in Ethiopia, where the experience of developing popular functional beverages is occasional. Hibiscus is widely utilized in many countries including Senegal, Nigeria, and Sudan as a fresh or dried extract ingredients for alternative cheap functional beverage preparation, natural pigments, and phytochemical sources (Bechoff et al., Citation2014; Cissé et al., Citation2012; Villani et al., Citation2013). The potential of Hibiscus components used as ingredients includes flowers, leaves, seeds, and calyces (outer seed covering) (Ahiduzzaman et al., Citation2021), among which, anthocyanins, total phenolics, and flavonoids rich calyces that have beneficial effects on health are the main interests (Bechoff et al., Citation2014; Frank et al., Citation2012). Consequently, it can be mostly used for the production of functional beverages typically involving soaking, boiling, fermentation, and pasteurization, however, the process is not consistent (Barajas-Ramírez et al., Citation2021) in terms of processing methods and concentration of ingredients (Monteiro et al., Citation2017).
Additionally, the calyces have been used as ingredients, colorants, antimicrobials, and antioxidants in culinary, various meat products, and pharmaceutical industries (Santos et al., Citation2022; Singh et al., Citation2021; Yusri et al., Citation2012). Likewise, the hibiscus-based beverages are shown to have comparable anthocyanins, total flavonoids, and phenolics, all of which have strong antioxidant properties (Bechoff et al., Citation2014; Duque-Soto et al., Citation2023; Preciado-Saldaña et al., Citation2019). For instance, in vivo studies on mice and humans using Hibiscus-lemon verbena extract (Metabolaid®) were shown to be effective in controlling obesity and associated disorders (Herranz-López et al., Citation2019; Lee et al., Citation2018; Serna et al., Citation2022). Therefore, analyzing those characteristics is essential since they have an impact on the sensory acceptability of developed products and help to understand their potential health benefits (Barajas-Ramírez et al., Citation2021). In this regard, consumers do not usually enjoy Hibiscus-based beverages owing to their acidic and bitter taste (Mendonça et al., Citation2021; Mgaya et al., Citation2014), which might be caused by high phenolic compounds (Duque-Soto et al., Citation2023), organic acids (Meher et al., Citation2019), and tannins (Mostafa, Citation2023).
As a result, Hibiscus-based beverages have often been enhanced with natural ingredients instead of sugar, which could have further negative health effects. The industry could profit from the development and promotion of Hibiscus-based functional beverages, which are rich in phytochemicals, antioxidants and have appealing natural colors. The value addition of perishables such as Hibiscus, which has numerous health advantages, could potentially create a new brand of product that are available year-round, particularly for health-conscious consumers. In turn, the manufacturing sector could generate additional income and boost overall economic benefits. In previous work, sensory enhanced functional beverages was developed and optimized by blending hibiscus with pineapple, orange, and carrots (Ogundele et al., Citation2016), capuassu (Theobroma grandiflorum) pulp (Mendonça et al., Citation2021), coconut water (de Castro et al., Citation2021), green tea (Camella sinensis) (Preciado-Saldaña et al., Citation2019), mango, papaya, and guava juices (Mgaya et al., Citation2014), moringa and lemongrass (De Heer, Citation2011) and tannase treatment to remove bitterness (Mostafa, Citation2023). Blending of hibiscus with dried leaves of lemon verbena that have lemony pleasant fragrances may also be another alternative to enhance the taste of hibiscus-based beverages. Lemon verbena (Aloysia citrodora) is a perennial shrub that belongs to the family Verbenaceae that can be widely used in the food industry and is a home remedy for several health problems (Bahramsoltani et al., Citation2018). It is commonly known as laminate in Ethiopia with potential ingredients for infusion, non-alcoholic drinks, and flavorings of different food items. In view of this, this study was intended to develop and evaluate herbal tea from dried Hibiscus calyces and leaves of lemon verbena.
2. Materials and methods
2.1. Sample collection
The red mature calyces of Hibiscus (Hibiscus sabdariffa L.) and fresh leaves of lemon verbena (Aloysia citrodora) were collected from experimental compound of Wondo Genet Agriculture Research Center (WGARC), Wondogenet, Ethiopia.
2.2. Sample preparation
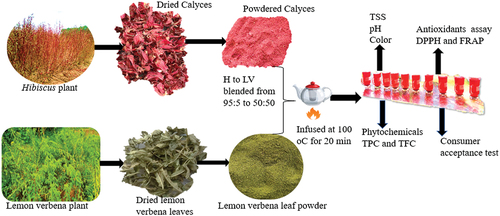
The calyces were manually separated from the seeds and sorted to remove defects, bruises, and damage prior to drying. Similarly, homogeneous lemon verbena leaves were selected and sorted to eliminate the deteriorated ones. Both samples were spread over clean mats and placed on a table. The samples were air dried in the shade for a week to preserve the volatile components (Killedar et al., Citation2017). The samples were rotated regularly throughout drying periods in order to ensure uniform drying until the milling texture or optimal moisture content was achieved. The dried samples were ground into a fine powder using a laboratory mill (Model BLG401, Zhejiang YiLi, China), packed in plastic bags and stored at room temperature until needed. The procedures followed for sample and herbal tea infusion preparation are illustrated in .
Figure 1. The study's overall methodology.
2.3. Treatments
The powdered samples (Section 2.2) were blended in different proportions (%) of Hibiscus to lemon verbena and assigned as follows: 95:5 (HL1), 90:10 (HL2), 85:15 (HL3), 80:20 (HL4), 75:25, (HL5), 70:30 (HL6), 65:35 (HL7), 60:40 (HL8), 55:45 (HL9), and 50:50 (HL10), respectively. A commercial sample of Camella sinensis tea (Wushwush) from Agri-CEFT PLC and 100% Hibiscus were used for comparison.
2.4. Moisture content analysis
The moisture content of blended samples was determined using an air convection-drying oven (China) following method No. 925.10, AOAC (Citation2016). Weighed aluminum cups (W1) containing 2 g of blended powder samples (Ws) were dried for an hour at 130°C in oven (DHG-9076A, China) and then cooled in a desiccator to room temperature. Afterwards, the samples were weighed again (W2) and the moisture content (%) was calculated using Equation (1).
where W2 = weight of cups + weight of samples after drying, W1= weight of empty cups and Ws = weight of original samples
2.5. Preparation of herbal tea infusion
The herbal tea infusion was prepared in accordance with Nguyen and Chuyen (Citation2020). The samples (Section 2.3) were weighed (1.0 g each) and infused for 20 min at 100°C in 100 mL of water. The brew was then filtered through a tea filter and cooled to approximately 50°C. The ready tea samples were poured into clean teacups containing 10 g of table sugar as sweetener and served for sensory evaluation.
2.6. Sensory evaluation
The sensory evaluation was conducted using a 7-hedonic scale (7 = Like very much; 1 = Dislike very much) in accordance with Hein et al. (Citation2008). The ethics regarding sensory evolution were reviewed by the committee of Food Science and Nutrition researchers. The samples were prepared from natural organic plants following hygienic and good manufacturing practices, which are not suspected to cause any safety-related hazards. The herbal tea infusion was assessed by 30 workers (primarily researchers) at Wondogenet Agricultural Research Center, Wondogenet Ethiopia. As Hibiscus is still relatively a new plant in Ethiopia, the blended herbal tea was first offered as a preliminary trail in the center’s cafeteria. Then, a brief oral and written orientation on the product sensory attribute evaluation and rating procedures was given to participants, prior to their evaluation at the Food Science and Nutrition Laboratory. The Three-digit blind-coded ready tea samples were offered to panelists in transparent teacups under hygienic conditions. Consumer panelists were aware to rank sensory attributes such as color, flavor, taste, aftertaste, and overall liking according to their preferences. Bottled water was provided to rinse their mouth between each test.
2.7. Physicochemical analysis of formulated herbal tea
2.7.1. Color
Color density and hue tint of formulated tea were determined according to (Monteiro et al., Citation2017) using a UV-VIS spectrophotometer (100-Cary Agilent Technologies, U.S.A.). The color parameters were calculated using Equations 1 and 2 after measuring the absorbance of infusion at 420, 520, and 700 nm.
where A 420 A520 and A700 represent the wave length at which the absorbance of herbal tea samples was measured. The color density calculation was based on the maximum absorption peak of Hibiscus extracts at 520 nm during scanning from 400 to 700 nm with varying pH levels (1–7), specifically at an acidic (pH ~ 3) environment (Wu et al., Citation2018).
2.7.2. Total soluble solids (TSS)
Total soluble solids (TSS) were measured using a digital refractometer (Atago hand refractometer N1 0–32). The herbal tea samples were poured onto refractometer’s glass slide, and the TSS (oBrix) readings were recorded from the display screen. The refractometer was being cleaned between each reading.
2.7.3. pH determination
The pH of samples before and after infusion was measured using a pH meter (Model PH–016) with a probe. For powdered samples, 5 g were mixed with 50 mL of distilled water and pH was recorded by direct probing. The pH of the brew was similarly recorded after cooling. The pH meter was calibrated before reading with buffer solutions having pH = 4, pH = 7, and pH = 10.
2.8. Phytochemical content and antioxidant capacities
2.8.1. Extract preparation
The herbal tea extract used to determine total phenolic content and antioxidant capacities was prepared according to Nguyen and Eun (Citation2011). Tea samples were diluted with 95% methanol at 1:10 v/v and extracted for 24 h using a HY-82 Orbital Shaker. The methanolic extract was filtered through Whatman No.1 filter paper and refrigerated at 4°C until phytochemicals and antioxidant capacity assay.
2.8.2. Total phenolic content
The total phenolic content of the methanolic extract was determined by the Folin-Ciocalteu method, as described in (Singleton et al., Citation1999). Briefly, 0.1 mL of extract (1 mg/mL) was mixed with 0.5 mL of tenfold diluted Folin-Ciocalteu reagent and 1.25 mL of 20% Na2CO3, and the mixture was allowed to stand for 2 h in the dark at room temperature. The absorbance was measured at 765 nm using a spectrophotometer (Genesys-10 UV, U.S.A.), and gallic acid was used as a standard for the calibration curve. The results were expressed as mg GAE/g extract.
2.8.3. Total flavonoids content
The aluminum chloride calorimetric method was used to determine the total flavonoid content as described in Chang et al. (Citation2002), using quercetin as a standard. Firstly, 0.5 mL of tea extract (1 mg/mL) was combined with 75 µL 5% NaNO2 and 1 mL of distilled water. After being allowed to stand for 6 min, 150 µL of 10% ALCl3 was added to the mixture, again permitted to stand for 5 min. Finally, the mixture was added with 0.5 mL of 1 M NaOH, vortexed, and then incubated for 15 min in the dark. The absorbance was measured at 510 nm using a spectrophotometer (Genesys-10 UV, U.S.A.), and results were expressed as mg QE/g.
2.8.4. DPPH radical scavenging capacities
The DPPH radical scavenging activity of an extract was assayed following the method of Brand-Williams et al. (Citation1995). One milliliter of tea extract in various concentrations (25 to 125 µg/mL) was made in a test tube, and a 0.004% (w/v) DPPH radical working solution in methanol was freshly prepared. Then, 4 ml of this was mixed with 1 mL of each extract concentration and incubated in the dark for 30 min at room temperature. The absorbance of the solutions was measured at 517 nm using a UV-visible spectrophotometer (Genesys-10 UV, U.S.A.) against methanol as a blank. The scavenging capacities were compared with those of ascorbic acid and BHT (positive controls), while fresh DPPH was used as a control according to Eq. (3).
The concentration of herbal tea extract required to scavenge 50% DPPH radical (IC50) in μg/mL was interpolated from the concentration series versus percentage scavenging capacity.
2.8.5. Ferric reducing antioxidant power (FRAP)
The reducing power (colorless Fe3+ to blue Fe2+/TPTZ complex) of herbal tea extract was determined according to the method of Benzie and Strain (Citation1996). A fresh working solution of FRAP was prepared by mixing solutions of acetate buffer (300 mM, pH 3.6), TPTZ (10 mM in 40 mM HCl), and FeCl3 (20 mM) at a ratio of 10: 1: 1 (v/v/v). Then, 0.1 mL of an extract (1 mg/mL) was mixed with 3 mL of fresh FRAP reagent and incubated in the dark for 30 min after stirring. The absorbance was measured at 593 nm using spectrophotometry (Genesys-10 UV, U.S.A.). A series solution of FeSO4.7 H2O was used as standard, and FRAP values were reported as µM Fe2+/g of dry extract.
2.9. Statistical analysis
One-way analysis of variance (ANOVA) was carried out using R software version 4.3.2 (R core team, Australia) for mean comparison. Significant differences between the means were determined by Tukey’s HSD test at p < .05. The association between variables was computed by Pearson correlation (r). All measurements were conducted in triplicate, except for DPPH radical scavenging, which was conducted in duplicates.
3. Results and discussion
3.1. Moisture, PH, TSS, and color
The moisture content, pH, TSS, and color values of hibiscus-lemon verbena tea and controls are shown in . There was a significant (p < .05) difference in moisture content between blended powder samples and the controls. The moisture content of blended powder samples ranged from 8.36% (HL3) to 8.55% (HL9), while 100% Hibiscus and Camellia sinensis tea powder had the lowest (7.58%) and the highest (8.99%), respectively () (Ramirez‐Rodrigues et al., Citation2011). reported a slightly higher moisture content (9.0%) for oven-dried Hibiscus at 105°C for 24 h. Likewise, a higher moisture content was reported by Juhari et al. (Citation2021) for calyces dried using vacuum (12.9%), freeze dryer (9.6%), commercial scale oven (9.5%), lab scale oven (8.9%), and sun (15.6%). Drying conditions such as temperature, humidity, air, and presence of haze during drying can affect the moisture contents by limiting light penetration into the samples.
Table 1. Moisture content, pH, TSS, and color of Hibiscus-lemon verbena blended (HL1-HL10) and controls (Wushwush and 100% Hibiscus).
Excessive moisture content in food product is known to increase the risk of bacteria and mold growth during storage. Given the proper management of drying process, the moisture content can be a useful parameter to select packaging materials and storage conditions. Blended samples and infusions had significantly (p < .05) lower pH values, which ranged from 2.18 to 2.86 and 2.50 to 3.10, respectively, compared to commercial Camella sinensis tea (4.92 and 5.51), but higher than 100% Hibiscus sample (2.11) and infusion (2.50). The current pH values are aligned with those of Bechoff et al. (Citation2014), who determined a pH range of 2.48 to 2.7, for commercial and traditional Hibiscus-based beverages. Furthermore, Mendonça et al. (Citation2021), determined a comparable range of pH (2.33 to 3.30) for Hibiscus-cappass pulp beverages using infusion and extraction. Another study by (Ogbonna et al., Citation2010) determined a higher pH value of 4.8 for herbal tea containing Hibiscus, lemon grass, and lemon peel.
Overall, the pH of Hibiscus-lemon verbena blended with herbal tea dropped (becoming more acidic) as Hibiscus proportion increased, which agreed with previous findings (Izquierdo-Vega et al., Citation2020; Meher et al., Citation2019). The types of products incorporated, like fruits and other herbal plants could influence the pH levels of Hibiscus-based beverages. The total soluble solids (TSS) of formulated herbal tea and controls ranged from 1.34 to 1.35 °Brix without significant differences (p > .05). Ramirez et al. (Citation2010) reported comparable results of TSS (1.10 to 1.25 °Brix) for fresh and dried cold-infused Hibiscus at 22°C for 240 min and hot-infused Hibiscus at 98°C for 16 min. On the other hand, higher TSS values were observed for Hibiscus tea brewed from samples dried at different temperature and Hibiscus-coconut water beverages (de Castro et al., Citation2021; Nguyen & Chuyen, Citation2020).
The color density and hue tint of tea brewed from blended samples, commercial Camellia sinensis tea and only hibiscus showed significant differences (p < .05). Treatment HL4 had the lowest color density (0.73 AU), whereas treatment HL5 had the highest color density (2.02 AU) compared to commercial tea (0.82 AU) and tea made from only Hibiscus (1.50 AU). A slightly higher range of color density (1.04 to 2.70 AU) was obtained by Ramirez‐Rodrigues et al. (Citation2011) for Hibiscus extracts at 25°C and 90°C. The color density measures the color properties of a beverage, with higher values indicate darker beverages. Treatment HL1and HL5 displayed the lowest and highest hue tint, respectively (). The lower hue tint indicates more redness or less yellow or brown color, and vice versa (Monteiro et al., Citation2017). A lower hue tint of 0.35 to 0.58 was previously documented for Hibiscus leaf extracts in both cold and hot conditions, under vacuum concentrate and ready-to-drink infusion (Monteiro et al., Citation2017; Ramirez‐Rodrigues et al., Citation2011).
Hue tint is a color degradation measure for anthocyanin-rich products like Hibiscus, which characterized by higher values due to maximum absorbance caused by discoloration (Ramirez‐Rodrigues et al., Citation2011). The final color characteristics of herbal infusions are likely influenced by sample preparations and brewing conditions, such as grinding, sorting, extraction, concentration, time, and temperature. For instance, high temperatures during brewing might cause anthocyanin polymerization, resulting in undesirable yellowing or browning color (Cisse et al., Citation2009; Ramirez‐Rodrigues et al., Citation2011). Moreover, extended extraction and pasteurization led to brick-yellow and higher hue tints in beverages, making them less appealing to consumers (Monteiro et al., Citation2017).
3.2. Phytochemical content and antioxidant capacities of hibiscus-lemon verbena infusion
displays total flavonoid, phenolic, and antioxidant capacities (IC50 values and ferric reducing power) of Hibiscus-lemon verbena, commercial and 100% Hibiscus tea methanolic extracts.
Table 2. TPC, TFC, and antioxidant capacities of hibiscus and lemon verbena blended tea.
3.2.1. Total flavonoid content (TFC)
The TFC of Hibiscus-lemon verbena, commercial Camella sinensis and 100% Hibiscus tea showed significant differences (p < .05). The TFC of Hibiscus-lemon verbena blended tea ranged from 1.39 (HL10) to 34.50 (HL1), compared with commercial (23.24 mg QE/g) and 100% Hibiscus tea (36.18 mg QE/g). The TFC decreased with the additions of Hibiscus in the blend, probably due to the interaction of phenolics from two distinct components. Our results partly coincide with those of Deli et al. (Citation2019), who reported that extracts of Hibiscus with different particle sizes produced using a methanol-water mix (70:30) had TFC ranging from 21.6 to 30.50 mg RE/g. Similarly, Singh et al. (Citation2021) obtained TFC values ranging from 17.35 to 21.73 mg RE/g for Hibiscus extracts prepared with various concentrations of methanol. Furthermore, the TFC of 25 Mexican Hibiscus varieties ethanolic (70% ethanol + 0.1% HCl) extracts were determined to range from 4.19 to 22.60 mg QE/g (Borrás-Linares et al., Citation2015). The total flavonoids content can be affected by various factors including plant origin, genotype, extraction methods, solvents, concentrations, and product types.
3.2.2. Total phenolic content (TPC)
The TPC of blended herbal tea varied significantly between 7.51 (HL10) and 41.34 mg GAE/g (HL1), while commercial and tea prepared from only Hibiscus had 29.60 and 41.82 mg GAE/g, respectively (). TPC was decreased as the proportion of Hibiscus decreased in the blend and vice versa. These results are consistent with those of Mendonça et al. (Citation2021) who reported a decrease in TPC from 171.96 to 48.42 for Hibiscus leaf extract-cassapsu pulp beverages. The reduction of TPC in Hibiscus-based beverages explicated by high contents of phenolics and interaction effects of phytochemicals from different components (Phan et al., Citation2018). According to Barajas-Ramírez et al. (Citation2021), TPC increased from 82.5 to 460 µg GAE/mL when the concentration of calyces increased from 1.0 to 10% in the blend. On the other hand, Nguyen and Chuyen (Citation2020) reported lower TPC (mg GAE/g) of 8.24, 8.38, and 8.23 for Hibiscus tea brewed at 80°C, 90°C, and 100°C, respectively. According to those authors, TPC of Hibiscus tea was affected by sample preparation methods, concentrations, and brewing conditions.
The type and quantity of ingredients in a blend significantly impact TPC, with higher values obtained for blends containing more ingredients (Naithani et al., Citation2006). Furthermore, extraction solvent greatly influenced TPC, hence higher TPC was obtained using more concentrated solvent (Singh et al., Citation2021). Similarly, a wide range of TPC (24 to 100 mg GAE/g) was determined for 25 Mexican Hibiscus varieties extracted with acidified 70% ethanol in 0.1% HCl (Borrás-Linares et al., Citation2015).
3.2.3. DPPH radical scavenging capacities
The IC50 values (µg/g) and %DPPH radical scavenging vs extract concentrations are presented in and respectively. The percentage of radical scavenging was determined by the concentrations of extracts; an increase in concentration resulted in an increase in percent radical scavenging (). Treatment HL3 exhibited the highest scavenging capacities (77.05%) at 75 µg/g, while HL10 had the lowest (27.14%). However, all treatments showed lower DPPH radical scavenging capacities as compared to BHT (81%) and Ascorbic acid (91.29%) (). According to a study by Nguyen and Chuyen (Citation2020), Hibiscus infused at various temperatures (80–100°C) had scavenging capacities ranging from 40.36 to 43.57%. The scavenging capacities of cold (0–25°C) and hot (~75°C) infused Hibiscus tea extracts were reported to range from 196 to 219.34 µM T/g (Paraíso et al., Citation2021). Previous study on Hibiscus-fruit juice functional beverages revealed that the formulations with high Hibiscus had the best antioxidant capacities (Ogundele et al., Citation2016).
Figure 2. DPPH radical scavenging capacities of Hibiscus-lemon verbena tea extracts in comparison with BHT, ascorbic acid, commercial tea and unblended hibiscus (100%) extracts.
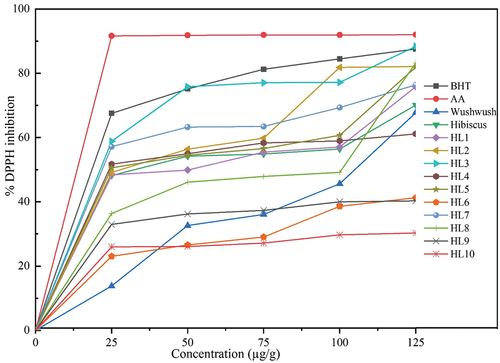
The IC50 values of HL3 and HL10 were determined to be the lowest (21.58 µg/g) and the highest (122.96 µg/g) compared to BHT (21.02 µg/g) and ascorbic acid (14.57 µg/g) (). The IC50 values of the herbal tea blend increased as the proportion of Hibiscus decreased.
3.2.4. Ferric reducing antioxidant power (FRAP)
The FRAP values (µM Fe+2/g) significantly varied between 302.25 (HL10) and 1016.50 (HL1) comparison to commercial (368.38) and 100% Hibiscus tea (1022.75). These results are higher than those of de Castro et al. (Citation2021), who determined that the average values for various ratios of Hibiscus-coconut water stored for 35 days varied between 89.29 and 142.11 µM Fe+2/g. The Hibiscus’s strong antioxidant capacities are attributed to its higher content of phenolic, flavonoids, and anthocyanins (de Castro et al., Citation2021). FRAP as antioxidant method measures the capacity of sample extract to convert Fe+3 to Fe+2 by means of electron transfer.
3.3. Sensory acceptance test
shows sensory analysis of Hibiscus-lemon verbena, commercial and 100% hibiscus tea. The blended herbal tea obtained a color hedonic mean score of 4.75 (HL1) to 6.00 (HL9), higher than commercial tea (3.88) but lower than 100% hibiscus (5.25). The color score of blended herbal tea matched the sensory expression of “slightly liked” and “like moderately”. Similar results were obtained for Hibiscus beverages blended with orange, pineapple, and apples at different ratios (Fasoyiro et al., Citation2005). The higher color score of Hibiscus-lemon verbena tea may be attributed to the bright red appearances of Hibiscus. The 100% Hibiscus tea obtained the lowest hedonic mean score in terms of flavor (3.63), taste (2.13), after taste (2.13) and overall acceptability (2.06). Meanwhile, treatment HL1 (95% Hibiscus and 5% lemon verbena) was neither like nor dislike in terms of flavor (4.38), taste (4.13), after taste (4.13) and overall acceptability (4.19), while treatment HL9 (55% Hibiscus and 45% lemon verbena) scored the highest in color (6.00), flavor (5.38), taste (5.25), after taste (5.00) and overall acceptability (5.50), which corresponds to “slightly like”.
Figure 3. Sensory characteristics of Hibiscus-lemon verbena blended, commercial and 100% Hibiscus tea.
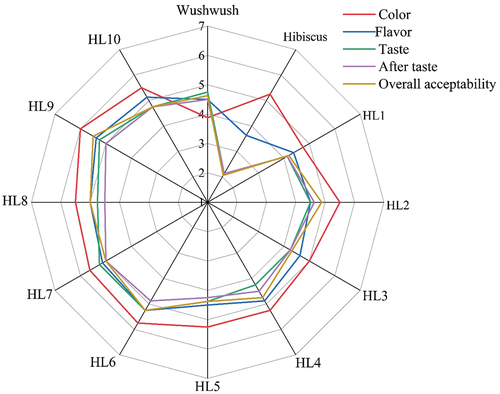
The overall acceptability of blended tea ranged from 4.19 to 5.50, the lowest for HL1 and highest for HL9. The overall acceptability refers to consumer’s preference in terms of all tested attributes (Mendonça et al., Citation2021). With decreasing proportions of Hibiscus, the acceptability of formulated tea tends to increase due to sensory enhancement from lemon verbena. High-concentrated Hibiscus beverages exhibited lower acceptability due to their sourness, even with standardized sweetness (de Castro et al., Citation2021). The sensory acceptability of Hibiscus tea was enhanced by blending it with lemon grass, and lemon peels (Ogbonna et al., Citation2010). Based on the results of sensory tests, alternative Hibiscus-based functional tea with desirable sensory attributes can be formulated by incorporating 10–50% dried leaves of lemon verbena. Generally, the formulation of acceptable quality Hibiscus-based herbal tea requires careful consideration of concentrations and infusion conditions.
3.4. Correlation between variables
depicts the Pearson correlation (r) between measured variables (pH, color, sensory, phytochemicals and antioxidant capacities). A significant positive association (p < .001) between color density and hue tint (r = 0.60) was determined as discussed earlier. The pH was found to have an inverse relationship with DPPH radical scavenging capacities (r = −0.54) and FRAP values (r = −0.73). A similar inverse association between pH and DPPH radical scavenging activity was previously observed (r = −0.75), which may have resulted from the increased concentrations of calyces producing a more acidic intense dark red color (Barajas-Ramírez et al., Citation2021).
Figure 4. Pearson's correlation coefficients of measured variables.
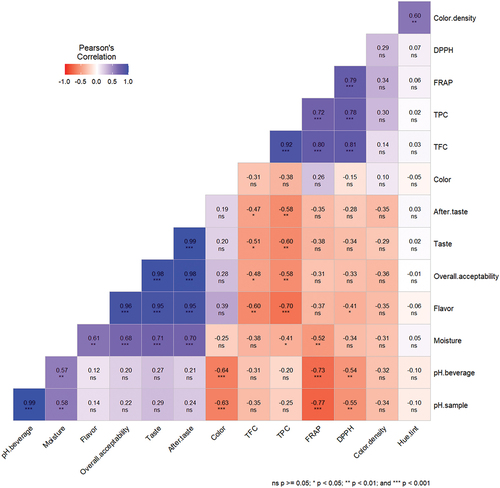
A strong positive correlation between TFC and FRAP (r = 0.80, p < .001) and DPPH (r = 0.81, p < .001) as well as between TPC and FRAP (r = 0.72, p < .001) and DPPH (r = 0.78, p < .001) (). The current results are consistent with previous studies on Hibiscus-based beverages (Bechoff et al., Citation2014; Monteiro et al., Citation2017). The strong positive relationship found between phenolics and antioxidant capacities suggests that phenolic compounds play a major role in free radical scavenging (Fu et al., Citation2011; Patial et al., Citation2019).
Phenolic compounds, including total phenolic, flavonoids, and anthocyanins, are known to have antioxidant properties against oxidative damage by donating electrons to terminate free radical-induced chain reactions. The sensory attributes tested showed positive associations with each other (r > 0.61, p < .01), but negative associations with phytochemicals, r values ranging from −0.47 to −0.70. Higher concentrations of phenolic compounds in samples could result in bitter taste and astringent mouthfeel (Bechoff et al., Citation2014).
4. Conclusion
This study provides background information on a possible Hibiscus-based functional tea alternative for regularly consumed Camellia sinensis tea. The pH, total flavonoids, total phenolics, IC50 and FRAP values for blended tea decreased along with the concentrations of calyces. The blended tea demonstrated variable increases and decreases in color density and hue tint. Understanding the associations between phytochemicals and sensory tests of Hibiscus-based products helps to improve consumer acceptance and advances the development of new products. Based on the results, Hibiscus calyces can be combined with 10–45% dried lemon verbena leaves to produce functional tea with acceptable sensory attributes (color, flavor, taste, after taste and overall acceptability), optimal total flavonoids, phenolics, and antioxidant scavenging capacities. Moreover, in vivo experiments and possible interactions between phytochemicals need to be considered.
Author’s contribution
Tegene Atlaw: Laboratory analysis, data management, formal analysis, visualization, full writeup, and edition. Abdela Befa Kinki: Conceptualization, proposal writing, supervision, and edition. Dessie Belay: Sample preparation and laboratory analysis. Beriso Meiso: Sample preparation, laboratory analysis, and reagent preparation. Tamene Haile: Laboratory analysis and data management. Calvin R. Wei: Formal analysis and review editing.
Ethical approval
This article does not contain any studies with human participants or animals performed by any of the authors.
Consent to participate
Corresponding and all the co-authors are willing to participate in this manuscript.
Consent for publication
All authors are willing for publication of this manuscript
Data availability
Even though adequate data has been given in the form of tables and figures, however, all authors declare that if more data is required then the data will be provided on a request basis.
Acknowledgment
The authors are thankful to Ethiopia Institute of Agricultural Research, Ethiopia for providing literature collection facilities, which helped in the study
Disclosure statement
No potential conflict of interest was reported by the author(s).
Additional information
Funding
References
- Ahiduzzaman, M., Jamini, T. S., & Islam, A. A. (2021). Roselle (hibiscus sabdariffa L.): Processing for value addition. In Roselle (pp. 53–10). Academic Press.
- AOAC. (2016). Official Methods of Analysis of AOAC International. AOAC International.
- Bahramsoltani, R., Rostamiasrabadi, P., Shahpiri, Z., Marques, A. M., Rahimi, R., & Farzaei, M. H. (2018). Aloysia citrodora Paláu (lemon verbena): A review of phytochemistry and pharmacology. Journal of Ethnopharmacology, 222, 34–51. https://doi.org/10.1016/j.jep.2018.04.021
- Barajas-Ramírez, J. A., Gutiérrez-Salomón, A. L., & Sáyago-Ayerdi, S. G. (2021). Concentration of roselle (hibiscus sabdariffa L) and sucrose in beverages: Effects on physicochemical characteristics and acceptance. Food Science and Technology International, 27(6), 563–571. https://doi.org/10.1177/1082013220973796
- Bechoff, A., Cissé, M., Fliedel, G., Declemy, A. L., Ayessou, N., Akissoe, N., Touré, C., Bennett, B., Pintado, M., Pallet, D., & Tomlins, K. I. (2014). Relationships between anthocyanins and other compounds and sensory acceptability of hibiscus drinks. Food Chemistry, 148, 112–119. https://doi.org/10.1016/j.foodchem.2013.09.132
- Benzie, I. F., & Strain, J. J. (1996). The ferric reducing ability of plasma (FRAP) as a measure of “antioxidant power”: The FRAP assay. Analytical Biochemistry, 239(1), 70–76. https://doi.org/10.1006/abio.1996.0292
- Borrás-Linares, I., Fernández-Arroyo, S., Arráez-Roman, D., Palmeros-Suárez, P. A., Del Val-Díaz, R., Andrade Gonzáles, I., Fernández-Gutiérrez, A., Gómez-Leyva, J. F., & Segura-Carretero, A. (2015). Characterization of phenolic compounds, anthocyanidin, antioxidant and antimicrobial activity of 25 varieties of Mexican Roselle (hibiscus sabdariffa). Industrial Crops and Products, 69, 385–394. https://doi.org/10.1016/j.indcrop.2015.02.053
- Brand-Williams, W., Cuvelier, M. E., & Berset, C. L. W. T. (1995). Use of a free radical method to evaluate antioxidant activity. LWT-Food Science and Technology, 28(1), 25–30. https://doi.org/10.1016/S0023-6438(95)80008-5
- Chang, C. C., Yang, M. H., Wen, H. M., & Chern, J. C. (2002). Estimation of total flavonoid content in propolis by two complementary colorimetric methods. Journal of Food and Drug Analysis, 10(3). https://doi.org/10.38212/2224-6614.2748
- Cissé, M., Bohuon, P., Sambe, F., Kane, C., Sakho, M., & Dornier, M. (2012). Aqueous extraction of anthocyanins from hibiscus sabdariffa: Experimental kinetics and modeling. Journal of Food Engineering, 109(1), 16–21. https://doi.org/10.1016/j.jfoodeng.2011.10.012
- Cisse, M., Vaillant, F., Acosta, O., Dhuique-Mayer, C., & Dornier, M. (2009). Thermal degradation kinetics of anthocyanins from blood orange, blackberry, and roselle using the arrhenius, eyring, and ball models. Journal of Agricultural and Food Chemistry, 57(14), 6285–6291. https://doi.org/10.1021/jf900836b
- de Castro, J. M. C., Alves, C. A. N., de LimaSantos, K., de Oliveira Silva, E., da Silva Araújo, Í. M., & deVasconcelos, L. B. (2021). Elaboration of a mixed beverage from hibiscus and coconut water: An evaluation of bioactive and sensory properties. International Journal of Gastronomy and Food Science, 23, 100284. https://doi.org/10.1016/j.ijgfs.2020.100284
- De Heer, N. E. A. (2011). Formulation and sensory evaluation of herb tea from Moringa oleifera, Hibiscus sabdariffa and Cymbopogon citratus [Doctoral dissertation].
- Deli, M., Ndjantou, E. B., Ngatchic Metsagang, J. T., Petit, J., Njintang Yanou, N., & Scher, J. (2019). Successive grinding and sieving as a new tool to fractionate polyphenols and antioxidants of plants powders: Application to Boscia senegalensis seeds, dichrostachys glomerata fruits, and hibiscus sabdariffa calyx powders. Food Science & Nutrition, 7(5), 1795–1806. https://doi.org/10.1002/fsn3.1022
- Duque-Soto, C., Expósito-Almellón, X., García, P., Pando, M. E., Borrás-Linares, I., & Lozano-Sánchez, J. (2023). Extraction, characterization, and bioactivity of phenolic compounds—A case on hibiscus genera. Foods, 12(5), 963. https://doi.org/10.3390/foods12050963
- Fasoyiro, S. B., Babalola, S. O., & Owosibo, T. (2005). Chemical composition and sensory quality of fruit-flavoured roselle (hibiscus sabdariffa) drinks. World Journal of Agricultural Sciences, 1(2), 161–164.
- Frank, T., Netzel, G., Kammerer, D. R., Carle, R., Kler, A., Kriesl, E., Bitsch, I., Bitsch, R., & Netzel, M. (2012). Consumption of hibiscus sabdariffa L. aqueous extract and its impact on systemic antioxidant potential in healthy subjects. Journal of the Science of Food and Agriculture, 92(10), 2207–2218. https://doi.org/10.1002/jsfa.5615
- Fu, L., Xu, B. T., Gan, R. Y., Zhang, Y., Xu, X. R., Xia, E. Q., & Li, H. B. (2011). Total phenolic contents and antioxidant capacities of herbal and tea infusions. International Journal of Molecular Sciences, 12(4), 2112–2124. https://doi.org/10.3390/ijms12042112
- Hein, K. A., Jaeger, S. R., Carr, B. T., & Delahunty, C. M. (2008). Comparison of five common acceptance and preference methods. Food Quality and Preference, 19(7), 651–661. https://doi.org/10.1016/j.foodqual.2008.06.001
- Herranz-López, M., Olivares-Vicente, M., Boix-Castejón, M., Caturla, N., Roche, E., & Micol, V. (2019). Differential effects of a combination of hibiscus sabdariffa and lippia citriodora polyphenols in overweight/obese subjects: A randomized controlled trial. Scientific Reports, 9(1), 2999. https://doi.org/10.1038/s41598-019-39159-5
- Izquierdo-Vega, J. A., Arteaga-Badillo, D. A., Sánchez-Gutiérrez, M., Morales-González, J. A., Vargas-Mendoza, N., Gómez-Aldapa, C. A., Castro-Rosas, J., Delgado-Olivares, L., Madrigal-Bujaidar, E., & Madrigal-Santillán, E. (2020). Organic acids from Roselle (hibiscus sabdariffa L.)—A brief review of its pharmacological effects. Biomedicines, 8(5), 100. https://doi.org/10.3390/biomedicines8050100
- Juhari, N. H., Martens, H. J., & Petersen, M. A. (2021). Changes in physicochemical properties and volatile compounds of roselle (hibiscus sabdariffa L.) calyx during different drying methods. Molecules, 26(20), 6260. https://doi.org/10.3390/molecules26206260
- Killedar, S. G., Pawar, A. V., & Suresh Killedar, C. (2017). Preparation of herbal tea from mulberry leaves. Journal of Medicinal Plants Studies, 5(2), 325–328.
- Lee, Y. S., Yang, W. K., Kim, H. Y., Min, B., Caturla, N., Jones, J., Park, Y. C., Lee, Y. C., & Kim, S. H. (2018). Metabolaid® combination of lemon verbena and hibiscus flower extract prevents high-fat diet-induced obesity through AMP-activated protein kinase activation. Nutrients, 10(9), 1204. https://doi.org/10.3390/nu10091204
- M’be, C. U., Scher, J., Gaiani, C., Amani, N. G. G., & Burgain, J. (2023). Impact of processing and physicochemical parameter on hibiscus sabdariffa calyxes biomolecules and antioxidant activity: From powder production to reconstitution. Foods, 12(16), 2984. https://doi.org/10.3390/foods12162984
- Meher, J. M., Mazumdar, A., & Keshav, B. (2019). Rheological and functional properties of Roselle (hibiscus sabdariffa) leaves puree. Potravinarstvo, 13(1), 46–57. https://doi.org/10.5219/929
- Mendonça, G. R., de Sousa Campos, R., Abreu, V. K. G., de Oliveira Lemos, T., & Pereira, A. L. F. (2021). Effect of extract or infusion of leaves of the hibiscus sabdariffa L. In the production and storage of the beverage blends with cupuassu: Physico-chemical and sensory acceptance. Journal of Food Science and Technology, 58(6), 2395–2405. https://doi.org/10.1007/s13197-020-04752-4
- Mgaya, K. B., Remberg, S. F., Chove, B. E., & Wicklund, T. (2014). Physio-chemical, mineral composition and antioxidant properties of Roselle (hibiscus sabdariffa L.) extract blended with tropical fruit juices. African Journal of Food, Agriculture, Nutrition and Development, 14(3), 8963–8978. https://doi.org/10.18697/ajfand.63.13475
- Monteiro, M. J. P., Costa, A. I. A., Fliedel, G., Cissé, M., Bechoff, A., Pallet, D., Tomlins, K., & Pintado, M. M. E. (2017). Chemical-sensory properties and consumer preference of hibiscus beverages produced by improved industrial processes. Food Chemistry, 225, 202–212. https://doi.org/10.1016/j.foodchem.2016.11.127
- Mostafa, H. S. (2023). Production of low-tannin hibiscus sabdariffa tea through D-optimal design optimization of the preparation conditions and the catalytic action of new tannase. Food Chemistry, 17, 100562. https://doi.org/10.1016/j.fochx.2023.100562
- Naithani, V., Nair, S., & Kakkar, P. (2006). Decline in antioxidant capacity of Indian herbal teas during storage and its relation to phenolic content. Food Research International, 39(2), 176–181. https://doi.org/10.1016/j.foodres.2005.07.004
- Nguyen, Q. V., & Chuyen, H. V. (2020). Processing of herbal tea from roselle (hibiscus sabdariffa L.): Effects of drying temperature and brewing conditions on total soluble solid, phenolic content, antioxidant capacity and sensory quality. Beverages, 6(1), 2. https://doi.org/10.3390/beverages6010002
- Nguyen, Q. V., & Eun, J. B. (2011). Antioxidant activity of solvent extracts from Vietnamese medicinal plants. Journal of Medicinal Plants Research, 5(13), 2798–2811.
- Ogbonna, A. I., Makut, M. D., Gyar, S., Ogbonna, C. L. C., & Wogu, I. (2010). Indigenous tea production from calyces of hibiscus sabdariffa L. Nigerian Journal of Biotechnology, 21, 35–40.
- Ogundele, O. M., Awolu, O. O., Badejo, A. A., Nwachukwu, I. D., & Fagbemi, T. N. (2016). Development of functional beverages from blends of hibiscus sabdariffa extract and selected fruit juices for optimal antioxidant properties. Food Science & Nutrition, 4(5), 679–685. https://doi.org/10.1002/fsn3.331
- Paraíso, C. M., Januário, J. G. B., Mizuta, A. G., dos Santos, S. S., dos Santos Magon, T. F., Ogawa, C. Y. L., de Oliveira Silva, J. V., Sato, F., Visentainer, J. V., Mikcha, J. M. G, & Madrona, G. S. (2021). Comparative studies on chemical stability, antioxidant and antimicrobial activity from hot and cold hibiscus (hibiscus sabdariffa L.) calyces tea infusions. Journal of Food Measurement and Characterization, 15(4), 3531–3538. https://doi.org/10.1007/s11694-021-00936-4
- Patial, P. K., Sharma, A., Kaur, I., & Cannoo, D. S. (2019). Correlation study among the extraction techniques, phytochemicals, and antioxidant activity of nepeta spicata aerial part. Biocatalysis and Agricultural Biotechnology, 20, 101275. https://doi.org/10.1016/j.bcab.2019.101275
- Phan, M. A. T., Paterson, J., Bucknall, M., & Arcot, J. (2018). Interactions between phytochemicals from fruits and vegetables: Effects on bioactivities and bioavailability. Critical Reviews in Food Science and Nutrition, 58(8), 1310–1329. https://doi.org/10.1080/10408398.2016.1254595
- Preciado-Saldaña, A. M., Abraham Domínguez-Avila, J., Fernando Ayala-Zavala, J., Villegas-Ochoa, M. A., Sáyago-Ayerdi, S. G., Wall-Medrano, A., González-Córdova, A.F., & González-Aguilar, G. A. (2019). Formulation and characterization of an optimized functional beverage from hibiscus (hibiscus sabdariffa L.) and green tea (camellia sinensis L.). Food Science and Technology International, 25(7), 547–561. https://doi.org/10.1177/1082013219840463
- Ramirez‐Rodrigues, M. M., Plaza, M. L., Azeredo, A., Balaban, M. O., & Marshall, M. R. (2011). Physicochemical and phytochemical properties of cold and hot water extraction from hibiscus sabdariffa. Journal of Food Science, 76(3), C428–C435. https://doi.org/10.1111/j.1750-3841.2011.02091.x
- Ramirez, M. M., Wysocki, A. F., Ramirez, M. A., Sims, C. A., & Balaban, M. O. (2010). Sensory and marketing characteristics of a hibiscus beverage. Journal of Food Distribution Research, 41(3), 52–62.
- Santos, E. M., Sánchez-Ortega, I., Lorenzo, J. M., Domínguez, R., Munekata, P. E., Falfán-Cortés, R. N., Ibarra, I.S., & Rangel-Vargas, E. (2022). Use of hibiscus sabdariffa calyxes in meat products. Frontiers in Animal Science, 3, 876042. https://doi.org/10.3389/fanim.2022.876042
- Serna, A., Marhuenda, J., Arcusa, R., Pérez-Piñero, S., Sánchez-Macarro, M., García-Muñoz, A. M., Victoria-Montesinos, D., Cánovas, F., & López-Román, F. J. (2022). Effectiveness of a polyphenolic extract (lippia citriodora and hibiscus sabdariffa) on appetite regulation in overweight and obese grade I population: An 8-week randomized, double-blind, cross-over, placebo-controlled trial. European Journal of Nutrition, 61(2), 1–17. https://doi.org/10.1007/s00394-021-02678-x
- Singh, M., Thrimawithana, T., Shukla, R., & Adhikari, B. (2021). Extraction and characterization of polyphenolic compounds and potassium hydroxycitrate from hibiscus sabdariffa. Future Foods, 4, 100087. https://doi.org/10.1016/j.fufo.2021.100087
- Singleton, V. L., Orthofer, R., & Lamuela-Raventós, R. M. (1999). Analysis of total phenols and other oxidation substrates and antioxidants by means of folin-ciocalteu reagent. Methods in Enzymology, 299, 152–178.
- Villani, T., Juliani, H. R., Simon, J. E., & Wu, Q. L. (2013). Hibiscus sabdariffa: Phytochemistry, quality control, and health properties. In African natural plant products volume II: Discoveries and challenges in chemistry, health, and nutrition (pp. 209–230). American Chemical Society.
- Wu, H. Y., Yang, K. M., & Chiang, P. Y. (2018). Roselle anthocyanins: Antioxidant properties and stability to heat and pH. Molecules, 23(6), 1357. https://doi.org/10.3390/molecules23061357
- Yusri, N. M., Chan, K. W., Iqbal, S., & Ismail, M. (2012). Phenolic content and antioxidant activity of hibiscus cannabinus L. seed extracts after sequential solvent extraction. Molecules, 17(11), 12612–12621. https://doi.org/10.3390/molecules171112612