
ABSTRACT
The uric acid (UA) induced damage influences human health and deserves attention. The purpose of this study was to investigate the protective effects of Skipjack trypsin hydrolysate (STH) and its Maillard product (STH-M) and the segmentation of STH-M (STH-M-S) against UA-induced HK-2 cells. The CCK8 assay was used to detect cell viability and flow cytometry was performed to check cell apoptosis and cell cycle and the functional mechanism was analyzed via transcriptome. The results showed STH-M-S could significantly improve the cell viability and inhibit cell apoptosis. Meanwhile, STH-M-S could influence the membrane and protein binding and regulate metabolic-related and immune-related pathways to deal with UA stress. Functional genes contained NEBL, KCNJ16, ABCA12, CLDN2, FLRT3, PRODH, KLHL14, VEPH1, HPGD (down regulated) and FOXL1, SCG5 (up regulated). Collectively, our results suggested that STH-M-S can alleviate cell injury induced by UA. STH-M-S could be an alternative to be applied for the treatment of hyperuricemia.
1. Introduction
Uric acid (UA) is commonly known as a metabolic product of endogenous and exogenous purine and its accumulation in human body usually leads to hyperuricemia, which results in a series of pathophysiological reactions in the kidney like inflammation, nephrolithiasis, and apoptosis, leading to the injury of renal tubular epithelium cells and ultimately causing kidney damage and initiation of a repair response (Dissanayake et al., Citation2020; Ferenbach & Bonventre, Citation2015; Gobe & Johnson, Citation2007). The hazards of hyperuricemia are not only located in the kidney but also spread over the body. The major clinical relevance of it is gout, as well as inducing coronary heart disease (CHD) (Gertler et al., Citation1951), cardiovascular disease (CVD) (Wu et al., Citation2016), diabetic microvascular diseases (Ching-Chao et al., Citation2016) and gut metabolism disorder (Singh et al., Citation2012), etc. By now, hyperuricemia has become a serious threat to human health, and the prevalence is gradually increased due to the changes in people’s lifestyles and eating habits (Choi & Curhan, Citation2008; Hyon et al., Citation2004; Yu et al., Citation2016). As reported by the National Health and Nutrition Examination Survey, the population of hyperuricemia in global is increasing and in most countries such as China, Italy, Korea, America, and so on, the proportion had reached above 11% in 2018 and continues to rise (Kim et al., Citation2018). Hyperuricemia has become a healthy problem to be attenuated urgently and some medicines like allopurinol, febuxostat, pegloticasehad, and benzbromarone have been used to treat the phenomenon. However, it was reported that these treatments would induce side effects for the skin (Hung et al., Citation2005), liver (Rees et al., Citation2014), and other organs (Burns & Wortmann, Citation2011), which reveals the fact that investigation of new alternatives against the disease would be still on the way to be expanded.
In mammals, UA is mostly excreted via the kidney and its imbalance will result in renal damage (Dissanayake et al., Citation2020). As a consequence, the kidney is a primary easy-diseased organ once the body is caught in hyperuricemia and should be paid more attention when exploring the protective effects of some novel matter on UA-induced injury of the body. As of today, scientists found that flavonoids (Cos et al., Citation1998), phenolic acids classes (Honda et al., Citation2014), alkaloids (Sang et al., Citation2017), and probiotics (Bai et al., Citation2014) are potential to be applied for hyperuricemia treatment. Previous studies also uncovered that the protein hydrolysates and peptides obtained from some fish could protect the body from injury caused by disruption of UA metabolism (Li et al., Citation2018; Murota et al., Citation2014). What’s more, the recent issues revealed these substances pre-processed with Maillard owned higher capacity of anti-inflammatory and antioxidant than that of the untreated one (Hashemi et al., Citation2021; Jian et al., Citation2023; Zhang et al., Citation2022), supporting that such substances may possess favourable effects on the disease treatment but needs verification.
The skipjack (Katsuwonus pelamis) is an important captured fish with a large yield due to its high nutritional value. The edible from the body mainly consist of white muscle and dark muscle. The white muscle can be efficiently utilized and proceeded into cans, fish meat floss, grilled fillet, etc. However, the dark muscle is mostly treated as waste because of its bad taste (Chen & Chen, Citation2017). The pity is that the dark muscle contains many nutrients such as functional protein/peptides, docosahexaenoic acid (DHA), eicosapentaenoic acid (EPA), heme iron, and so on (Su et al., Citation2015). Studies showed that the skipjack peptide prepared by enzymatic hydrolysis had xanthine oxidase inhibition ability and could reduce UA (Zhong et al., Citation2021). While, in terms of enhancing the rational utilization of this fish resource and benefiting people’s health, whether the dark muscle can be further developed and applied for hyperuricemia treatment is an interesting project to be inquired. The human kidney-2 cell (HK-2) plays an important role in the repair of epithelial morphology and kidney function and is exquisitely sensitive to UA-induced injury (Kumar, Citation2018). Protecting the HK-2 from injury can contribute to improving the tolerance of the kidney against hyperuricemia, or in other words, it helps to treat hyperuricemia. In our study, the protein hydrolysates were obtained from skipjack and some of them were processed with Maillard reaction. The products were used to investigate their potential effects on the UA-induced injury of HK-2, hoping to propose a new alternative as a potential treatment for hyperuricemia, as well as uncover the biological macromolecule which functioned in the case.
2. Materials and methods
2.1. Cell culture
The HK-2 was obtained from BeNa Culture Collection Co., Ltd. (Henan, China) and cultured in RPMI-1640 medium containing 10% fetal bovine serum (Procell Life Science & Technology Co., Ltd., China). About 1 × 10⁵ cells were seeded in 21 cm2 of growth area in the dish (diameter: 60 mm, height: 15 mm), then all were incubated at 37°C in a humidified atmosphere with 5% CO2 and 95% air. The medium was renewed every 2 days. The blood counting chamber was used for cell quantification, and cells in the logarithmic growth phase were used for the following tests.
2.2. Solution of skipjack dark muscle
The skipjack dark muscle was provided by the XingYe Co., Ltd (Zhoushan, Zhejiang Province, China) and stored at −20°C until use. Three products were prepared: the skipjack trypsin hydrolysate (STH), its Maillard product (STH-M), and the segmentation of STH-M (STH-M-S), and their characterization were shown in Figures S1–S3. The STH was prepared according to the method used in our previous study (Song et al., Citation2012). Briefly, the skipjack dark muscle was thawed and then mixed with distilled water at a ratio of 1:3 (w/v), as well as 1% trypsin (4000 U/g, Nanning Doing Higher Bio-tech Co., Ltd. Guangxi, China), finally hydrolyzed for 4 h at conditions of medium temperature 55 ± 0.5°C and pH 8.0 ± 0.1 unit. The mixtures were subsequently inactivated at 85–90°C for 35 min, followed by centrifugation at 4000 rpm for 10 min to obtain the supernatant as the hydrolysates, and then lyophilized and stored at −20°C for use.
Some hydrolysates were allocated to Maillard reaction with D-(+)-Xylose as the STH-M. Briefly, the hydrolysates and D-(+)-Xylose were mixed with a ratio of 2:1 by weight (based on our findings, unpublished). Then, the mixture of solids was dissolved in distilled water (10%, w⁄v) and heated at 120°C for 90 min. Afterwards, the STH-M was cooled at room temperature, then lyophilized and stored at −20°C for further investigation.
The STH-M-S was produced based on the STH-M. According to our analysis of the STH-M samples, the principal component was found within the molecular weight range of 200–1000, accounting for a proportion of 54.07%. Additionally, previous research has demonstrated that peptides within this weight range exhibit favorable bioactivity (Chakniramol et al., Citation2022). Therefore, in order to achieve our objective, we selectively extracted and lyophilized the coil film containing peptides with molecular weights ranging from 200 to 1000 to prepare STH-M-S.
2.3. Experiment design
2.3.1. IC50 assay
Weighing a moderate dosage of UA powder (purchased from Sigma-Aldrich, U.S.A.) into 1 M NaOH solution, followed by the addition of appropriate RPMI-1640 medium without fetal bovine serum (FBS). The pH is then adjusted to neutral using a 1 M citric acid solution, resulting in the preparation of uric acid solutions with different concentrations (1.8 mM, 3.6 mM, 5.4 mM, 9.1 mM, 10.9 mM, 14.5 mM, and 18.2 mM).The 50% inhibiting concentration (IC50) of the UA solution for the cells survival was assessed to determine the UA concentration used in the followed trial and the result displayed the concentration was 4.207 mM.
2.3.2. Grouping
The HK-2 cells were randomly divided into eight groups and each group was treated as follows for 24 h: (1) Control group (treated with RPMI-1640 medium containing 10% FBS); (2) STH group (treated with STH); (3) STH-M group (treated with STH-M); (4) STH-M-S group (treated with STH-M-S); (5) Model group (treated with 4.207 mM UA); (6) UA+STH group (treated with 4.207 mM UA for 24 h followed by STH); (7) UA+STH-M group (treated with 4.207 mM UA for 24 h followed by STH-M); (8) UA+STH-M-S group (treated with 4.207 mM UA for 24 h followed by STH-M-S).
2.4. Parameters detection and method
2.4.1. Determination of cell viability
Cell viability was determined according to the Cell Counting Kit-8 (7 Sea Biotech, China). Firstly, the effects of the dose (4.207 mM) of UA solution stimulation lasting for different times (12, 24, 48 h) on HK-2 cytotoxicity were determined to obtain the cell viability curve (Lan, Citation2017). Then, the effects of STH, STH-M, and STH-M-S on cell viability were assessed, as well as the remission capacity of STH, STH-M, and STH-M-S on the viability of HK-2 cells exposed to UA. Cell viability was expressed as the ratio between the absorbance of treatment and control groups.
2.4.2. Cell morphology observation
Morphological characteristics of the cells were observed using an optical microscope (Olympus Corporation, Japan) in the bright field with a magnification of 40×.
2.4.3. Cell apoptosis detection and cell cycle analysis
Cell apoptosis was tested according to the method introduced in the report (Mukhopadhyay et al., Citation2007). Briefly, for each group, 5 × 10⁵ cells were resuspended in a staining solution (containing 500 μL of binding buffer, 5 μL of Annexin V-FITC, and 5 μL of PI) and incubated for 15 min at 25°C in dark. The cells were subsequently washed three times with PBS and resuspended in 200 μL PBS. Finally, the mean fluorescence intensity (20,000 counts) of FITC and PI dyes was monitored by the flow cytometry (Beckman Coulter Life Science, U.S.A.) in the FITC and PE channels. The cells with positive Annexin V - FITC signals and negative PI signals were regarded as early apoptotic cells, while those with positive Annexin V- FITC signals and PI signals were considered as late apoptotic or necrotic cells.
The cell cycle was analyzed based on description (Blasi et al., Citation2016). Collecting 5 × 10⁵ cells of each group into 300 μL of PBS and then fixed with chilled ethanol for 1 h or overnight at −20°C. After washed with PBS, cells were incubated with RNase A for 30 min at 37°C, followed by staining with PI for 30 min at 4°C. The data was acquired in CytoFlex flow cytometer (Beckman Coulter) by FlowJo V10 software for a minimum of 1 × 10⁴ cells per sample.
2.5. Transcriptome analysis
2.5.1. RNA extraction, library construction and sequencing
Total RNA was extracted using Trizol reagent (Thermofisher, U.S.A.) following the manufacturer’s procedure. In our current study, only three groups (the Control group, Model group and UA+STH-M-S group) of RNA samples from the HK-2 cells were sequenced. All the raw reads have been submitted in the SRA database, NCBI (accession number: PRJNA970661).
2.5.2. Differentially expressed genes (DEGs) analysis
The clean reads were aligned to the reference genome (ftp://ftp.ensembl.org/pub/release-101/fasta/homo_sapiens/dna/) using Tophat2. Subsequently, gene expression levels were quantified using RSEM software and reported as fragments per kilobase of exon model per million mapped fragments (FPKM). Finally, differential expression analysis was conducted for the following comparisons: Model group vs. Control group, UA+STH-M-S group vs. Control group, and UA+STH-M-S group vs. Model group, utilizing DESeq2 software (Robinson et al., Citation2010). The genes with the false discovery rate (FDR) parameter below 0.05 and absolute fold change ≥2 were considered differentially expressed genes.
2.5.3. Gene ontology (GO) and Kyoto Encyclopedia of Genes and Genomes (KEGG) pathway enrichment analysis of the DEGs
The GO and KEGG enrichment analyses of the DEGs were operated. All DEGs were mapped to GO terms in the GO database (http://www.geneontology.org/). The number of DEGs in each term was calculated, and the hypergeometric test was used to define the significant enrichment. The KEGG enrichment analyses of the DEGs were operated by the methods introduced by Mao et al. (Citation2005). Both significant enrichment levels of GO and KEGG were set at q-value < 0.05.
2.6. qRT-PCR verification
A total of 18 genes (6 genes from the comparison of Model group vs. Control group, 6 from UA+STH-M-S group vs. Control group, and the rest from UA+STH-M-S group vs. Model group) were chosen randomly to verified the veracity and reliability of the transcriptomic result by qRT-PCR. These genes obeyed that the FPKM > 1. The primers were designed by the software Primer 5.0 according to their transcripts, and the GAPDH was selected as the reference gene. All the primers information were displayed in Table S1. Melting curve analysis was performed to confirm the primer specificity, and three replications for each gene were operated on to obtain the Ct value. The annealing temperature was at 60°C. The relative expression levels of the target genes were calculated according to the -ΔΔCt method (Zhang et al., Citation2023).
2.7. Statistical analysis
All data were presented as the mean ± SEM (standard error of the mean) and analyzed by SPSS 21 software (SPSS, Chicago, IL, U.S.A.). The figures were graphed by GraphPad Prism 8.0 software. The difference between pairwise groups was tested for statistical significance by student’s t-test, while one-way ANOVA followed by Bonferroni correction were used for multiple comparisons. The two-sided unpaired t-test was operated for non-parametric data comparison. A value of p < .05 was considered to be statistically significant.
3. Results
3.1. Cell viability influenced by uric acid, STH, STH-M and STH-M-S
Effects of different concentrations of UA (1.8–18.2 mM), STH (0.1–6.4 mg/mL), STH-M (0.025–1.6 mg/mL), and STH-M-S (0.1–5 mg/mL) on inducing cytotoxicity of HK-2 cells were firstly investigated. The results showed the death of HK-2 cell owned characterization of concentration and time dependency after the treatment of UA (). After 24 h of UA treatment, the HK-2 cells exhibited the maximum cell death as treated with 18.2 mM UA, and the IC50 value of UA was evaluated to be 4.207 ± 0.325 mM. In addition, when the concentration of UA was from 3.63 mM to 5.45 mM, the needle-like crystals (), which existed alone or directly penetrated the HK-2 cells appeared after 24 h of culture. A further handle indicated that 4.207 mM UA would decline the HK-2 cell survival rate to 38.6% during 48 h, and at 24 h, the cell survival rate could reach above 50% but below 60% (). All above suggested that for constructing the model, the UA concentration was 4.207 mM and the observation time was 24 h.
Figure 1. Effects of UA, STH, STH-M and STH-M-S on the viability, morphology and cell cycle of HK-2 cells. (a–e), effects of UA, STH, STH-M and STH-M-S on viability of HK-2 cell (n = 6). Different letters in the column mean significant difference (p < .05). (a) dose-dependent cytotoxicity of UA: cells were treated with 1.8–18.2 mM UA for 24 h. (b) time-dependent cytotoxicity of UA: cells were treated with 4.0 mM UA for 12–48 h. (c) effect of STH on cell viability: cells were treated with 0.1–6.4 mg/mL STH for 24 h. (d) effect of STH-M on cell viability: cells were treated with 0.025–1.6 mg/mL STH-M for 24 h. (e) effect of STH-M-S on cell viability: cells were treated with 0.025–1.6 mg/mL STH-M-S for 24 h. (f–g), protective effects of different concentrations of STH-M and STH-M-S on uric acid-induced HK-2 cell damage on the morphological characteristics and cell viability. (f) the viability of HK-2 cells. Data are plotted as mean ± SD (n = 6). The same letter means no significant difference. (g) cell morphology was observed using an optical microscope at a magnification of 40×. Red arrows indicate apoptotic cells and yellow arrows indicate urate crystals. UA+ STH-M LD group: cells were treated with 0.06 mg/mL STH-M, UA+ STH-M HD group: cells were treated with 0.10 mg/mL STH-M, UA+ STH-M-S LD group: cells were treated with 0.13 mg/mL STH-M, UA+ STH-M-S HD group: cells were treated with 0.26 mg/mL STH-M-S. (h) Cell cycle analysis performed after 24 h of treatment with uric acid and 0.1 mg/mL STH-M and 0.26 mg/mL STH-M-S (after 24 h of uric acid treatment). The same letter means no significant difference (n = 3).
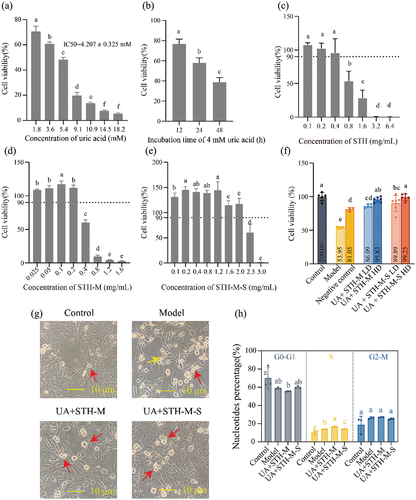
The results about effects of STH, STH-M and STH-M-S on the viability of HK-2 cells showed that when HK-2 cells were treated with STH (0.1–0.4 mg/mL) (), STH-M (0.025–0.2 mg/mL) () or STH-M-S (0.1–2.0 mg/mL) () for 24 h, the cell viability maintained above 90%. The results suggest that STH, STH-M, and STH-M-S exhibited no cytotoxicity at concentrations below 0.4, 0.2, and 2.0 mg/mL, respectively. Meanwhile, at a concentration of 0.1 mg/mL, STH as well as STH-M could increase the cell survival rate to the highest among their correspondence groups, while for STH-M-S, the concentration was at 0.2 mg/mL. Taking the innocuous into account, STH-M and STH-M-S seemed to have a better influence on the cell viability than that of STH.
3.2. Morphology observation and cell viability influenced by STH-M and STH-M-S under uric acid stimulation
Based on the effects of STH-M and STH-M-S on the HK-2 cell viability, morphological observation was further used to evaluate the influence of STH-M and STH-M-S on the HK-2 cells exposed to 4.207 mM UA. Seen from the , cells from the model group which exposed to 4.207 mM UA were shrunk, compared to the cells of control group. Meanwhile, amounts of suspended cells and needle-like crystals were observed in the model group. However, cells from the UA+STH-M and UA+STH-M-S groups demonstrated that the severity of cell damages was significantly reduced, and crystals were attenuated or even disappeared, indicating that treatment with STH-M and STH-M-S could effectively protect the HK-2 cell from injury by UA so as to maintain the morphological characteristics of cells.
The influences of STH-M and STH-M-S against UA on the HK-2 cell were focused and the results displayed that during 24 h, the cell viability of the model group was significantly decreased (p < .05) () but could be recovered to 81.05% once co-functioned with the RMPI-1640 medium (containing 10% FBS). Compared to the model group, STH-M and STH-M-S could significantly antagonize the bad effect of UA when the concentrations were at 0.1 mg/mL and 0.26 mg/mL, respectively (p < .05), with the cell viability increased by 41.88% and 45.30%. According to the phenomenon, in the current study, we used STH-M-S (0.26 mg/mL) and STH-M (0.1 mg/mL) treatments to further analyze the underlying mechanisms.
3.3. Cell apoptosis and cell cycle influenced by STH-M and STH-M-S under uric acid stimulation
The double-stained with Annexin V-FITC/PI and flow cytometry were used to analyze effects of STH-M and STH-M-S on apoptosis of uric acid-induced HK-2 cells. The results were shown in . After 24 h, HK-2 cells in the model group had the highest percentage of apoptotic among the four groups (p < .05), with the apoptosis rate reaching 22.92%. No significant difference was found within the other three groups (p > .05).
Figure 2. Effects of treatment with STH-M and STH-M-S on the apoptosis of HK-2 cells exposed to uric acid. (a) control group. (b) cells were treated with 4.207 mM uric acid for 24 h. (c) cells were treated with 4.207 mM uric acid for 24 h and then treated with 0.1 mg/mL STH-M for 24 h. (d) cells were treated with 4.207 mM uric acid for 24 h and then treated with 0.26 mg/mL STH-M-S for 24 h. (e) Percentage of apoptotic cells.
The distribution of various phases of cell cycle in the four groups were analyzed using propidium iodide (PI) staining and flow cytometry (). In the model group cells, the population of different phases of the cells was G0-G1 (58.85 ± 0.94%), S (13.76 ± 0.20%), and G2-M (26.35 ± 1.02%). For the UA+STH-M group cells, the values of the different phases were 55.49 ± 0.42%, 16.61 ± 0.30% and 27.02 ± 0.45%, respectively, and for the UA+ STH-M-S, they were 61.52 ± 1.28%, 9.42 ± 0.69% and 27.42 ± 0.65%. This showed that treatment with UA induced a decrease in the G0-G1 population but a significant promotion in the S population. After the UA-damaged cells were treated with STH-M, the proportion of the G0-G1 stage was further decreased and significantly different from that of the control group, while the proportion of S stage was significantly increased. In contrast, the damaged cells treated with STH-M-S showed a significant decrease in the S phase and showed no difference from the control group. These results indicated that UA-induced cell injury caused cell cycle arrest in S phase and inhibited cell proliferation, and on the contrary, STH-M-S treatment could restore the S phase to the same level as that of the control group, indicating that STH-M-S could inhibit S phase arrest and promote cell proliferation, but the degree of S phase arrest was increased after being treated with STH-M. This was in contrast to the results of cell proliferation assay and apoptosis assay. The current study demonstrated that transient cell cycle arrest (G0/G1) could alleviate renal tubular epithelial cell damage and reduce renal interstitial inflammatory cell infiltration. To investigate the reasons for this result, RNA-seq was subsequently performed on STH-M-S treated cells.
3.4. Analysis of differentially expressed genes (DEGs)
The comparison of Model group vs Control group showed that UA induced a total of 790 DEGs with 325 genes up regulated and 465 genes down regulated, for the comparison of UA+STH-M-S group vs. Control group, the total DEGs were 2603 and the numbers of up-regulated or down-regulated genes were 938 and 1665, respectively, and for the UA+STH-M-S group vs. Model group, the corresponding numbers were 1381, 334, and 1047. Interaction Venn diagram analyses showed that a total of 435 DEGs was shared between the comparisons of Model group vs. Control group and UA+STH-M-S group vs. Control group, similarly for the comparisons between Model group vs. Control group and UA+STH-M-S group vs. Model group, the number of the shared DEGs was 158, and for the comparison between UA+STH-M-S group vs. Model group and UA+STH-M-S group vs. Control group, it was 831. Fifty-seven co-expressed DEGs appeared within the three comparisons, and eleven of them might participate in repairing UA-induced injury of HK-2 cell according to their trends of up-down regulation ( and ).
Figure 3. The number of differentially expressed genes in each comparison followed by the interaction venn diagram analyses among these comparisons (a) and. The gene expression levels assessed by qRT-PCR (b). **means the significant difference between-in the two groups for the gene, and nsmeans no significant difference.
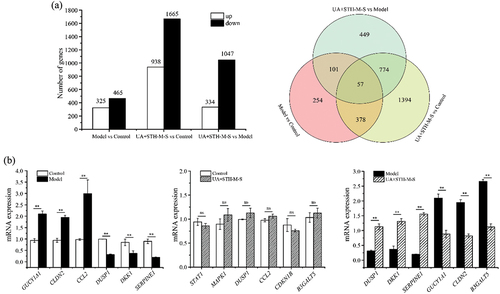
Table 1. The shared differentially expressed genes information among different comparisons.
3.5. GO enrichment analysis of the DEGs
The GO enrichment analyses of the DEGs from different comparisons were operated and the results which displayed the major enrichment were shown in Figure S4. For Model group vs Control group, the DEGs were mostly enriched in the molecular function, biological process and cellular component with the number of the terms reached 168, 968 and 80 (p-value < .05), respectively. In the biological processed, the up-regulated DEGs were mainly enriched in the obsolete oxidation-reduction process (GO:0055114), signal transduction (GO:0007165) and ion transport (GO:0006811); the down-regulated DEGs were mainly enrich into GO:0007165, multicellular organism development (GO:0007275) and cell adhesion (GO:0007155). In the cellular components, the up-regulated DEGs were mostly enriched in the membrane (GO:0016020), cytoplasm (GO:0005737), integral component membrane (GO:0016021) and cytosol (GO:0005829); the down-regulated DEGs were mostly enriched in the GO:0016020, GO:0016021 and plasma membrane (GO:0005886). In the molecular functions, both the up-regulated and down-regulated DEGs were mostly enriched in protein binding (GO:0005515) and metal ion binding (GO:0046872). In UA+STH-M-S group vs Control group, the DEGs could be enriched into 1364 terms of biological process, 251 terms of molecular function and 201 terms of cellular component (p-value < .05). In the biological processed, the up-regulated DEGs were mainly enriched in the GO:0007165 and GO:0055114, and the down-regulated DEGs could be enriched into GO:0007165 and GO:0007275. In the cellular components, the up-regulated could be mainly enriched into GO:0016020, GO:0005737 and nucleus (GO:0005634), and the down-regulated DEGs could be mainly enriched into GO:0016020, integral component of membrane (GO:0016021) and GO:0005886. In the molecular functions, the up-regulated and down-regulated DEGs could be mostly enriched into GO:0005515 and GO:0046872. In UA+STH-M-S group vs Model group, the DEGs could be enriched into 1364 terms of biological process, 266 terms of molecular function and 128 terms of cellular component (p-value < .05). In the biological processed, the up-regulated DEGs were mainly enriched in the GO:0007165, positive regulation of transcription by RNA polymerase II (GO:0045944) and negative regulation of apoptotic process (GO:0043066), the down-regulated DEGs were mainly enriched into GO:0007165, regulation of transcription, DNA-templated (GO:0006355) and GO:0007275. In the cellular components, the up-regulated DEGs were mostly enriched in the GO:0016020, GO:0005737 and GO:0005886; the down-regulated DEGs were mostly enriched in the GO:0016020, GO:0005737 and GO:0016021. In the molecular functions, both the up-regulated and down-regulated DEGs were mostly enriched in GO:0005515 and GO:0046872.
3.6. KEGG analysis of the DEGs
The results of the KEGG pathway enrichment for the DEGs from different comparisons were displayed in Figures S5–S7. For the comparison of Model group vs Control group (Figure S5), the DEGs could be enriched into 200 pathways. The top 20 of pathways included the metabolic-related pathways like Mineral absorption, Ubiquinone and other terpenoid-quinone biosynthesis, cholesterol metabolism, etc. and immune-related pathways like Complement and coagulation cascades, Cytokine-cytokine receptor interaction, FoxO signaling pathway and TGF-beta signaling pathway. The up-regulated DEGs were mainly enriched into the metabolic-related pathways like Mineral absorption, Ubiquinone and other terpenoid-quinone biosynthesis, Pancreatic secretion, etc. and the down-regulated DEGs were mainly enriched into immune-related pathways, especially in Complement and coagulation cascades.
For the comparison of UA+STH-M-S group vs Control group (Figure S6), the DEGs could be enriched into 317 pathways. The top 20 of the pathways included the metabolic-related pathways like Pyrimidine metabolism, Metabolic pathways, Mineral absorption and other Protein digestion and absorption, etc. and immune-related pathways like Complement and coagulation cascades, AMPK signaling pathway and Calcium signaling pathway. The up-regulated DEGs were mainly enriched into the metabolic-related pathways like Pyrimidine metabolism, Mineral absorption, Argine and proline metabolism and other PPAR signaling pathway, Tyrosine metabolism, etc. and the down-regulated DEGs were mainly enriched into immune-related pathways, especially in AMPK signaling pathway, TGF-beta signaling pathway, P13K-Akt signaling pathway and FoxO signaling pathway, etc.
For the comparison of UA+STH-M-S group vs Model group (Figure S7), the DEGs could be enriched into 305 pathways. The top 20 of the pathways included the metabolic-related pathways like Metabolic pathways, Tryptophan metabolism, Steroid biosynthesis, Biosynthesis of amino acids and other Glycine, serine and threonine metabolism, etc. and immune-related pathways like PPAR signaling pathway, Complement and coagulation cascades and Inflammatory mediator regulation of TRP channels. The up-regulated DEGs were mainly enriched into the immune-related pathways like Complement and coagulation cascades, MAPK signaling pathway, P13K-Akt signaling pathway, PPAR signaling pathway and Cytokine-cytoking receptor interaction, etc. And some others metabolic-related pathways like Tryptophan metabolism also including in up-regulated DEGs. And the down-regulated DEGs were mainly enriched into metabolic-related pathways, especially in Metabolic pathways, Steroid biosynthesis, Glycine, serine and threonine metabolism and Carbon metabolism, etc.
3.7. Genes verification by qRT-PCR
A total of 18 genes (6 genes per comparison, for the comparison of UA+STH-M-S group vs Control group, we chose the interested genes without significant difference to verify) were selected out to verify the result of RNA sequencing (). All the genes relative expression levels demonstrated a similar trend with the RNA-seq, indicating that the results provided by the RNA-seq are generally reliable.
4. Discussion
In this study, we report the protective effects of STH-M-S on uric acid-induced HK-2 cells and explore the underlying mechanisms. Our results demonstrated that treatment with STH-M and STH-M-S under UA exposure increased cell viability, inhibited cell apoptosis, and conserved cell morphology, and for these aspects, the STH-M-S was more efficient. Studies showed that urate crystals would emerge when the uric acid concentration in vivo reached a high level (Piao et al., Citation2022); similarly, in our current study, the urate crystals existed once the cells were subjected to the UA stimulation, but after STH-M and STH-M-S treatment, the crystals were declined or disappeared, indicating that the two substances could help decrease UA. In vivo, excess uric acid would cause oxidative stress, renin over-secretion, and uric acid salts deposited in the renal tubules, causing uric acid nephropathy(Isaka et al., Citation2016; Zhang et al., Citation2023). In our study, results supported by the Flow cytometry showed that HK-2 cells were induced-apoptotic by UA, while the apoptosis rate of HK-2 cells was significantly decreased after co-functioned with STH-M and STH-M-S, providing an evidence that the two substances contributed to protecting the cells from UA-induced injury, and it was probably related to the effects of the substances on xanthine oxidase inhibition (Li et al., Citation2018; Murota et al., Citation2014; Zhong et al., Citation2021), which echoed the constituent biological macromolecule of STH-M-S owning many binding site of the special amino acids that benefited inhibiting the activity of XOD, and finally reduced UA level (Skibo & Edward, Citation1986; Zhao et al., Citation2021). The cell viability index demonstrated that STH-M and STH-M-S might enhance the ability of HK-2 cells to regeneration.
The transcriptomic was operated to uncover the mechanism of the protective effects of Maillard products of skipjack trypsin hydrolysate on UA-induced injury. In the current study, the STH-M-S displayed the highest protective effect on the UA-induced cells among all groups, hence, only the three groups including the Model, the Control and the UA+STH-M-S were chosen to make interaction analyses. The qRT-PCR results displayed a similar trend with that of the RNA-seq, which indicated that the results of the transcriptome analyses were reliable. According to the comparison of Model group vs Control group, the up-regulated genes were mainly enriched into the metabolic-related pathways, especially in the mineral absorption, this was probably related to the high UA concentration and enhanced the metabolic of the mineral (Afsar et al., Citation2019; Piao et al., Citation2022). High UA stimulation would induce some injury (Isaka et al., Citation2016; Zhang et al., Citation2023), which would disrupt the immune system and subsequently result in some immune-related genes being down-regulated; therefore, in this comparison, the down-regulated genes were mainly enriched into the immune-related pathways. This guess was also supported by the GO enrichment results which the up-regulated genes could be enriched into ion transport (GO:0006811) and ion binding (GO:0046872, GO:0008270, GO:0005509) and the down-regulated genes could be enriched into apoptotic process (GO:0043066, GO:0006915). For the indexes of cell viability, apoptotic rate and nucleotides percentage, cells from the UA+STH-M-S group and the Control group had similar changing trends compared to the Model group. To some extent, this indicated that cells from the UA+STH-M-S group were as healthy as cells from the Control group, which revealed that STH-M-S could play an essential role in neutralizing UA stimulation. The concentration of STH-M-S below 2.0 mg/mL could significantly improve cell viability (), while at concentration of 0.26 mg/mL, after co-functioned with 4.207 mM UA, the cell viability level was similar to that of the control group (). Speculated from the GO and KEGG enrichment results, STH-M-S might influence the membrane and protein binding and regulate metabolic-related and immune-related pathways that help the cells to deal with UA stress.
Interacted analyses among the three groups uncovered 57 shared DEGs and 11 of them showed different up-down regulation trend when compared to the control group, demonstrating these genes participated in regulating the opposite physiologic functions between the UA+STH-M-S and UA situation. Previous studies revealed the gene NEBL overexpression usually occurred in cases of heart disease (Enkhsaikhan et al., Citation2012) and intestine cancer (Qiu et al., Citation2018); the gene KCNJ16 was found up-regulated in the mouse cuprizone model (Najbauer et al., Citation2018) and similarly for the up-regulation of genes ABCA12 (Simon et al., Citation2016), CLDN2 (Zhu et al., Citation2023), FLRT3 (Yamada et al., Citation2019), PRODH (Yan et al., Citation2018), etc, all of which were reported to function in the unhealthy body. However, these genes were also up regulated in our current study, implicating that UA stimulation caused some damage, and this also coincided with what the results of cell viability and apoptosis had displayed. The gene FOXL1 (Jia et al., Citation2018) can play an important role in inhibiting the development of some lesions. All these variation provided evidence that UA had terrible effects on HK-2 cells while the STH-M-S could protect the cell from injury by UA, which proposed that the STH-M-S could be an alternative to be applied for the treatment of hyperuricemia.
5. Conclusions
In summary, this study revealed the protective effects of Maillard products of skipjack trypsin hydrolysate on uric acid-induced injury of human kidney-2 cells. The results showed the product STH-M-S owned high cell protection efficiency and could improve the cell viability and inhibit cell apoptosis. The STH-M-S consisted of many active peptides containing some special amino acid binding sites that help the cell neutralize the UA damage. Meanwhile, it might influence the membrane and protein binding, as well as regulate metabolic-related and immune-related pathways that help the cells to deal with UA stress and the functional genes contained NEBL, KCNJ16, ABCA12, CLDN2, FLRT3, PRODH, KLHL14, VEPH1, HPGD (down regulated) and FOXL1, SCG5 (up regulated).
Credit authorship contribution statement
Authors listed in the manuscript have made substantial contributions to the conception and design of the work. Yurou Chu analyzed the data, draft the manuscript, conceptualize and validate the study. Jipeng Sun and Liang Chen participated in the investigation and samples collection. Ru Song and Xiaoyu Zou participated in the sequencing analyses. Jiaxing Wang designed, conceived and conceptualize the study, and reviewed the manuscript. All authors had read the manuscript and approved the final version to be published.
Supplemental Material
Download MS Word (8.9 MB)Disclosure statement
No potential conflict of interest was reported by the author(s).
Supplementary material
Supplemental data for this article can be accessed online at https://doi.org/10.1080/19476337.2024.2352580
Additional information
Funding
References
- Afsar, B., Sag, A. A., Oztosun, C., Kuwabara, M., Cozzolino, M., Covic, A., & Kanbay, M. (2019). The role of uric acid in mineral bone disorders in chronic kidney disease. Journal of Nephrology, 32(5), 709–10. https://doi.org/10.1007/s40620-019-00615-0
- Bai, Y. H., Jiang, Y. F., & Jiang, Y. S. (2014). Lactobacillus bulgaricus mutants decompose uremic toxins. Renal Failure, 36(5), 790–794. https://doi.org/10.3109/0886022X.2014.890111
- Blasi, T., Hennig, H., Summers, H. D., Theis, F.J., Cerveira, J., Patterson, J. O., Davies, D., Filby, A., Carpenter, A. E., & Rees, P.(2016). Label-free cell cycle analysis for high-throughput imaging flow cytometry. Nature Communications, 7(1), 10256. https://doi.org/10.1038/ncomms10256
- Burns, C. M., & Wortmann, R. L. (2011). Gout therapeutics: New drugs for an old disease. The Lancet, 377(9760), 165–177. https://doi.org/10.1016/S0140-6736(10)60665-4
- Chakniramol, S., Wierschem, A., Cho, M.-G., & Bashir, K. M. I. (2022). Physiological and clinical aspects of bioactive peptides from marine animals. Antioxidants, 11(5), 1021. https://doi.org/10.3390/antiox11051021
- Chen, Y., & Chen, X. (2017). Reviews on skipjack (Katsuwonus pelamis) fishery in the west-central Pacific Ocean. Journal of Guangdong Ocean University, 2017(5), 34–43. https://doi.org/10.3969/j.issn.1673-9159.2017.05.006
- Ching-Chao, L., Lin, P. C., Lee, M. Y., Chen, S. C., Shin, S. J., Hsiao, P.J., Lin, K. D., & Hsu, W. H. (2016). Association of serum uric acid concentration with diabetic retinopathy and albuminuria in Taiwanese patients with type 2 diabetes mellitus. International Journal of Molecular Sciences, 17(8), 1248. https://doi.org/10.3390/ijms17081248
- Choi, H. K., & Curhan, G. (2008). Soft drinks, fructose consumption, and the risk of gout in men: Prospective cohort study. BMJ: British Medical Journal, 336(7639), 309–312. https://doi.org/10.1136/bmj.39449.819271.BE
- Cos, P., Ying, L., Calomme, M., Hu, J. P., Cimanga, K., Van Poel, B., Pieters, L., Vlietinck, A. J., & Berghe, D. V. (1998). Structure−activity relationship and classification of flavonoids as inhibitors of xanthine oxidase and superoxide scavengers. Journal of Natural Products, 61(1), 71–76. https://doi.org/10.1021/np970237h
- Dissanayake, L. D. O. A., Spires, D. R., Palygin, O., & Staruschenko, A. (2020). Effects of uric acid dysregulation on the kidney. American Journal of Physiology-Renal Physiology, 318(5), F1252–F1257. https://doi.org/10.1152/ajprenal.00066.2020
- Enkhsaikhan, P., Takuro, A., Sibylle, A., Anne-Cecile, H., Ken, T., Shinichi, N., Kearney, D. L., Taylor, M. D., Terasaki, F., Bos, J. M., & Bos, J. M. (2012). Molecular basis for clinical heterogeneity in inherited cardiomyopathies due to myopalladin mutations. Human Molecular Genetics, 21(9), 2039–2053. https://doi.org/10.1093/hmg/dds022
- Ferenbach, D. A., & Bonventre, J. V. (2015). Mechanisms of maladaptive repair after AKI leading to accelerated kidney ageing and CKD. Nature Reviews Nephrology, 11(5), 264–276. https://doi.org/10.1038/nrneph.2015.3
- Gertler, M. M., Garn, S. M., & Levine, S. A. (1951). Serum uric acid in relation to age and physique in health and in coronary heart disease. Annals of Internal Medicine, 34(6), 1421–1431. https://doi.org/10.7326/0003-4819-34-6-1421
- Gobe, G. C., & Johnson, D. W. (2007). Distal tubular epithelial cells of the kidney: Potential support for proximal tubular cell survival after renal injury. The International Journal of Biochemistry & Cell Biology, 39(9), 1551–1561. https://doi.org/10.1016/j.biocel.2007.04.025
- Hashemi, S. M. B., Jafarpour, D., & Jouki, M. (2021). Improving bioactive properties of peach juice using lactobacillus strains fermentation: Antagonistic and anti-adhesion effects, anti-inflammatory and antioxidant properties, and Maillard reaction inhibition. Food Chemistry, 365, 130501. https://doi.org/10.1016/j.foodchem.2021.130501
- Honda, S., Kawamoto, S., Tanaka, H., Kishida, H., Kitagawa, M., Nakai, Y., Abe, K., & Hirata, D. (2014). Administered chrysanthemum flower oil attenuates hyperuricemia: Mechanism of action as revealed by DNA microarray analysis. Bioscience, Biotechnology, and Biochemistry, 78(4), 655–661. https://doi.org/10.1080/09168451.2014.890028
- Hung, S. L., Chung, W. H., Liou, L. B., Chu, C. C., Lin, M., Huang, H. P., Lin, Y. L., Lan, J. L., Yang, L. C., Hong, H. S., & Chen, M. J. (2005). HLA-B*5801 allele as a genetic marker for severe cutaneous adverse reactions caused by allopurinol. Proceedings of the National Academy of Sciences of the United States of America, 102(11), 4134–4139. https://doi.org/10.1073/pnas.0409500102
- Hyon, K. C., Atkinson, K., Karlson, E. W., Willett, W., & Curhan, G. (2004). Purine-rich foods, dairy and protein intake, and the risk of gout in men. New England Journal of Medicine, 350(11), 1093–1103. https://doi.org/10.1056/NEJMoa035700
- Isaka, Y., Takabatake, Y., Takahashi, A., Saitoh, T., & Yoshimori, T. (2016). Hyperuricemia-induced inflammasome and kidney diseases. Nephrology, Dialysis, Transplantation: Official Publication of the European Dialysis and Transplant Association - European Renal Association, 31(6), 890–896. https://doi.org/10.1093/ndt/gfv024
- Jia, Z., Wan, F., Zhu, Y., Shi, G., Zhang, H., Dai, B., & Ye, D. (2018). Forkhead‑box series expression network is associated with outcome of clear‑cell renal cell carcinoma. Oncology Letters, 15(6), 8669–8680. https://doi.org/10.3892/ol.2018.8405
- Jian, D., Huang, Z., Yang, M., Huang, Y., Ma, S., & Fang, Y. (2023). Review and prospect of Maillard reaction products from food-derived protein hydrolysates/peptides and saccharides in food application and research. Food Science, 44(1), 305–318. https://kns.cnki.net/kcms/detail/11.2206.TS.20220830.1120.006.html
- Kim, Y., Kang, J., & Kim, G. T. (2018). Prevalence of hyperuricemia and its associated factors in the general Korean population: An analysis of a population-based nationally representative sample. Clinical Rheumatology, 37(9), 2529–2538. https://doi.org/10.1007/s10067-018-4130-2
- Kumar, S. (2018). Cellular and molecular pathways of renal repair after acute kidney injury. Kidney Internnational, 93(1), 27–40. https://doi.org/10.1016/j.kint.2017.07.030
- Lan, L. (2017). Observe protective effects and mechanism of Cerodendranthus spicatus on renal damage in hyperuricaemia mice and gouty nephropathy rat. Guangzhou University of Chinese Medicine, China. Available from CNKI.
- Li, Y., Kang, X., Li, Q., Shi, C., Lian, Y., Yuan, E., Zhou, M., & Ren, J. (2018). Anti-hyperuricemic peptides derived from bonito hydrolysates based on in vivo hyperuricemic model and in vitro xanthine oxidase inhibitory activity. Peptides, 107, 45–53. https://doi.org/10.1016/j.peptides.2018.08.001
- Mao, X., Cai, T., Olyarchuk, J. G., & Wei, L. (2005). Automated genome annotation and pathway identification using the KEGG orthology (KO) as a controlled vocabulary. Bioinformatics, 21(19), 3787–3793. https://doi.org/10.1093/bioinformatics/bti430
- Mukhopadhyay, P., Rajesh, M., Hask贸, G. R., Hawkins, B. J., Madesh, M., & Pacher, P. (2007). Simultaneous detection of apoptosis and mitochondrial superoxide production in live cells by flow cytometry and confocal microscopy. Nature Protocols, 2(9), 2295–2301. https://doi.org/10.1038/nprot.2007.327
- Murota, I., Taguchi, S., Sato, N., Park, E. Y., Nakamura, Y., & Sato, K. (2014). Identification of antihyperuricemic peptides in the proteolytic digest of shark cartilage water extract using in vivo activity-guided fractionation. Journal of Agricultural and Food Chemistry, 62(11), 2392–2397. https://doi.org/10.1021/jf405504u
- Najbauer, J., Martin, N. A., Nawrocki, A., Molnar, V., Elkjaer, M. L., Thygesen, E. K., Palkovits, M., Acs, P., Sejbaek, T., Nielsen, H. H., Hegedus, Z., Sellebjerg, F., & Illes, Z. (2018). Orthologous proteins of experimental de- and remyelination are differentially regulated in the CSF proteome of multiple sclerosis subtypes. Public Library of Science ONE, 13(8), e0202530. https://doi.org/10.1371/journal.pone.0202530
- Piao, W., Bo, Y. C., Zhao, L. Y., & Yu, D. M. (2022). Status of serum uric acid and hyperuricemia among adults in China: China Nutrition and Health Surveillance (2015). Biomedical and Environmental Sciences, 35(10), 911–920. https://doi.org/10.3967/bes2022.118
- Qiu, X., Feng, J. R., Wang, F., Chen, P. F., Chen, X. X., Zhou, R., Chang, Y., Liu, J., & Zhao, Q. (2018). Profiles of differentially expressed genes and overexpression of NEBL indicates a positive prognosis in patients with colorectal cancer. Molecular Medicine Reports, 17(2), 3028–3034. https://doi.org/10.3892/mmr.2017.8210
- Rees, F., Hui, M., & Doherty, M. (2014). Optimizing current treatment of gout. Nature Reviews Rheumatology, 10(5), 271–283. https://doi.org/10.1038/nrrheum.2014.32
- Robinson, M. D., McCarthy, D. J., & Smyth, G. K. (2010). edgeR: A bioconductor package for differential expression analysis of digital gene expression data. Bioinformatics, 26(1), 139–140. https://doi.org/10.1093/bioinformatics/btp616
- Sang, M., Du, G., Hao, J., Wang, L., Liu, E., Zhang, Y., Wang, T., Gao, X., & Han, L. (2017). Modeling and optimizing inhibitory activities of nelumbinis folium extract on xanthine oxidase using response surface methodology. Journal of Pharmaceutical & Biomedical Analysis, 139, 37–43. https://doi.org/10.1016/j.jpba.2017.02.048
- Simon, M., Zhang, L., Ferreyros, M., Feng, W., Hupe, M., Crumrine, D. A., Chen, J., Elias, P. M., Holleran, W. M., Niswander, L., Hohl, D. and Williams, T., & Roop, D. R. (2016). Defects in stratum corneum desquamation are the predominant effect of impaired ABCA12 function in a novel mouse model of harlequin ichthyosis. Public Library of Science ONE, 11(8), e0161465. https://doi.org/10.1371/journal.pone.0161465
- Singh, S. R., Hosomi, A., Nakanishi, T., Fujita, T., Tamai, I., & Singh, S. R. (2012). Extra-renal elimination of uric acid via intestinal efflux transporter BCRP/ABCG2. Public Library of Science ONE, 7(2), e30456. https://doi.org/10.1371/journal.pone.0030456
- Skibo, E. B., & Edward, B. (1986). Noncompetitive and irreversible inhibition of xanthine oxidase by benzimidazole analogues acting at the functional flavin adenine dinucleotide cofactor. Biochemistry, 25(15), 4189–4194. https://doi.org/10.1021/bi00363a004
- Song, R., Wei, R., Zhang, B., & Wang, D. (2012). Optimization of the antibacterial activity of half-fin anchovy (setipinna taty) hydrolysates. Food & Bioprocess Technology, 5(5), 1979–1989. https://doi.org/10.1007/s11947-010-0505-3
- Su, Y., Zhang, C., Cao, W., Zheng, H., Hao, J., & Yanchun, L. (2015). Analysis and evaluation of nutritional components in ordinary muscle and dark muscle of three species of tuna from South China Sea. Journal of Guangdong Ocean University, 35(3), 87–93. https://doi.org/10.3969/j.issn.1673-9159.2015.03.013
- Wu, A. H., Gladden, J. D., Ahmed, M., Ahmed, A., & Filippatos, G. (2016). Relation of serum uric acid to cardiovascular disease. International Journal of Cardiology, 213, 4–7. https://doi.org/10.1016/j.ijcard.2015.08.110
- Yamada, M., Fujita, Y., Hayano, Y., Hayakawa, H., Baba, K., Mochizuki, H., & Yamashita, T. (2019). Increased expression of fibronectin leucine-rich transmembrane protein 3 in the dorsal root ganglion induces neuropathic pain in rats. The Journal of Neuroscience, 39(38), 7615–7627. https://doi.org/10.1523/jneurosci.0295-19.2019
- Yan, Y., Chang, L., Tian, H., Wang, L., Zhang, Y., Yang, T., Li, G., Hu, W., Shah, K., Chen, G., & Guo, Y. (2018). 1-pyrroline-5-carboxylate released by prostate cancer cell inhibit T cell proliferation and function by targeting SHP1/cytochrome c oxidoreductase/ROS axis. Journal for ImmunoTherapy of Cancer, 6(1), 148. https://doi.org/10.1186/s40425-018-0466-z
- Yu, S., Yang, H., Guo, X., Zhang, X., Zhou, Y., Ou, Q., Zheng, L., & Sun, Y. (2016). Prevalence of hyperuricemia and its correlates in rural Northeast Chinese population: From lifestyle risk factors to metabolic comorbidities. Clinical Rheumatology, 35(5), 1207–1215. https://doi.org/10.1007/s10067-015-3051-6
- Zhang, M., Cui, R., Zhou, Y., Ma, Y., Jin, Y., Gou, X., Yang, J., & Wu, X. (2023). Uric acid accumulation in the kidney triggers mast cell degranulation and aggravates renal oxidative stress. Toxicology, 483, 153387. https://doi.org/10.1016/j.tox.2022.153387
- Zhang, Q., Liu, H., Ma, Y., Sun, Y., & Wang, S. (2022). Advances in protein/peptide modification by Maillard reaction. Food and Fermentation Industries, 48(18), 306–313. https://doi.org/10.13995/j.cnki.11-1802/ts.029892
- Zhang, Y., Qin, X., Yang, Y., Li, J., Li, X., Zou, X., Huang, Z., & Huang, S. (2023). Ginkgo biloba extract attenuates cisplatin-induced renal interstitial fibrosis by inhibiting the activation of renal fibroblasts through down-regulating the HIF-1α/STAT3/IL-6 pathway in renal tubular epithelial cells. Phytomedicine, 115, 154809. https://doi.org/10.1016/j.phymed.2023.154809
- Zhao, G., Li, T., Song, M., Sun, H., Li, J., Xie, J., & Deng, S. (2021). Screening of xanthine oxidase inhibitory peptide from bass myosin by molecular docking. Journal of Chinese Institute of Food Science and Technology, 21(6), 81–91. https://doi.org/10.16429/j.1009-7848.2021.06.010
- Zhong, H., Abdullah, Zhang, Y., Deng, L., Zhao, M., Tang, J., Zhang, H., Feng, F., & Wang, J. (2021). Exploring the potential of novel xanthine oxidase inhibitory peptide (ACECD) derived from Skipjack tuna hydrolysates using affinity-ultrafiltration coupled with HPLC–MALDI-TOF/TOF-MS. Food Chemistry, 347, 129068. https://doi.org/10.1016/j.foodchem.2021.129068
- Zhu, X., Bu, J., Zhu, T., & Jiang, Y. (2023). Targeting KK-LC-1 inhibits malignant biological behaviors of triple-negative breast cancer. Journal of Translational Medicine, 21(1), 184. https://doi.org/10.1186/s12967-023-04030-9