
ABSTRACT
Autism Spectrum Disorder (ASD) is a severe neurodevelopmental disorder. To enhance the understanding of the gut microbiota structure in ASD children at different ages as well as the relationship between gut microbiota and fecal metabolites, we first used the 16S rRNA sequencing to evaluate the gut microbial population in a cohort of 143 children aged 2–13 years old. We found that the α-diversity of ASD group showed no significant change with age, while the TD group showed increased α-diversity with age, which indicates that the compositional development of the gut microbiota in ASD varies at different ages in ways that are not consistent with TD group. Recent studies have shown that chronic constipation is one of the most commonly obvious gastrointestinal (GI) symptoms along with ASD core symptoms. To further investigate the potential interaction effects between ASD and GI symptoms, the 30 C-ASD and their aged-matched TD were picked out to perform metagenomics analysis. We observed that C-ASD group displayed decreased diversity, depletion of species of Sutterella, Prevotella, and Bacteroides as well as dysregulation of associated metabolism activities, which may involve in the pathogenesis of C-ASD. Consistent with metagenomic analysis, liquid chromatography-mass spectrometry (LC/MS) revealed some of the differential metabolites between C-ASD and TD group were involved in the metabolic network of neurotransmitters including serotonin, dopamine, histidine, and GABA. Furthermore, we found these differences in metabolites were associated with altered abundance of specific bacteria. The study suggested possible future modalities for ASD intervention through targeting the specific bacteria associated with neurotransmitter metabolism.
Introduction
Autistic Spectrum Disorder (ASD) is a severe neurodevelopmental disorder that is primarily characterized by abnormal behavioral symptoms: social interaction impairment, stereotyped behavior, and restricted interests.Citation1 With its prevalence increasing dramatically over the past decades, ASD now affects 1 out of 59 children in the United States.Citation2 According to national census data on handicapped individuals, China also has an increased prevalence with ASD first on its list of top mental disabilities.Citation3
Accumulating evidences demonstrates that gastrointestinal (GI) symptoms, such as gaseousness, diarrhea, and constipation, often co-occurred with ASD core symptoms in children with ASD.Citation4–Citation6 Moreover, recent studies have shown that changes in gut microbiota can modulate the gastrointestinal physiology, immune function, and even behavior through the gut-microbiome-brain axis.Citation7–Citation9 Thus, these co-occurring gastrointestinal symptoms have prompted researchers to examine the gut microbial composition of ASD children and determine their potential role in promoting and reflecting ASD symptoms.Citation10–Citation13
A few cohort studies with a small number of subjects have found that individuals with ASD have different gut bacterial communities from typically developing (TD) individuals.Citation14–Citation16 Early life perturbations of the developing gut microbiota can impact neurodevelopment and potentially lead to adverse mental health outcomes later in life.Citation17 Furthermore, a recent clinical study reported that, within the ASD population, behavior abnormality may have a different relationship with GI symptoms depending on patient age, which may have overall implications related to the clinical approach to GI disturbances in ASD children.Citation18
Chronic constipation is one of the most commonly obvious gastrointestinal symptoms along with ASD core symptoms. ASD children with constipation have been reported to be associated with increased emergency department visits and inpatient admissions.Citation19 Thus, it still needs to be more thoroughly analyzed whether the abundance and diversity of altered bacteria accompanying ASD with constipation indicates the potential interaction effects between ASD and GI symptoms generated by the dysbiosis of gut microbiota and fecal metabolites.
To expand upon the understanding of the change of gut microbiota structure with age and the relationship between gut microbiota and metabolism in ASD, as well as to develop more objective strategies for ASD diagnosis, the 16S rRNA gene sequencing was used to evaluate the microbial population in a 143 cohort spanning ages 2–13 years-old. Microbiota changes across different ages were further investigated. Aware that gut microbiota and its metabolites may not only be associated with ASD behavioral symptoms, but as well gastrointestinal symptoms, metagenomic analysis of gut microbiota was performed for 30 constipated ASD (C-ASD) and 30 TD participants. To explore the associations among these differential species with fecal metabolites, a correlation analysis between fecal metabolites and individual bacteria was also conducted. Furthermore, their potential effects on fatty acid, amino acid, and neurotransmitter metabolism were discussed.
Results
Information of Cohort children
A total of 143 subjects with clinical diagnosis of ASD children (average age 4.937 ± 0.155; sex, male: female 130:13) were recruited from May of 2016 to August of 2017. Meanwhile, 143 age and sex-matched TD individuals (average age 5.189 ± 0.170; sex, male: female 127:16) who attended annual physical examination were also recruited ( and Table S1). In all of 143 ASD children, 52 ASD children showed constipated symptoms and 5 ASD children showed diarrhea symptoms ( and Table S1).
Table 1. Characteristics of study participants.
Alterations of gut microbiota composition in ASD children based on the 16S rRNA data
The optimized reads ranging from 32,484 to 70,833 were obtained from all samples (Table S2). Rarefaction curves generated from the OTUs (Operational Taxonomic Units) suggested that high sampling coverage (~99%) was achieved in all samples (Figure S1A and Table S2). This indicated that the sequencing depth was sufficient for the investigation of the fecal microbiota. As shown in ), Venn diagram displayed 173 unique OTUs in the TD group and 67 unique OTUs in the ASD group. 1082 OTUs were shared by both groups (). The richness of species (breakaway estimates) at the phylum level was significantly lower in the ASD group than that in the TD group (). However, there were no significant differences in richness between the ASD group and TD group at the genus level (). A Principal Coordinates Analysis (PCoA) was performed to investigate the extent of the similarity of the microbial communities in the two cohorts based on unweighted UniFrac distance metrics (), Bray–Curtis (Figure S1B) and weighted UniFrac distance metrics (Figure S1C). The analysis indicated that the microbiota composition of the ASD group clusters was more heterogeneous and significantly different from that of the TD group.
Figure 1. The shift of gut microbiota in typically developing (TD) and ASD children according to the 16S rRNA data.
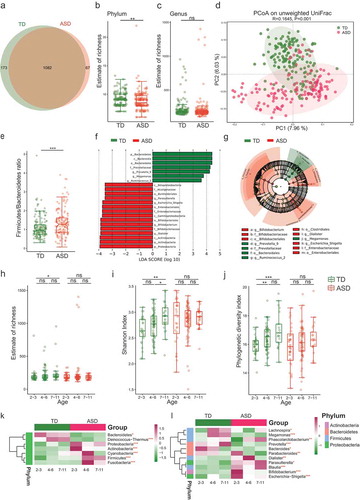
At the phylum level, compared to the TD group, the ASD group was characterized by higher Firmicutes levels and a significantly higher Firmicutes/Bacteroidetes ratio (). A total of 291 OTUs showed differential relative abundance between two groups (Table S3). According to the bacterial community profiles at the genus level, the hierarchical heatmap indicated that the 30 most significant different genera detected in all of the samples showed different patterns between the ASD and TD groups (Figure S1D). The linear discriminant analysis (LDA) distribution diagram analysis (LAD score >3.5) showed a clear alteration of the microbiota characterized by higher Proteobacteria and Actinobacteria levels in ASD individuals (). However, Bacteroidetes levels were significantly decreased in ASD group (). The genera Dialister, Escherichia-Shigella, and Bifidobacterium were more abundant in ASD group, while genus Prevotella 9, Megamonas, and Ruminococcus 2 were more abundant in TD group ().
Recent studies have shown that the development of neurons is closely related to the development of gut microbiota.Citation20 We further assessed the age-related change of bacteria diversity. Different alpha diversity index reflects only one aspect of within-sample diversity; hence, we used three methods to estimate the age-related change in alpha diversity between the two groups. As shown in ), the richness of species (breakaway estimates) showed increased in 7–11 years age subgroup of TD group compared to 2–3 years age subgroup; however, the ASD group showed no change with age growth. Shannon index accounts for both abundance and evenness of species present. As shown in ), the Shannon index at the 4–6 years age subgroup showed no significant change compared to the 2–3 years age subgroup, but the Shannon index at the subgroup of 7–11 years age in TD group showed increased compared to both 2–3 years and 4–6 years age subgroups, respectively. The phylogenetic diversity (PD) index was used to measure the degree of evolutionary divergence between two groups. As shown in ), the PD index of the subgroup of 4–6 years and 7–11 years in TD group was increased compared to 2–3 subgroups, respectively. Similar to that of Shannon and Richness index analysis, the PD index in ASD group showed no significant changes with age. Overall, the result implicated that the development of gut microbiota in ASD group displayed a serious lag status as regard to multiple aspects of diversity.
Moreover, the ASD and TD groups displayed different microbial profiles at different ages at both the phylum and genus levels (,). For example, Bacteroidetes tended to decrease with age in the TD group; however, they remained low in the ASD group regardless of age, meanwhile, Firmicutes and Cyanobacteria increased with age in the TD group but not in the ASD group (). At the genus level, the genera Prevotella, Lachnospira, and Megamonas became more abundant between age 2–3 and age 7–11 in the TD group, while this change was not observed in the ASD group. In the TD group, Bacteroides showed increased abundance at the age of 2–3, and then decreased with age thereafter, while the ASD group showed lower abundance levels at all ages (). The results further suggested that the development of neurons in ASD children may be highly correlated with the impaired dynamic abundance change of specific bacteria.Citation17
ASD children are commonly affected by gastrointestinal symptoms such as abdominal pain, constipation, and diarrhea.Citation21 The proportion of ASD children with gastrointestinal dysfunction in the current study was close to 40% (Table S1). To rule out the constipation effect on gut microbiota, we also compared the gut microbiota composition of 86 NC-ASD with 86 age-matched TD children out of a sample of 143 ASD and TD children, respectively. A total of 196 OTUs showed differential relative abundance between NC-ASD and TD (Table S4). Similar to that of the whole comparison of ASD and TD (), the NC-ASD showed decreased number of OTU (Figure S2A). The estimate of richness index and phylogenetic diversity Index was significantly lower in the NC-ASD group than that in the age-matched TD group, respectively (Figure S2B-C). PCoA analysis indicated that the bacterial communities showed significant differences between the two groups (Figure S2D-E). A differential relative abundance analysis showed the variation of 21 genera between NC-ASD and TD exhibited a similar tendency to alternation pattern between all ASD and TD (Figure S1D and Figure S2F). For example, the increased Escherichia-Shigell and norank_f__Lachnospiraceae in NC-ASD relative to the TD group also displayed the elevated abundance in the whole ASD group relative to TD group. Moreover, the decreased genera in NC-ASD relative to the matched-aged TD group such as Parabacteroides, [Eubacterium]_eligens_group, Megamonas, and Phascolarctobacterium also displayed reduced abundance level in the whole ASD relative to TD group (Figure S1D and Figure S2F). These results indicated these differential genera that showed the same abundance shift between ASD and TD group in spite of the constipation factor might be more directly related to ASD pathogenesis. However, we also found 8 genera which showed increased abundance in ASD relative to TD, such as Dialister, Parasutterella, Christensenellaceae_R-7_group, Coprococcus_2 and Collinsella showed no change in NC-ASD relative to the matched TD, which implicated constipation might add heterogenous characteristics of gut microbiota in ASD.
To identify which microbial changes were associated with constipation in ASD children, we further compared the gut microbiota composition of 30 constipated ASD (C-ASD) and 30 non-constipated ASD children (NC-ASD) out of a sample of 143 ASD children. As shown in Figure S3A, the Venn diagram displayed 56 OTUs for the C-ASD group and 57 OTUs for the NC-ASD group. The estimate of richness index was significantly higher in the C-ASD group than that in the NC-ASD group (Wilcoxon rank-sum test, Figure S3B-C). PCoA analysis indicated that the bacterial communities showed significant differences between the two groups (Figure S3D-E). A total of 86 OTUs showed differential relative abundance between C-ASD and NC-ASD (Table S5). A differential relative abundance analysis showed that Lachnospiraceae_NK4A136, Subdoligranulum, Ruminococcus, Barnesiella, Butyricicoccus, and Ruminiclostridium were significantly increased in C-ASD children (Figure S3F). Meanwhile, the genera Fusobacterium, Acidaminococcus, and Veillonella were markedly enriched in the NC-ASD children (Figure S3F), indicating that these differential genera may be involved in the gastrointestinal symptoms of ASD.
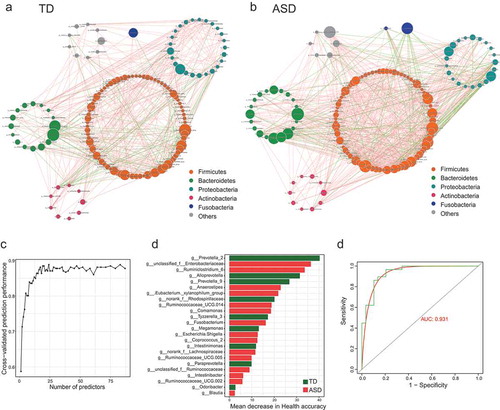
The complex microbial ecosystem of the human intestinal tract is unevenly influenced by individual taxa within different microbial communities.Citation22 To describe potential relationships occurring among bacteria within the gut microbial communities, we further constructed co-occurrence networks of genera from each group based on significant Spearman correlations. The TD and ASD groups mainly featured two co-occurrence networks with scattered genera from five primary phyla (Firmicutes, Bacteroidetes, Proteobacteria, Actinobacteria, and Fusobacteria) (-). The TD group displayed a co-occurrence network with strong positive correlation among genera (). As shown in ), the microbial community of the ASD group featured a more complicated network. The correlation between the microbiota in the ASD group was distinctly increased compared to that of TD group. To quantify such differences, the number of edges (connections) and the centrality of nodes (genera) were counted in the two microbial networks. The TD and ASD groups shared 67 overlapped edges, while 361 and 689 of the edges were specific to the TD and ASD groups, respectively (Figure S4A). The closeness and eigenvector of shared genera were also quite different in the two groups (Figure S4B). Taken together, the above analyses suggest microbial relationships in the ASD group display alternation relative to that of the TD group, further indicating that ASD children show dysbiosis in gut microecology.
Figure 2. Genera are strikingly different across TD and ASD children.
Gut microbiota–based prediction of ASD
Next, to test whether potential diagnostic biomarkers can be used to predict ASD status, we developed a random forest model based on the differential genus with relative abundance >0 in at least 95% samples of TD or ASD groups. The optimal model utilized 24 genera which provided the best discriminatory power (-). These genera in the optimal model were primarily members of the Prevotella 2 (). Based on the above analysis, the distribution of microbial community across TD and ASD showed statistical differences. The out of bag (OOB) error estimate of the model was 9.21% and under the curve (AUC) was 0.931 ()). It is concluded that the prediction model showed a high discriminatory power to predict ASD status.
Metagenomic sequencing revealed significant differences between constipated ASD group and TD group
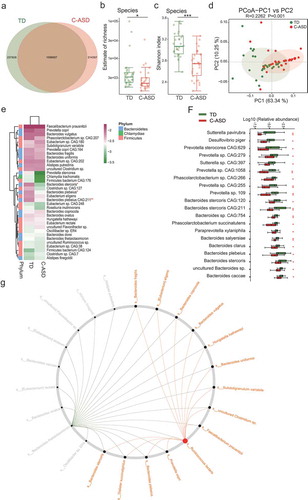
To further investigate the potential interaction effects between ASD and GI symptoms generated, and identify whether gut microbial changes at the species level are associated with genes or functions of gut bacteria in ASD group, metagenomic sequencing was applied to these fecal sample of 30 C-ASD and 30 age-matched TD children. As shown in ) and Figure S5A-C, the samples from the TD group contained 237,828 specific genes, however, only 214,357 specific genes were found in the samples from the C-ASD group. Both species richness and diversity were significantly lower in the C-ASD group than in the TD group, as measured by breakaway and Shannon index analyses (,). The PCoA analysis based on the Euclidean distance matrix revealed striking differences in microbial composition between the C-ASD and TD group at the species level (). Next, we compared the bacterial profile difference between the C-ASD and TD groups. A total of 138 species showed differential relative abundance between two groups (Table S5). Species Bacteroides stercoris, Bacteroides plebeius, and Bacteroides plebeius CAG:211 were significantly decreased in ASD group (Wilcoxon rank-sum test, Table S6 and ). Interestingly, all the top 20 significantly different species were lower in the C-ASD group than in the TD group, including 9 species from Bacteroides, 4 from Prevotella, 2 from Phascolarctobacterium and 1 from Paraprevotella (Wilcoxon rank-sum test, Table S6 and )). Taken together, the analysis indicates that these differential species may be involved in the gastrointestinal symptoms of C-ASD. Consistent with the 16S rRNA analysis at the genus level, most of the identified differential species belonged to the genera Prevotella (). To understand the role of important species in the pathogenesis of ASD, we used the NetShift method to identify important species in microbiome network. The changes in the bacterial structure were evident from the community shuffling plots. Impressively, Ruminococcus lactaris displayed a high NESH score as the “drivers” species in C-ASD (). The analysis may provide important candidate bacteria that are involved in the pathological mechanism of ASD.
Figure 3. The gut microbiota divergence in ASD with constipation (C-ASD) and TD children based on the metagenomic sequencing data.
Functional analysis of metagenomic sequencing revealed disrupted bacteria functions in constipated ASD group
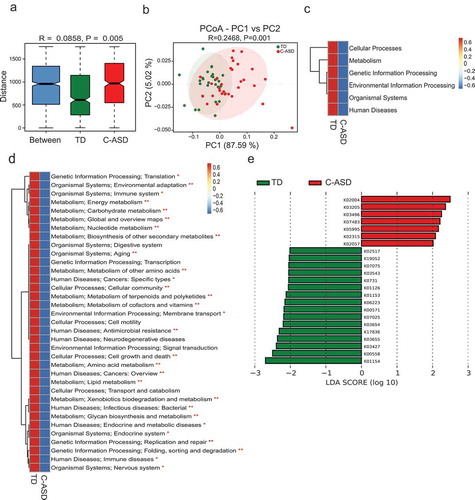
Metagenomic sequencing additionally allows for functional analysis. To compare the functional bacteria genes, we compared gut microbial functions across the two groups in our study cohort. A total of 1,550,192 genes were predicated in our study. The ANOSIM results indicated that the KEGG orthologous (KO) were clearly separated between TD and C-ASD (P = .005, ). PCoA based on KEGG modules revealed differences in microbial functions between TD and C-ASD (). Meanwhile, all the KEGG pathways based on level 1, level 2, and KO were disrupted in C-ASD, relative to TD group (-). For instance, the metabolic pathway activity of energy, lipids, vitamins, glycan, xenobiotics biodegradation, and nucleotides were all lower in the C-ASD group.
Figure 4. Microbial gene functions annotation on KEGG in ASD with constipation (C-ASD) and TD children.
The eggNOG orthologous group (og) of the C-ASD group was also separated significantly from the TD group (Figure S6A). Meanwhile, the distribution of function was significantly different based on the PCoA (Figure S6B). Considering different levels of eggNOG, most functions were disrupted in C-ASD children, except for extracellular structures (Figure S6C-6d). It is noted that the metabolism involved in energy production and conversion was enriched in the C-ASD group but cell wall membrane envelope biogenesis was decreased, according to the LDA diagram (Figure S6E). The CAZy results also indicated that the number of CAZy orthologues was significantly separated between the two groups (Figure S7), and the predicated function was also disrupted in the C-ASD group (Figure S7).
As resistance to antibiotics develops, humans are facing a global public health problem.Citation23 To investigate the distribution of antibiotic-resistant genes (ARGs) in C-ASD and TD group, we compared all the high-throughput sequencing reads of the present study against the Antibiotic Resistance Database (ARDB) protein database.Citation24 The overview of the ARDB results is shown in Figure S8, and there were no significant differences in the number of ARGs or ARG types between the two groups, except for gene bl2ecfxa.
Overall, the microbiome associated genes analysis revealed that C-ASD children displayed dysfunction in several pathways of the KEGG, CAZy, and eggNOG databases. The metabolism of energy, carbohydrates, lipids, vitamins, glycan, xenobiotics biodegradation, amino acids, and nucleotides were all shown to be disrupted in the C-ASD group compared to the TD group. The analysis further suggested these disrupted pathways in ASD may play a part in the potential interaction effects between ASD and GI symptoms generated by the dysbiosis of gut microbiota and fecal metabolites.
Metabolomics analysis revealed aberrant metabolic patterns in ASD children
Microbially derived metabolites influence the host through multiple pathways. Increasing evidences showed some metabolic products of gut microbiota could enter the bloodstream and exert important influences on the physiology and behavior of the hosts.Citation25–Citation27 Next, we explored the host metabolic profile in the same samples as that of metagenomics analysis which include 30 C-ASD and TD through liquid chromatography-mass spectrometry (LC/MS) and examined the relationship between microbiota and metabolites. The fecal samples from distinct groups were largely separated according to the Partial Least Squares Discriminant Analysis (PLS-DA) and Orthogonal Partial Least Squares Discriminant Analysis (OPLS-DA) (-), suggesting a dissimilar metabolic mode. Seventeen KEGG pathways were significantly different between two groups (). The top three enrichment pathways were the catalog of global and overview, amino acid metabolism and nucleotide metabolism.
Figure 5. Aberrant metabolic patterns in ASD with constipation (C-ASD) and typically developing (TD) children.
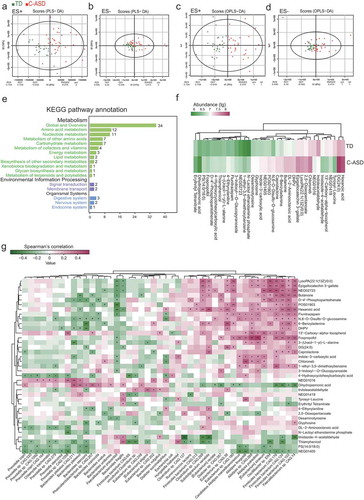
There were 83 metabolites with 1.5-fold changes, while 37 metabolites with twofold changes (Tables S7 and S8). The hexanoic acid, chloroneb, and DL-2-aminooctanoic acid were more abundant in C-ASD samples (). Some products were the intermediate metabolites of amino acid. For example, 2,5-dioxopentanoate and desaminotyrosine are the metabolites of glutamate and tyrosine, respectively, both of which are reported to be increased in ASD.Citation28,Citation29 Interestingly, the indole acetaldehyde and indole-3-carboxylic acid both involved in the metabolism of indole, which presented significant difference in C-ASD compared to TD. To explore the potential relationships between the gut microbiome changes and metabolic products, a correlation matrix was generated using Spearman correlation (). The abundance of most species such as Ruminococcus lactaris, Alistipes spp., Oscillibacter sp. ER4, and Faecalibacterium sp. CAG:74, were positively correlated with the level of dihydrojasmonic acid, butanone, hexanoic acid, flunitrazepam, fospropofol, and caprolactone.
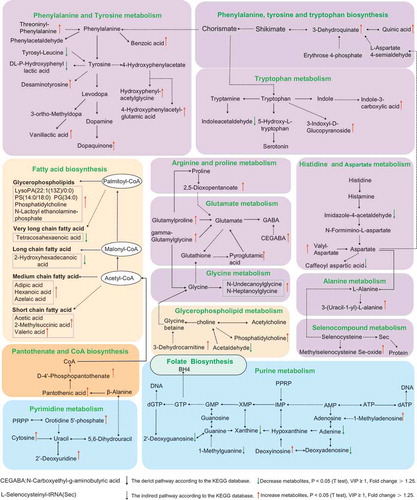
Increasing evidences showed ASD children displayed abnormal level of neurotransmitters, such as serotonin, dopamine, γ-aminobutyric acid (GABA) and indole.Citation30,Citation31 Recently, emerging literatures have reported that gut microbiota participated in the synthesis and metabolism of neurotransmitters,Citation17 so we further checked whether these differential level of metabolites between two groups were involved in neurotransmitters metabolic process. As shown in , we found that much of differentia metabolites, such as dopaquinone, pyroglutamic acid, n-carboxyethyl-g-aminobutyric acid, 3-indoxyl-d-glucopyranoside, indole-3-carboxylic acid, valyl-aspartate, and caffeoyl aspartic acid involved in neurotransmitter metabolic network including phenylalanine and tyrosine metabolism, tryptophan metabolism, histidine, aspartate metabolism, and glutamate metabolism. Moreover, the metabolites which involved in tetrahydrobiopterin (BH4) metabolism showed an abnormal level in ASD. In short, the analysis further implicated that gut microbes might be involved in the metabolism of neurotransmitters.
Figure 6. KEGG pathway of the differential metabolites between C-ASD and TD group (Fold change >1.25, VIP ≥ 1, P < .05 T test).
Discussion
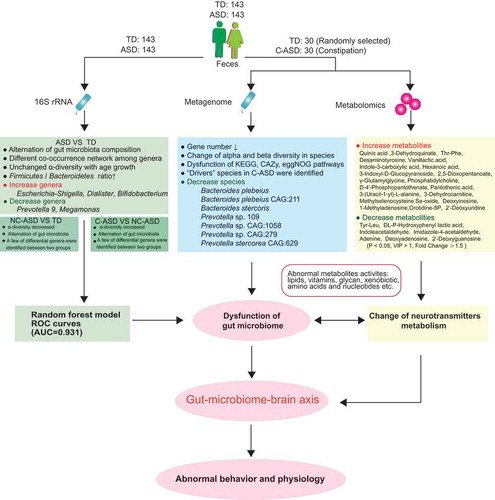
As shown in summary of , compared to that of TD group, ASD group displayed alternation of gut microbiota composition. ASD showed less genera including Prevotella and Megamonas. However, Escherichia-Shigella, Dialister, Bifidobacterium were increased in ASD. Furthermore, the current study presented that the compositional development of the gut microbiota in ASD varies at different ages in ways that are not consistent with TD group. In addition, the α-diversity of ASD children showed no age-related change, while TD children showed increased α-diversity with age. NC-ASD showed decreased α-diversity and alternation of gut microbiota compared to TD. However, C-ASD showed increased α-diversity compared to NC-ASD, which further implicated that constipation might add heterogenous characteristics of gut microbiota in ASD. A Random Forest prediction model was able to distinguish ASD children from TDs with a high degree of certainty, which generated the possibility for a gut health monitoring mode and a complementary approach for risk assessment of ASD. ASD children displayed abnormal level in metabolites compared to TD group, and these metabolites are majorly associated with the metabolism of fatty acid, nucleotide, and amino acid, which are partially involved in the metabolism of neurotransmitters.
Figure 7. The summary of gut microbiota composition and metabolism analysis between ASD and TD.
Consistent with other studies that reported changes in microbiome associated with constipated populations.Citation31 We also found significant increases in the abundance of Coprobacter, Barnesiella, and Veillonella in constipated ASD children. But Fusobacterium was reduced in C-ASD group, as opposed to a significant increase in IBS patients with constipation.Citation32 This suggests the possibility that specific microbial patterns may be linked to constipation symptoms of specific disease, which suggests the necessity to more deeply understand the ASD-related gastrointestinal symptoms as they pertain to diagnosis and treatment of ASD.
Compared with the TD group, the relative abundance of Prevotella 9, Prevotella copri, and Prevotella stercorea in C-ASD group were identified decreased significantly using metagenomics technique. Moreover, the decreased level of Prevotella in ASD children was in agreement with studies from different countries using small cohorts.Citation31,Citation32 Prevotella are the dominant bacteria in the intestinal tract of human.Citation33 Recent researches reported that Prevotella copri can utilize polysaccharides to produce succinic acid,Citation34 which has been reported to enhance the immune response of antigen-specific T cells by binding to the succinic acid receptor GPR91 on the surface of dendritic cells to protect host health.Citation35 Increasing evidences have shown that many of ASD children displayed immune dysfunction.Citation36 Therefore, it can be speculated that their immune disorder may be related to the decrease of Prevatella bacteria in the intestine, which further affect the physiological and behavioral features of ASD children.
Increasing evidences have shown that enteric SCFAs present in diet and also those produced by opportunistic bacteria of gut following fermentation of dietary carbohydrates may act as environmental triggers for ASD.Citation37 Recent fecal SCFAs analysis in constipated ASD children showed that a two-fold increased level of valeric acid is associated with Acidobacteria among ASD compared to TD.Citation31 Consistent with this, we also found valeric acid showed slight increase in C-ASD group compared to TD group; however, a significant change in other SCFAs, such as acetic acid, propionic acid, and butyric acid which have antimicrobial and anti-inflammatory properties, as well as immunomodulatory roles were not found. Previous studies on fecal SCFAs were inconsistent in ASD, and it can be speculated fecal SCFAs may not indicate SCFAs level of intestinal mucosa.Citation38 In addition to considering sample manipulation, as well as geographical and dietary effects on fecal SCFAs, future investigation on SCFAs level associated with bacteria in intestinal mucosa would help to accurately reveal enteric SCFAs implications in ASD.
The abundance of middle chain fatty acids (MCFAs) such as hexanoic acid showed increased significantly in ASD group. Zhu et al. reported that Clostridium cluster IV and Ruminococcaceae bacterium CPB6 can produce hexanoic acid.Citation39 The Ruminococcaceae family including Faecalibacterium sp. CAG: 74, Subdoligranulum variabile, Clostridium sp. CAG: 269 and Eubacterium sp. CAG: 38 displayed a positive correlation with hexanoic acid level. Moreover, previous study found the ASD was associated with higher hexanoic acid levels in the blood in comparison to the TD group.Citation38 Moreover, Ruminococcus lactaris is a key bacterium predicted by the NetShift method and presented as positively correlated with hexanoic acid (P < .1, ). Viewed together, this information further suggested that some species from Ruminococcus family may be involved in the development of ASD diseases via hexanoic acid production. MCFAs are ligands of GPR84, which enhances the production of lipopolysaccharide-induced pro-inflammatory immune factor IL-12 P40 (P40 is the subunit of IL-12).Citation40 It has been reported that IL-12 or IL-12 P40 is significantly increased in children with ASD.Citation36,Citation41 Moreover, Ashwood et al. reported that IL-12 P40 is positively correlated with lethargy and stereotypy behavior.Citation36 Therefore, future studies focus on whether hexanoic acid produced by gut bacteria metabolism would help identify new drug targets for ASD.
Gut microbes are capable of producing most neurotransmitters found in the human brain.Citation42 Furthermore, an analysis of fecal metabolites associated with gut bacteria revealed different levels of some precursor metabolites and neuronal transmitter metabolites between ASD and TD group. Previous studies have reported that most ASD children displayed elevated 5-HT levels in the blood.Citation43 Recent studies implicated that 5-HT is a critical modulator of enteric nervous system (ENS) and central nervous system (CNS) development and may function as a nexus for the gut-brain axis in ASD children.Citation44 However, the specific bacteria regulating 5-HT levels remains much unclear. Tryptophan has been found to be a precursor of synthesizing serotonin, but indole acetaldehyde as product of tryptophan metabolite had negative effect on the synthesizing serotonin.Citation45 The present fecal metabolites analysis found indole acetaldehyde in ASD exhibited a significant decrease compared to that of TD group. Additionally, the decreased Bacteroides spp. observed between the ages of 2–3 in the ASD group negatively correlated with indole acetaldehyde, suggesting the elevated level of serotonin in some ASD children may be due to a lack of the Bacteroides spp.
GABA is regarded as the main inhibitory neurotransmitter.Citation46,Citation47 Recent studies have shown that ASD displayed altered GABA metabolite profiles in feces when compared with neurotypical children, which is probably related to gut dysbiosis.Citation32 Consistent with this, the present study observed the precursors of GABA such as CEGABA, glutamylproline, pyroglutamic acid, and gamma-glutamylglycine, showed elevated level in ASD childrenCitation29,Citation48 Bifidobacterium spp. has been reported to produce GABA.Citation49 In agreement with this finding, Bifidobacterium spp. in the present study was found significantly increased, which implies the elevated level of precursor of GABA may be induced by the increased Bifidobacterium spp. Neurophysiological deficits in GABA receptor-mediated function in ASD children have been reported by Masuda et al.Citation50 Hence, further research focusing on targeting the specific microbiota associated with neural circuits related to GABA receptor-mediated function in regions involved in the pathophysiology of ASD may be promising.
An increasing amount of studies have reported dopamine (DOPA) signals abnormalities in ASD; however, a coherent dopamine hypothesis that links neurobiology to behavior in ASD is currently lacking.Citation51 The present fecal microbiota metabolites analysis showed an abnormal amino acid metabolism, such as several tyrosine and phenylalanine derivatives related to the synthesis and metabolism of DOPA showed significant change. Moreover, a number of Bacteroides spp. and Prevotella spp. showed high correlation with these differential metabolites, which further implicated that the decreased level of both genus in ASD group may play a potential role of causing DOPA signaling abnormalities in ASD via regulating the amino acids metabolism.
Recent studies in humans and animal-models suggest that dysfunction of the cholinergic system may underlie ASD-related behavioral symptoms.Citation52 Measuring that tap the cholinergic system was used in ASD for diagnoses.Citation53 In the present study, phosphatidylcholine as an intermediate metabolite of choline showed increased, and acetaldehyde as the intermediate metabolite of choline showed decreased level in ASD, which implicated that gut microbes in ASD may regulate acetylcholine and eventually leads the defective behavior of ASD children through gut-microbiome-brain-axis.
The equilibrium between reduced and oxidized forms of glutathione (GSH and GSSG, respectively) is the primary determinant of intracellular redox status,Citation54 which may play an essential role in this pathogenesis of ASD.Citation55 Systemic deficits of glutathione and cysteine in ASD have been reported by Frustaci et al.Citation56 Consistent with this finding, the current study found that the level of the intermediate product, Methylselenocysteine Se-oxide and 3-(Uracil-1-yl)-L-alanine from intermediate derivative of L-alanine were elevated in ASD group, which may further lead to a decrease in selenocysteine and the abnormal reaction of glutathione. Gut microbes in the gastrointestinal tract compete for nutrient resources in the usual symbiotic way; however, gut dysbiosis may interfere with nutrient resources. Thus, the current study suggested constipated ASD may be related to the failure of gastrointestinal epithelium to absorb antioxidant nutrients such as cysteine or selenocysteine. Recently, Wang et al. reported that alterations in the gut glutamate metabolism were associated with changes in gut microbiota composition in ASD children,Citation57 but the differential metabolites shown in the Wang et al. study showed no difference between the ASD and TD groups of the current study, which imply the complexity of the pathological mechanism of ASD. These inconsistent and altered metabolites also reflect the limitation of the analysis method, since fecal metabolism analysis does not fully reveal the true metabolic state of the host. Thus, future studies that focus on the associated analysis of the urine metabolism with fecal microbiota metabolites are suggested to better understand the metabolite role in the pathological mechanism of autism.
Conclusion
In conclusion, the present analysis revealed that ASD patients showed gut dysbiosis at the phylum, genus, and species level. Moreover, the α-diversity in the gut microbiota of ASD group showed no significant change with age; however, the TD group showed increased diversity. The changed species associated with metabolite alteration in C-ASD were identified. In particular, that interaction analysis between gut microbiota, metabolites and neurotransmitters was discussed, which could provide clues for better understanding the mechanisms underlying altered social behaviors in ASD patients as well as potentially reveal whether the origin of such alterations can be linked to gut microbiota. The aberrant fecal microbiome-metabolites may have strong implications in terms of pathogenesis of the gut-brain-axis in ASD patients. Further studies are required to confirm the connection between gut microbiome-mediated metabolites and the central nervous system. This study provided insights into the relationship between the fecal microbiome, metabolites, gut dysfunction, and the deregulation of neurotransmitters in ASD patients, suggesting possible future modalities for ASD intervention targeting the specific microbiota associated with neurotransmitter metabolism.
Materials and methods
Ethics statement
This study was approved by the Ethics Committee of Affiliated Yixing Hospital of Jiangsu University (Ethics NO, 2016055). All children’s legal guardians signed a written informed consent upon enrollment. They all received questionnaires and sample collection kits.
Study subject recruitment and fecal sample collection
The children with ASD in this study were diagnosed according to the Diagnostic and Statistical Manual of Mental Disorders, 5th Edition.Citation58 The typically developing (TD) children were recruited from kindergartens. All the children underwent neurological, physical, and behavioral examinations. The exclusion criteria include diseases such as depressive disorder, cerebral palsy, schizophrenia, bipolar disorder, significant sensory impairment, and clinically significant inflammatory conditions. Participants’ metadata was obtained about the sex, dietary supplements, gastrointestinal symptoms, medications, and allergy histories, and age at sampling were collected for each participant. All participants had not taken antibiotics, probiotics, and prebiotics in the 3 months prior to the feces collection. None of the participants were on anti-inflammatory or antioxidant drugs. The Rome IV criteria for functional constipation was used for evaluating GI symptoms.
Fecal sample collection
Feces were collected at hospital or home. The feces were collected according to the instruction and delivered immediately at low temperatures. The frozen feces were shipped using dry ice overnight to Nanjing Medical University. Once received, fecal samples were divided into three parts of 200 mg and stored at −80°C until extraction.
DNA isolation and 16S rRNA gene sequencing
About 100 mg of stool samples were used to extract total genome DNA according to the DNA extraction kit (#DP328, Tiangen Company, Beijing, China). The concentration and purity of the extracted bacterial DNA were detected using Qubit 2.0 Fluorometer (Thermo Scientific, USA). The 16S rRNA gene V4 region-specific primer are 515F GTGCCAGCMGCCGCGGTAA and 806A GGACTACHVGGGTWTCTAAT. The PCR products of sterile water were considered as the negative control for 16S rRNA seq. The PCR products were purified using the GeneJET Gel Extraction Kit (Thermo Scientific). Illumina TruSeq DNA PCR-Free Library Preparation Kit (Illumina, USA) was used to generate sequencing libraries. The libraries were sequenced in the Illumina Hiseq platform (Novogene, China). Raw fastq files were merged using FLASH (http://ccb.jhu.edu/software/FLASH) parameters: -m 10 -f 300 -x 0.1 -p 33 -r 199 -M 173.Citation59
Raw data were analyzed by Majorbio Bio-Pharm Technology Co. Ltd. (Shanghai, China). The data analysis, principal coordinates analysis (PCoA) and alpha diversity were calculated using the I-Sanger platform (http://www.i-sanger.com). The estimate of richness index was calculated by the breakaway method implemented in Quantitative Insights Into Microbial Ecology (QIIME) version 2.0.Citation60 Briefly, sequences were qualified by Quantitative Insights Into Microbial Ecology (QIIME) version 1.9.1 (http://qiime.org/scripts/assign_taxonomy.html) Chimera sequences were detected using UCHIME algorithm (http://www.drive5.com/usearch/manual/uchime_algo.html) and compared with “Gold” database (http://drive5.com/uchime/uchime_download.html).Citation61 Operational taxonomic units (OTUs) were clustered using Uparse 7.1 (http://drive5.com/uparse) with sequences similarity ≥97%.Citation62 The annotations of taxonomic information were used the RDP classifier algorithm (http://sourceforge.net/projects/rdp-classifier) according to the GreenGene version 13.5 database.Citation63 All 16S rRNA raw data have been submitted to GEO (accession number GSE113701).
Metagenomic sequencing and assembly
Fifty-two out of 143 ASD children have constipation symptoms. The 30 constipated ASD participants and their aged-matched TD were picked out to perform metagenomics analysis. About 2 μg DNA per sample were prepared. Sequence libraries were generated using NEBNext® Ultra™ DNA Library Prep Kit for Illumina (NEB, USA). The libraries were sequenced on the Illumina Hiseq X platform (insert size 350 bp, read length 150 bp) at the Novogene Bioinformatics Technology Co., Ltd. (Tianjin, China). The human reads (according to alignment to hg19) or low-quality sequences were discarded, and the high-quality sequences were assembled using SOAPdenovo version 2.04 (http://soap.genomics.org.cn/soapdenovo.html).Citation64 All metagenomic raw data have been submitted to GEO (accession number GSE113540).
Gene catalog (Unigenes) construct, taxonomy predication
The genes were predicated using the Meta GeneMark version 2.10 (http://topaz.gatech.edu/GeneMark/).Citation65 Redundant genes (95% identity, 90% overlap) were removed by CD-HIT version 4.5.8 (http://www.bioinformatics.org/cd-hit), resulting in a non-redundant gene catalog.Citation66 The reads were aligned using DIAMOND version 0.9.9 (https://github.com/bbuchfink/diamond/) for taxonomy functional assignment and taxonomic identity.Citation67 The LCA algorithm of MEGAN software system was used to conduct annotation.Citation68
Gene functional annotations
Predicted unigenes were used DIAMOND Version 0.9.9 to assign to the kyoto encyclopedia of genes and genomes (KEGG), evolutionary genealogy of genes: non-supervised orthologous groups (eggNOG), and carbohydrate-active enzymes database (CAZy).Citation69,Citation70 The abundances of each functional annotations were the sum of the abundance of annotation of each functional level.
Resistance gene annotations
The predicated antibiotic resistance genes (ARGs) were searched in the Antibiotic Resistance Database (ARDB) (http://ardb.cbcb.umd.edu/) using the DIAMOND version 0.9.9 with parameters set as blastp, -e 1e-5.Citation71 The reads of alignment length ≥25 amino acids and BLASTx ≥90% were the final annotation.Citation72
Co-occurrence network analysis
To understand the correlations among different genera or species, we constructed co-occurrence network based on the 16S rRNA or metagenomic data.Citation73 The bacterial correlations in the TD and ASD samples were analyzed, respectively, according to the relative abundance of each species/genus using Spearman’s correlation coefficient to construct the co-occurrence network. The significant correlated genus/species (false discovery rate <0.05, rho ≥0.25) were visualized by Cytoscape version 3.6.1 (http://www.cytoscape.org).Citation74 Then, the similarity between the two network structures was measured by node closeness and shared correlations. Closeness of the nodes was analyzed by Cytoscape to predicate node centralities in each network. The shared correlations between two groups were defined the edges with the same nodes in two co-occurrence networks. The results were visualized by R version 3.5.1 Venn Diagram and ggplots package. Only genera or species existed in at least 10% sample were included in the network analysis.
Identification of driver microbiome between ASD-TD association networks
We used Netshift web tool to identify important microbial taxa which serve as “drivers” in the most common sub-network between TD and C-ASD networks.Citation75
Metabonomic analysis based on liquid chromatography-mass spectrometry (LC/MS)
Feces of 30 C-ASD and 30 TD children were subjected to metabolomics analysis according to the LC/MS method (Gene Denovo Co. Ltd, Guangzhou, China), which was consistent with the Metagenomic sequencing. Each 50 mg feces were mixed with 1 mL water-methanol-acetonitrile (1:2:2), vortexed for 30 s, homogenized at 45 Hz for 4 min, sonicated 5 min at 4°C, and then incubation 1 h at −20°C. The mixtures were centrifuged at 12000 rpm for 10 min at 4°C, then the supernatant was transferred to UHPLC-QE Orbitrap/MS analysis.Citation76
The LC/MS analyses were performed according to the previous study.Citation77 In brief, the UHPLC system (1290, Agilent Technologies) with a UPLC HSS T3 column (2.1 mm * 100 mm, 1.7 μm) coupled to Q Exactive Orbitrap (Thermo Fisher Scientific) were used. The formic acid (0.1%) and ammonium acetate (5 mM) were the solvent A for positive (ES+) and negative (ES-), respectively. Solvent B was the acetonitrile. About 2 μL fecal sample were injected at 4°C for analysis. The gradient elution of solvent B as follows: 1%, 0–1 min; 99%, 8 min; 99%, 10 min; 1%, 10 min; 1%, 12 min. The thermo Q Exactive Orbitrap mass spectrometer can control the Xcalibur version 4.0.27 to acquire the full scan survey MS and MS/MS spectra. The spray voltage of ES+ was 3.8 kV, and 3.1 kV for ES-. The capillary temperature was 320°C. About 70–1000 m/z masses were acquired. The resolved power of full MS and MS/MS was set to 70,000 and 17,500, respectively.
The raw data were converted into mzML format using ProteoWizard, and preprocessed with R package XCMS v3.2.Citation78 The processed data include peak intensity, mass-to-charge ration (m/z), and retention time (RT). The metabolites were identified with the featured peaks according to the software OSI/SMMS version 1.0. Impurity peaks and duplicate identifications were eliminated. For each data set, we removed the compounds that were present in fewer than 50% of samples within a study. The identification of tentative metabolite was mapped in MS and MS/MS database using the HMDB (https://hmdb.ca).Citation79 If some peak both mapped in MS and MS/MS database, MS/MS data was the result. Unmapped was defined as MS or MS/MS neither mapped.
We used partial least squares discriminant analysis (PLS-DA) and orthogonal partial least squares discriminant analysis (OPLS-DA) to evaluate the difference in metabolic profiles between TD and ASD children.Citation80 The analysis was performed using the ropls version 1.12.0 (http://bioconductor.org/packages/release/bioc/html/ropls.html). All the observed and predicated compounds also were imported KEGG database. The significant metabolites with variable important in projection (VIP) ≥1, and P value (T test) <0.05. We further choose the significant metabolites with >1.25-fold change for next analysis.
Random forest model prediction
Considering the robustness of the algorithm, random forest provided in the R package random Forest was used to build the prediction model to identify the potential diagnostic biomarkers. The 16S rRNA abundance profiles were collected in the work, and the model training was carried out using the 80% of sample set. The core genera in TD or ASD groups were filtered as prediction input variables. The important genera contributed to prediction were identified via a nested 10-fold cross-validation procedure. The area under curve (AUC) index and receiver operating characteristic (ROC) analysis were used to predicate the efficiency of possible cutoff values of the tests.Citation81
Correlation analysis of species and metabolites
To determine the association between gut microbiota and metabolites in ASD children, we constructed a correlation analysis between gut microbiota and differential metabolites using Spearman’s correlations in R version 3.4.3 (Hmisc package). The top 45 species between two groups, and metabolites with >2-fold changes between TD and ASD, VIP ≥ 1, P < .05 (T test) were also analyzed.
Data analysis
To identify features (taxa and functional modules) differentially represented between any two groups, differentially abundant taxa or functional modules were selected using the LEfSe (linear discriminant analysis (LDA)) effect size.Citation82 Differential abundance of phylums, genera, species and functional modules between any two groups was tested by Wilcoxon rank-sum test, P value was corrected as false discovery rate (FDR) with the Benjamini–Hochberg method.Citation83
Disclosure of potential conflicts of interest
No potential conflicts of interest were disclosed.
Supplemental Material
Download Zip (7.2 MB)Acknowledgments
We greatly thank the children and their parents that participated in sample collections. We gratefully thank Miss Qianqian Huang (Early children development and intervention center of Aizhiyi in Suzhou Industrial park, Suzhou, China) and Yuning Zhou (Children rehabilitation center of Huicheng in Liangxi District, Wuxi, China)’s help in sample collection.
Supplementary material
Supplemental data for this article can be accessed here.
Additional information
Funding
Notes on contributors
Qisha Liu
X.L. conceived and designed project. Z.D., X.M., K.C., X.T., L.Q., B.G., R.X., K.L., and F.Z. collected samples. Z.D., X.M., X.L., Q.L., Z.L., J.C., M.G., Y.Z., and K.L. did experiments and analysis. Z.D., Z.L., Q.L. and X.L. prepared figures. All of authors performed data analyses and interpretations. X.L. and Q.L. prepared and finished the manuscript.
References
- Vuong HE, Hsiao EY. Emerging roles for the gut microbiome in autism spectrum disorder. Biol Psychiatry. 2017;81(5):411–423. doi:https://doi.org/10.1016/j.biopsych.2016.08.024.
- Baio J, Wiggins L, Christensen DL, Maenner MJ, Daniels J, Warren Z, Kurzius-Spencer M, Zahorodny W, Rosenberg CR, White T, et al. Prevalence of autism spectrum disorder among children aged 8 years - autism and developmental disabilities monitoring network, 11 sites, united states, 2014. MMWR Surveill Summ. 2018;67(6):1–23. doi:https://doi.org/10.15585/mmwr.ss6706a1.
- Wu L, Li H. Autism spectrum disorder and rehabilitation of autistic children. Foreign Med Sci Sect Medgeography. 2018;39:101–103.
- Fulceri F, Morelli M, Santocchi E, Cena H, Del Bianco T, Narzisi A, Calderoni S, Muratori F. Gastrointestinal symptoms and behavioral problems in preschoolers with autism spectrum disorder. Digestive Liver Dis. 2016;48(3):248–254. doi:https://doi.org/10.1016/j.dld.2015.11.026.
- Strati F, Cavalieri D, Albanese D, De Felice C, Donati C, Hayek J, Jousson O, Leoncini S, Renzi D, Calabrò A, et al. New evidences on the altered gut microbiota in autism spectrum disorders. Microbiome. 2017;5(1):24. doi:https://doi.org/10.1186/s40168-017-0242-1.
- Chaidez V, Hansen RL, Hertz-Picciotto I. Gastrointestinal problems in children with autism, developmental delays or typical development. J Autism Dev Disord. 2014;44(5):1117–1127. doi:https://doi.org/10.1007/s10803-013-1973-x.
- Fung TC, Olson CA, Hsiao EY. Interactions between the microbiota, immune and nervous systems in health and disease. Nat Neurosci. 2017;20(2):145–155. doi:https://doi.org/10.1038/nn.4476.
- Powell N, Walker MM, Talley NJ. The mucosal immune system: master regulator of bidirectional gut-brain communications. Nat Rev Gastroenterol Hepatol. 2017;14(3):143–159. doi:https://doi.org/10.1038/nrgastro.2016.191.
- Sharon G, Sampson TR, Geschwind DH, Mazmanian SK. The Central Nervous System and the Gut Microbiome. Cell. 2016;167(4):915–932. doi:https://doi.org/10.1016/j.cell.2016.10.027.
- Sharon G, Cruz NJ, Kang DW, Gandal MJ, Wang B, Kim YM, Zink EM, Casey CP, Taylor BC, Lane CJ, et al. Human gut microbiota from Autism Spectrum Disorder promote behavioral symptoms in mice. Cell. 2019;177(6):1600–1618. doi:https://doi.org/10.1016/j.cell.2019.05.004.
- Tomova A, Soltys K, Repiska G, Palkova L, Filcikova D, Minarik G, Turna J, Prochotska K, Babinska K, Ostatnikova D, et al. Specificity of gut microbiota in children with autism spectrum disorder in Slovakia and its correlation with astrocytes activity marker and specific behavioural patterns. Physiol Behav. 2020;214:112745. doi:https://doi.org/10.1016/j.physbeh.2019.112745.
- Nogay NH, Nahikian-Nelms M. Can we reduce autism-related gastrointestinal and behavior problems by gut microbiota based dietary modulation? A review. Nutr Neurosci. 2019;1–12. doi:https://doi.org/10.1080/1028415X.2019.1630894.
- Li N, Yang J, Zhang J, Liang C, Wang Y, Chen B, Zhao C, Wang J, Zhang G, Zhao D, et al. Correlation of gut microbiome between ASD children and mothers and potential biomarkers for risk assessment. Genomics Proteomics Bioinf. 2019;17(1):26–38. doi:https://doi.org/10.1016/j.gpb.2019.01.002.
- Liu F, Li J, Wu F, Zheng H, Peng Q, Zhou H. Altered composition and function of intestinal microbiota in autism spectrum disorders: a systematic review. Transl Psychiatry. 2019;9(1):43. doi:https://doi.org/10.1038/s41398-019-0389-6.
- Coretti L, Paparo L, Riccio MP, Amato F, Cuomo M, Natale A, Borrelli L, Corrado G, De Caro C, Comegna M, et al. Gut microbiota features in young children with autism spectrum disorders. Front Microbiol. 2018;9:3146. doi:https://doi.org/10.3389/fmicb.2018.03146.
- Kushak RI, Winter HS, Buie TM, Cox SB, Phillips CD, Ward NL. Analysis of the duodenal microbiome in autistic individuals: association with carbohydrate digestion. J Pediatr Gastroenterol Nutr. 2017;64(5):e110–e6. doi:https://doi.org/10.1097/MPG.0000000000001458.
- Borre YE, O’Keeffe GW, Clarke G, Stanton C, Dinan TG, Cryan JF. Microbiota and neurodevelopmental windows: implications for brain disorders. Trends Mol Med. 2014;20(9):509–518. doi:https://doi.org/10.1016/j.molmed.2014.05.002.
- Ferguson BJ, Dovgan K, Takahashi N, Beversdorf DQ. The relationship among gastrointestinal symptoms, problem behaviors, and internalizing symptoms in children and adolescents with autism spectrum disorder. Front Psychiatry. 2019;10:194. doi:https://doi.org/10.3389/fpsyt.2019.00194.
- Sparks B, Cooper J, Hayes C, Williams K. Constipation in children with autism spectrum disorder associated with increased emergency department visits and inpatient admissions. J Pediatr. 2018;202:194–198. doi:https://doi.org/10.1016/j.jpeds.2018.05.004.
- Warner BB. The contribution of the gut microbiome to neurodevelopment and neuropsychiatric disorders. Pediatr Res. 2019;85(2):216–224. doi:https://doi.org/10.1038/s41390-018-0191-9.
- Mcelhanon BO, Mccracken C, Karpen S, Sharp WG. Gastrointestinal symptoms in autism spectrum disorder: a meta-analysis. Pediatrics. 2014;133(5):872. doi:https://doi.org/10.1542/peds.2013-3995.
- Yilmaz B, Juillerat P, Oyas O, Ramon C, Bravo FD, Franc Y, Fournier N, Michetti P, Mueller C, Geuking M, et al. Microbial network disturbances in relapsing refractory Crohn’s disease. Nat Med. 2019;25(2):323–336. doi:https://doi.org/10.1038/s41591-018-0308-z.
- Jenks J. Antibiotic resistance needs global solutions. Lancet Infect Dis. 2014;14(7):550–551. doi:https://doi.org/10.1016/S1473-3099(14)70801-1.
- Liu B, Pop M. ARDB-antibiotic resistance genes database. Nucleic Acids Res. 2009;37(Database):D443. doi:https://doi.org/10.1093/nar/gkn656.
- Zalar B, Haslberger A, Peterlin B. The role of microbiota in depression - a brief review. Psychiatr Danub. 2018;30(2):136–141. doi:https://doi.org/10.24869/spsih.2018.136.
- Yang H, Duan Z. The local defender and functional mediator: gut microbiome. Digestion. 2018;97(2):137–145. doi:https://doi.org/10.1159/000484687.
- Sarkar A, Lehto SM, Harty S, Dinan TG, Cryan JF, Burnet PW. Psychobiotics and the manipulation of bacteria-gut-brain signals. Trends Neurosci. 2016;39(11):763–781. doi:https://doi.org/10.1016/j.tins.2016.09.002.
- Mcclintock MK, Wang J, Zhang K. Application of nonphosphorylative metabolism as an alternative for utilization of lignocellulosic biomass. Front Microbiol. 2017;8:2310. doi:https://doi.org/10.3389/fmicb.2017.02310.
- Noto A, Fanos V, Barberini L, Grapov D, Fattuoni C, Zaffanello M, Casanova A, Fenu G, De Giacomo A, De Angelis M, et al. The urinary metabolomics profile of an Italian autistic children population and their unaffected siblings. J Maternal-Fetal Med. 2014;27(sup2):46–52. doi:https://doi.org/10.3109/14767058.2014.954784.
- Strandwitz P. Neurotransmitter modulation by the gut microbiota. Brain Res. 2018;1693:128–133. doi:https://doi.org/10.1016/j.brainres.2018.03.015.
- Liu S, Li E, Sun Z, Fu D, Duan G, Jiang M, Yu Y, Mei L, Yang P, Tang Y, et al. Altered gut microbiota and short chain fatty acids in Chinese children with autism spectrum disorder. Sci Rep. 2019;9(1):287. doi:https://doi.org/10.1038/s41598-018-36430-z.
- Kang DW, Ilhan ZE, Isern NG, Hoyt DW, Howsmon DP, Shaffer M, Lozupone CA, Hahn J, Adams JB, Krajmalnik-Brown R, et al. Differences in fecal microbial metabolites and microbiota of children with autism spectrum disorders. Anaerobe. 2018;49:121–131. doi:https://doi.org/10.1016/j.anaerobe.2017.12.007.
- Licht TR, Madsen B, Wilcks A. Selection of bacteria originating from a human intestinal microbiota in the gut of previously germ-free rats. FEMS Microbiol Lett. 2010;277(2):205–209. doi:https://doi.org/10.1111/j.1574-6968.2007.00962.x.
- Kovatcheva-Datchary P, Nilsson A, Akrami R, Lee YS, De Vadder F, Arora T, Hallen A, Martens E, Björck I, Bäckhed F, et al. Dietary fiber-induced improvement in glucose metabolism is associated with increased abundance of Prevotella. Cell Metab. 2015;22(6):971–982. doi:https://doi.org/10.1016/j.cmet.2015.10.001.
- Rubic T, Lametschwandtner G, Jost S, Hinteregger S, Kund J, Carballido-Perrig N, Schwärzler C, Junt T, Voshol H, Meingassner JG, et al. Triggering the succinate receptor GPR91 on dendritic cells enhances immunity. Nat Immunol. 2008;9(11):1261–1269. doi:https://doi.org/10.1038/ni.1657.
- Ashwood P, Krakowiak P, Hertz-Picciotto I, Hansen R, Pessah I, Van de Water J. Elevated plasma cytokines in autism spectrum disorders provide evidence of immune dysfunction and are associated with impaired behavioral outcome. Brain Behav Immun. 2011;25(1):40–45. doi:https://doi.org/10.1016/j.bbi.2010.08.003.
- MacFabe DF. Enteric short-chain fatty acids: microbial messengers of metabolism, mitochondria, and mind: implications in autism spectrum disorders. Microb Ecol Health Dis. 2015;26(0):28177. doi:https://doi.org/10.3402/mehd.v26.28177.
- Wang L, Christophersen CT, Sorich MJ, Gerber JP, Angley MT, Conlon MA. Elevated fecal short chain fatty acid and ammonia concentrations in children with autism spectrum disorder. Dig Dis Sci. 2012;57(8):2096–20102. doi:https://doi.org/10.1007/s10620-012-2167-7.
- Zhu X, Zhou Y, Wang Y, Wu T, Li X, Li D, Tao Y. Production of high-concentration n-caproic acid from lactate through fermentation using a newly isolated Ruminococcaceae bacterium CPB6. Biotechnol Biofuels. 2017;10(1):102. doi:https://doi.org/10.1186/s13068-017-0788-y.
- Zhao X, Ross EJ, Wang Y, Horwitz BH. Nfkb1 inhibits LPS-induced IFN-β and IL-12 p40 production in macrophages by distinct mechanisms. PLoS One. 2012;7(3):e32811. doi:https://doi.org/10.1371/journal.pone.0032811.
- Saghazadeh A, Ataeinia B, Keynejad K, Abdolalizadeh A, Hirbod-Mobarakeh A, Rezaei N. A meta-analysis of pro-inflammatory cytokines in autism spectrum disorders: effects of age, gender, and latitude. J Psychiatr Res. 2019;115:90–102. doi:https://doi.org/10.1016/j.jpsychires.2019.05.019.
- Dinan TG, Cryan JF. The microbiome-gut-brain axis in health and disease. Gastroenterol Clinics North Am. 2017;46(1):77–89. doi:https://doi.org/10.1016/j.gtc.2016.09.007.
- Chen R, Davis LK, Guter S, Wei Q, Jacob S, Potter MH, Cox NJ, Cook EH, Sutcliffe JS, Li B, et al. Leveraging blood serotonin as an endophenotype to identify de novo and rare variants involved in autism. Mol Autism. 2017;8(1):14. doi:https://doi.org/10.1186/s13229-017-0130-3.
- Israelyan N, Margolis KG. Serotonin as a link between the gut-brain-microbiome axis in autism spectrum disorders. Pharmacol Res. 2018;132:1–6. doi:https://doi.org/10.1016/j.phrs.2018.03.020.
- Murch SJ, KrishnaRaj S, Saxena PK. Tryptophan is a precursor for melatonin and serotonin biosynthesis in in vitro regenerated St. John’s Wort (Hypericum Perforatum L. Cv. Anthos) Plants Plant Cell Rep. 2000;19:698–704.
- Bravo JA, Forsythe P, Chew MV, Escaravage E, Savignac HM, Dinan TG, Bienenstock J, Cryan JF. Ingestion of Lactobacillus strain regulates emotional behavior and central GABA receptor expression in a mouse via the vagus nerve. Proc Natl Acad Sci USA. 2011;108(38):16050–16055. doi:https://doi.org/10.1073/pnas.1102999108.
- McCormick D. GABA as an inhibitory neurotransmitter in human cerebral cortex. J Neurophysiol. 1989;62(5):1018–1027. doi:https://doi.org/10.1152/jn.1989.62.5.1018.
- Al-Otaish H, Al-Ayadhi L, Bjørklund G, Chirumbolo S, El-Ansary A. Relationship between absolute and relative ratios of glutamate, glutamine and GABA and severity of autism spectrum disorder. Metab Brain Dis. 2018;33(3):1–12. doi:https://doi.org/10.1007/s11011-018-0186-6.
- Barrett E, Ross RP, O’Toole PW, Fitzgerald GF, Stanton C. Gamma-aminobutyric acid production by culturable bacteria from the human intestine. J Appl Microbiol. 2012;113(2):411–417. doi:https://doi.org/10.1111/j.1365-2672.2012.05344.x.
- Masuda F, Nakajima S, Miyazaki T, Yoshida K, Tsugawa S, Wada M, Ogyu K, Croarkin PE, Blumberger DM, Daskalakis ZJ, et al. Motor cortex excitability and inhibitory imbalance in autism spectrum disorder assessed with transcranial magnetic stimulation: a systematic review. Transl Psychiatry. 2019;9(1):110. doi:https://doi.org/10.1038/s41398-019-0444-3.
- Pavăl D. A dopamine hypothesis of autism spectrum disorder. Dev Neurosci. 2017;39(5):355–360. doi:https://doi.org/10.1159/000478725.
- Karvat G, Kimchi T. Acetylcholine elevation relieves cognitive rigidity and social deficiency in a mouse model of autism. Neuropsychopharmacology. 2014;39(4):831–840. doi:https://doi.org/10.1038/npp.2013.274.
- Hellmer K, Nyström P. Infant acetylcholine, dopamine, and melatonin dysregulation: neonatal biomarkers and causal factors for ASD and ADHD phenotypes. Med Hypotheses. 2017;100:64–66. doi:https://doi.org/10.1016/j.mehy.2017.01.015.
- Aquilano K, Baldelli S, Ciriolo MR. Glutathione: new roles in redox signaling for an old antioxidant. Front Pharmacol. 2014;5:196. doi:https://doi.org/10.3389/fphar.2014.00196.
- Faber S, Fahrenholz T, Wolle MM, Kern II JC, Pamuku M, Miller L, Jamrom J, Skip Kingston HM. Chronic exposure to xenobiotic pollution leads to significantly higher total glutathione and lower reduced to oxidized glutathione ratio in red blood cells of children with autism. Free Radic Biol Med. 2019;134:666–677. doi:https://doi.org/10.1016/j.freeradbiomed.2019.02.009.
- Frustaci A, Neri M, Cesario A, Adams JB, Domenici E, Bernardina BD, Bonassi S. Oxidative stress-related biomarkers in autism: systematic review and meta-analyses. Free Radic Biol Med. 2012;52(10):2128–2141. doi:https://doi.org/10.1016/j.freeradbiomed.2012.03.011.
- Wang M, Wan J, Rong H, He F, Wang H, Zhou J, Cai C, Wang Y, Xu R, Yin Z, et al. Alterations in gut glutamate metabolism associated with changes in gut microbiota composition in children with autism spectrum disorder. mSystems. 2019:4:e00321–18.
- McGuire A. Diagnosing the diagnostic and statistical manual of mental disorders. Psychiatry Res. 2015;25:1–4.
- Caporaso JG, Kuczynski J, Stombaugh J, Bittinger K, Bushman FD, Costello EK, Fierer N, Peña AG, Goodrich JK, Gordon JI, et al. QIIME allows analysis of high-throughput community sequencing data. Nat Methods. 2010;7(5):335–346. doi:https://doi.org/10.1038/nmeth.f.303.
- Bolyen E, Rideout JR, Dillon MR, Bokulich NA, Abnet CC, Al-Ghalith GA, Alexander H, Alm EJ, Arumugam M, Asnicar F, et al. Reproducible, interactive, scalable and extensible microbiome data science using QIIME 2. Nat Biotechnol. 2019;37(8):852–857. doi:https://doi.org/10.1038/s41587-019-0209-9.
- Edgar RC, Haas BJ, Clemente JC, Quince C, Knight R. UCHIME improves sensitivity and speed of chimera detection. Bioinformatics. 2011;27(16):2194–2200. doi:https://doi.org/10.1093/bioinformatics/btr381.
- Edgar RC. UPARSE: highly accurate OTU sequences from microbial amplicon reads. Nat Methods. 2013;10(10):996. doi:https://doi.org/10.1038/nmeth.2604.
- Wang Q, Garrity GM, Tiedje JM, Cole JR. Naive Bayesian classifier for rapid assignment of rRNA sequences into the new bacterial taxonomy. Applied and Environmental Microbiology. 2007;73(16):5261–5267. doi:https://doi.org/10.1128/AEM.00062-07.
- Luo R, Liu B, Xie Y, Li Z, Huang W, Yuan J, He G, Chen Y, Pan Q, Liu Y, et al. SOAPdenovo2: an empirically improved memory-efficient short-read novoassembler. Gigascience. 2012;1(1):18. doi:https://doi.org/10.1186/2047-217X-1-18.
- Borodovsky M, Lomsadze A. Eukaryotic gene prediction using GeneMark.hmm-E and GeneMark-ES. Curr Protocols Bioinf. 2011;35(1):4.6.1–4.6.10. doi:https://doi.org/10.1002/0471250953.bi0406s35.
- Li W, Godzik A. Cd-Hit: a fast program for clustering and comparing large sets of protein or nucleotide sequences. Bioinformatics. 2006;22(13):1658. doi:https://doi.org/10.1093/bioinformatics/btl158.
- Buchfink B, Xie C, Huson DH. Fast and sensitive protein alignment using DIAMOND. Nat Methods. 2015;12(1):59. doi:https://doi.org/10.1038/nmeth.3176.
- Huson DH, Beier S, Flade I, Górska A, Tappu R. MEGAN community edition - interactive exploration and analysis of large-scale microbiome sequencing data. PLoS Comput Biol. 2016;12(6):e1004957. doi:https://doi.org/10.1371/journal.pcbi.1004957.
- Feng Q, Liang S, Jia H, Stadlmayr A, Tang L, Lan Z, Zhang D, Xia H, Xu X, Jie Z, et al. Gut microbiome development along the colorectal adenoma-carcinoma sequence. Nat Commun. 2015;6(1):6528. doi:https://doi.org/10.1038/ncomms7528.
- Li J, Jia H, Cai X, Zhong H, Feng Q, Sunagawa S, Arumugam M, Kultima JR, Prifti E, Nielsen T, et al. An integrated catalog of reference genes in the human gut microbiome. Nat Biotechnol. 2014;32(8):834. doi:https://doi.org/10.1038/nbt.2942.
- Martínez JL, Coque TM, Baquero F. What is a resistance gene? Ranking risk in resistomes. Nat Rev Microbiol. 2015;13(2):116. doi:https://doi.org/10.1038/nrmicro3399.
- Yang Y, Li B, Ju F, Zhang T. Exploring variation of antibiotic resistance genes in activated sludge over a four-year period through a metagenomic approach. Environ Sci Technol. 2013;47(18):10197–10205. doi:https://doi.org/10.1021/es4017365.
- Wang J, Zheng J, Shi W, Du N, Xu X, Zhang Y, Ji P, Zhang F, Jia Z, Wang Y, et al. Dysbiosis of maternal and neonatal microbiota associated with gestational diabetes mellitus. Gut. 2018;67(9):1614–1625. doi:https://doi.org/10.1136/gutjnl-2018-315988.
- Shannon P. Cytoscape: a software environment for integrated models of biomolecular interaction networks. Genome Res. 2003;13(11):2498. doi:https://doi.org/10.1101/gr.1239303.
- Kuntal BK, Chandrakar P, Sadhu S, Mande SS. ‘NetShift’: a methodology for understanding ‘driver microbes’ from healthy and disease microbiome datasets. Isme J. 2018;4:442–454.
- Mario S, Cristina Q, Carlos A, Beatriz S. Phenolic compounds in chilean mistletoe (quintral, tristerix tetrandus) analyzed by UHPLC–Q/Orbitrap/MS/MS and its antioxidant properties. Molecules. 2016;21(3):245. doi:https://doi.org/10.3390/molecules21030245.
- Li J, Zhao F, Wang Y, Chen J, Tao J, Tian G, Wu S, Liu W, Cui Q, Geng B, et al. Gut microbiota dysbiosis contributes to the development of hypertension. Microbiome. 2017;5(1):14. doi:https://doi.org/10.1186/s40168-016-0222-x.
- Smith CA, Want EJ, O’Maille G, Ruben Abagyan A, Siuzdak G. XCMS: processing mass spectrometry data for metabolite profiling using nonlinear peak alignment, matching, and identification. Anal Chem. 2006;78(3):779–787. doi:https://doi.org/10.1021/ac051437y.
- Wishart DS, Feunang YD, Marc A, et al. HMDB 4.0: the human metabolome database for 2018. Nucleic Acids Res. 2018;46(D1):D608–D617. doi:https://doi.org/10.1093/nar/gkx1089.
- Worley B, Powers R. Multivariate analysis in metabolomics. Curr Metabolomics. 2013;1(1):92–107. doi:https://doi.org/10.2174/2213235X11301010092.
- Falony G, Joossens M, Vieira-Silva S, Wang J, Darzi Y, Faust K, Kurilshikov A, Bonder MJ, Valles-Colomer M, Vandeputte D, et al. Population-level analysis of gut microbiome variation. Science. 2016;352(6285):560. doi:https://doi.org/10.1126/science.aad3503.
- Segata N, Izard J, Waldron L, Gevers D, Miropolsky L, Garrett WS, Huttenhower C. Metagenomic biomarker discovery and explanation. Genome Biol. 2011;12(6):R60. doi:https://doi.org/10.1186/gb-2011-12-6-r60.
- Guo W, Rao MB. On optimality of the Benjamini–Hochberg procedure for the false discovery rate. Stat Probab Lett. 2008;78(14):2024–2030. doi:https://doi.org/10.1016/j.spl.2008.01.069.