
ABSTRACT
Gastrointestinal (GI) microbiota play an important role in human health and wellbeing and the first wave of gut microbes arrives mostly through vertical transmission from mother to child. This study has undertaken to understand the microbiota profile of healthy Southeast Asian mother-infant pairs. Here, we examined the fecal, vaginal and breast milk microbiota of Indonesian mothers and the fecal microbiota of their children from less than 1 month to 48 months old. To determine the immune status of children and the effect of diet at different ages, we examined the level of cytokines, bile acids in the fecal water and weaning food frequency. The fecal microbiota of the children before weaning contained mainly Bacteroides and Bifidobacterium, which presented at low abundance in the samples of mothers. After weaning, the fecal microbiome of children was mainly of the Prevotella type, with decreasing levels of Bifidobacterium, thus becoming more like the fecal microbiome of the mother. The abundance of infant fecal commensals generally correlated inversely with potential pathogens before weaning. The fecal Bifidobacterium in children correlated inversely with the consumption of complex carbohydrates and fruits after weaning. The specific cytokines related to the proliferation and maturation of immunity were found to increase after weaning. A decreasing level of primary bile acids and an increase of secondary bile acids were observed after weaning. This study highlights the change in the GI microbiota of infants to adult-type microbiota after weaning and identifies diet as a major contributing factor.
Introduction
The human body harbors an abundance of microbes on all mucosal surfaces. The composition and activity of these microbes form a symbiosis with the human host.Citation1–Citation4 The mature human gastrointestinal (GI) microbiome type has been categorized into two operational types, determined largely by diet, geographic location, and lifestyle: the Bacteroides-Bifidobacterium type and Prevotella type.Citation5–Citation9 The former type is predominant among Europeans, North Americans, and Eastern Asians,Citation5,Citation9–Citation11 whereas the latter is common among Southeast Asians, Mongolians, and Africans.Citation5,Citation10,Citation12 Mothers transfer their microbiomes to their children during pregnancy and delivery.Citation13–Citation16 After birth, the vertical mother-to-infant transmission takes place mainly through the gut, the vagina, the breast milk, the oral cavity and the skin.Citation16–Citation23 Vaginally delivered newborns of Western mothers have been reported to possess an identical GI microbiome type – the Bacteroides-Bifidobacterium type – to that of the mother,Citation17,Citation22–Citation25 although the relative abundance of the microbiota changes in the first year of life.Citation19,Citation24,Citation26–Citation28 The GI microbiota, particularly Bifidobacterium, play an important role in health and disease programming for later stages of life and in modulating the development of the immune system, mental capacity and other physiological functions.Citation29–Citation32 This implies that a hereditary composition of the microbiome of infants ensures the health and wellbeing of the children. Since Southeast Asians with the Prevotella type microbiome have low levels of Bifidobacterium,Citation8,Citation10 this also implies potential health hazard for infants and thus warrants special attention. However, there is no Southeast Asian study on the relationship between the microbiomes of mothers and infants. Thus, the aim of this study is to track GI (as reflected in fecal) microbiota profiles among Indonesian mothers and their vaginally delivered, full-term, breastfed infants from birth (the first month of life) to 48 months old. This study addresses microbiome development among natural, full-term, breastfed infants, since their microbiome constitution is known to be influenced by route of birth,Citation33–Citation35 antibiotics administration during delivery,Citation36,Citation37 gestational age,Citation38,Citation39 type of feeding,Citation16,Citation40,Citation41 introduction of solid foodsCitation8,Citation11,Citation12 and environmental factors.Citation42 Unexpectedly, we found that the newly born infant (before weaning) had a Bacteroides-Bifidobacterium microbiome type, which was different from their mothers’ Prevotella-type and that the transition from Bacteroides-Bifidobacterium to Prevotella occurred during weaning.
Results
Fecal microbiota profiles of infants and their mothers
As shown in , the infants’ fecal microbiota profiles were clustered separately from those of the mothers (p < .05) across all the age time points. The microbiota profiles of mothers were highly similar across all infant age groups (). On the other hand, there was significant variation in the fecal microbiota profiles of the children across the age groups (), including a reduction in the relative abundance of Bifidobacterium, Bacteroides, Klebsiella, and bacteria from the family Enterobacteriaceae along with increasing age. The mean abundance of Bifidobacterium was 2.5% ± SD 4.5% of total operational taxonomic units (OTUs) among the mothers in the study. From 6-<12 months onwards, the genera Prevotella, Blautia, Faecalibacterium, and Ruminococcaceae were detected in the fecal samples of the children. The abundance of these microbiota in the first 6 months of life was low (below 1% of total OTUs). After 6 months, the children started weaning. From this point, the children’s fecal bacteria profiles appeared to shift toward their mothers’ profile, with less microbiota showing differences in abundance between children and mothers. The profiles of the children and mothers were clustered at the period 24–48 months (). The most common OTUs at this period included Prevotella, Lachospiraceae, Faecalibacterium, Blautia, Ruminococcaceae, Bacteroides, Bifidobacterium, Enterobacteriaceae and Klebsiella.
Figure 1. (a and b): Square root linear-contrast PCA of the fecal microbiome of children and mothers for children’s ages of less than 1 month to 48 months. (a) The biplot shows the weight and direction of fecal bacterial genera and environment vectors in the Bray-Curtis distance matrix. Samples from each group are represented by different colors and symbols. Different patterns inside the symbols represent the different age groups. The numbers of mothers and children are provided in parentheses in the legend. (b) Comparison of relative abundance of nine bacterial genera among more than 1% of total OTUs in fecal samples of children and mothers across the age of less than 1 month to 48 months of children. The bacteria, which were significantly different between fecal samples of children and mothers, are represented as **** p < .0001, *** p ≥ 0.0001 – < 0.001, ** p ≥ 0.001 – < 0.01, * p < .05. BF = fecal samples of children, MF = fecal samples of mothers. A = less than 1 month old (BF = 18, MF = 12), B = 1–<3 months old (BF = 10,MF = 7), C = 3–<6 months old (BF = 23, MF = 13), D = 6–<12 months old (BF = 18, MF = 11), E = 12–<24 months old (BF = 18, MF = 12), F = 24–48 months old (BF = 30, MF = 8).
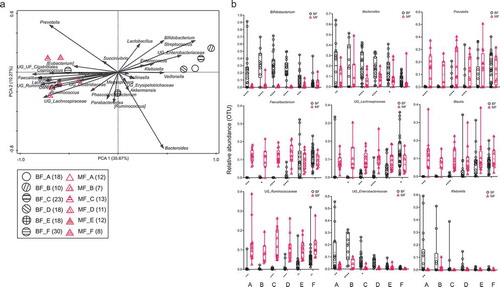
The microbiota of mothers’ and children’s feces during the children’s first month of life shared 5.2% (). The shared OTUs of the children’s and mothers’ fecal microbiota increased after weaning (6-<12 months) from 10.6% to 34.3% at 24–48 months.
Table 1. Shared OTUs between the mothers’ samples and the fecal samples of the children (%).
Vaginal microbiota profile of mothers
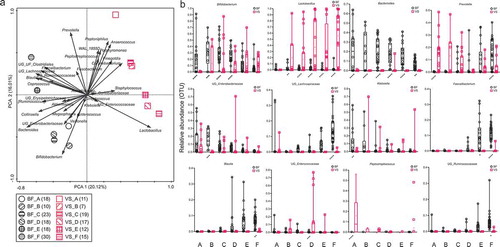
At none of the infant age groups were the fecal microbiota profiles of children close to the maternal vaginal microbiota profiles (), even though all the infants were vaginally delivered. The shared microbiota of children’s feces in the first month of life and mothers’ vagina was 9.2% (). The abundance of Prevotella in the vaginal microbiota was the highest when the children were less than 1 month old () and gradually reduced thereafter. Lactobacillus was the most abundant throughout the different age groups apart from the first month of life. After 24 months of age, Prevotella made up about 10% of the total fecal OTUs of most of the children (66.7% of children).
Figure 2. (a and b): Square root linear-contrast PCA of fecal samples of children and vaginal swab samples of mothers for children’s ages of less than 1 month to 48 months. (a) The biplot shows the weight and direction of bacterial genera and environment vectors in the Bray-Curtis distance matrix. Samples from each group are represented by different colors and symbols. Different patterns inside the symbols represent the different age groups. The numbers of mothers and children are provided in parentheses in the legend. (b) Comparison of relative abundance of 12 bacterial genera among more than 1% of total OTUs in fecal samples of children and vaginal swab samples of mothers for children’s ages of less than 1 month to 48 months. The bacteria, which were significantly different between fecal samples of children and vaginal swabs of mothers, are represented as **** p < .0001, *** p ≥ 0.0001 – < 0.001, ** p ≥ 0.001 – < 0.01, * p < .05. BF = fecal samples of children, VS = vaginal swab samples of mothers. A = less than 1 month old (BF = 18, VS = 16), B = 1–<3 months old (BF = 10,VS = 7), C = 3–<6 months old (BF = 23, VS = 19), D = 6–<12 months old (BF = 18, VS = 17), E = 12–<24 months old (BF = 18, VS = 12), F = 24–48 months old (BF = 30, VS = 15).
Breast milk microbiota profiles of mothers
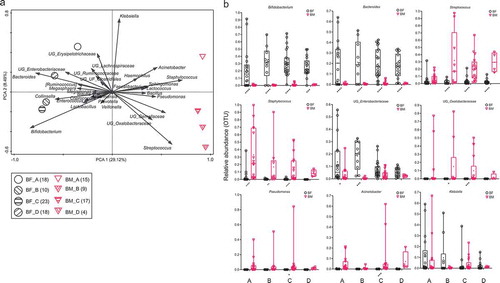
The microbiota profiles of mothers’ milk were also clearly different from those of the children’s feces at all ages (). The shared microbiota of children’s feces during the first month of life and mothers’ milk was 11.0% (). Bifidobacterium and Bacteroides (except 3-<6 months at 1%) each made up less than 1% of the total OTUs among the breast milk microbiota at all periods. Staphylococcus was the most abundant breast milk bacteria during the first month of life of infants, and subsequently, the abundance of Streptococcus was the highest.
Figure 3. (a and b): Square root linear-contrast PCA of fecal samples of children and breast milk samples of mothers for children’s ages of less than 1 month to 12 months. (a) The biplot shows the weight and direction of bacterial genera and environment vectors in the Bray-Curtis distance matrix. Samples from each group are represented by different colors and symbols. Different patterns inside the symbols represent the different age groups. The numbers of mothers and children are provided in parentheses in the legend. (b) Comparison of relative abundance of nine bacterial genera among more than 1% of total OTUs in fecal samples of children and breast milk samples of mothers for children’s ages of less than 1 month to 12 months. The bacteria, which were significantly different between fecal samples of children and breast milk samples of mothers, are represented as **** p < .0001, *** p ≥ 0.0001 – < 0.001, ** p ≥ 0.001 – < 0.01, * p < .05. BF = fecal samples of children, BM = breast milk samples of mothers. A = less than 1 month old (BF = 18, BM = 15), B = 1–<3 months old (BF = 10, BM = 9), C = 3–<6 months old (BF = 23, BM = 17), D = 6–<12 months old (BF = 18, BM = 4).
Cytokines content of children’s fecal water
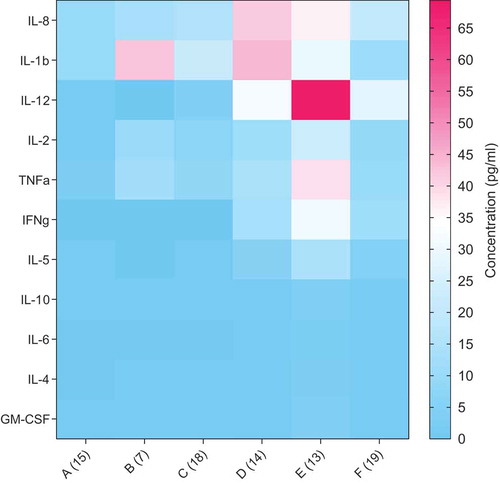
Low levels of immune regulatory cytokines, namely IL-1β, −2, −5, −8, −12, TNF-α and IFN-ββ were found in infants’ fecal water before weaning (<12 months), except IL-1β at 1–3 months. They were greatly enhanced after weaning up to 24 months (). Among these cytokines, IL-12 levels peaked at 12-<24 months. The cytokine levels were generally reduced at 24–48 months. Anti-inflammatory cytokines, such as IL-4, −6 and −10, were low across all ages of children.
Figure 4. Comparison of concentration of cytokines in fecal water samples of children from the age of less than 1 month to 48 months. The data are expressed as the mean concentration in pg/ml. The number of samples is provided in parentheses at the X-axis. A = less than 1 month old, B = 1–<3 months old, C = 3–<6 months old, D = 6–<12 months old, E = 12–<24 months old and F = 24–48 months old.
Fecal commensals and potentially pathogenic bacteria
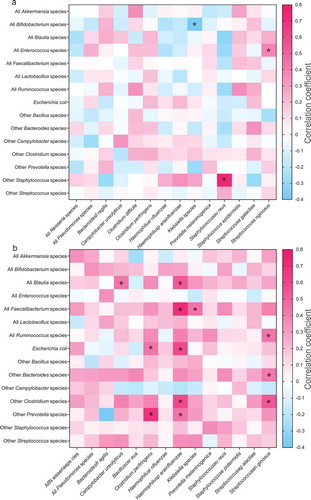
The correlation between commensals and potentially pathogenic bacteria before weaning and after weaning is shown in . The correlation index indicates the degree of correlation between two groups of bacteria. A value of zero in a fecal commensal and potential pathogen pair implies no correlation in their abundance, whereas positive and negative values suggest positive and negative correlations. Interestingly, a higher percentage of commensal bacteria was found to be negatively associated with potential bacterial pathogens before weaning (, 46% negative correlation, with three pairs showing p-adjusted threshold of < 0.05) compared to after weaning (, 18% negative, with 12 pairs showing p-adjusted threshold of < 0.05). The correlation index was 4.85 before weaning and 30.97 after weaning.
Figure 5. Correlation of known pathogens (X-axis) and known commensal gut species (Y-axis) at the species level of abundances (a) before and (b) after weaning (6–<12 months old) in the fecal samples of children. Spearman correlation coefficient values are plotted and presented as a heatmap. Positive and negative correlations are represented by different colors according to the gradient scales of the correlation coefficient. The significantly different correlations are represented as **** p < .0001, *** p ≥ 0.0001 – < 0.001, ** p ≥ 0.001 – < 0.01, * p < .05.
Bile acids content in children’s fecal water
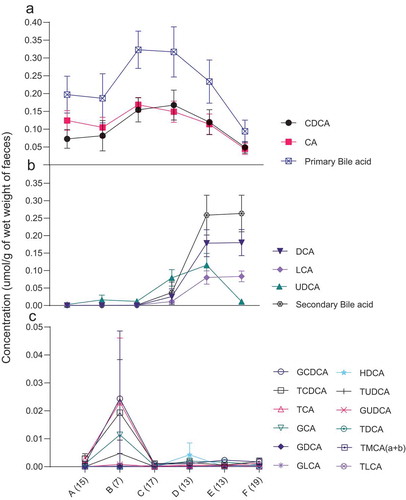
High levels of free primary bile acids were detected in the fecal water of the infants before weaning (), but these levels progressively decreased to about a third of those levels after weaning. A reverse trend was observed for the level of secondary bile acids, which increased by 228 times after weaning ().
Figure 6. Comparison of concentration of free bile acids – (a) primary bile acids (CDCA, CA) (b) secondary bile acids (DCA, LCA, UDCA) (c) 12 bile acids – in fecal water samples of children from the age of less than 1 month to 48 months. The mean and standard error of the mean (SEM) are presented. Numbers of samples are described in parentheses at the X-axis. A = less than 1 month old, B = 1–<3 months old, C = 3–<6 months old, D = 6–<12 months old, E = 12–<24 months old, F = 24–48 months old age. CDCA = chenodeoxycholic acid, CA = colic acid, UDCA = ursodeoxycholic acid, DCA = deoxycholic acid, LCA = lithocholic acid, GCDCA = glycochenodeoxycholic acid, TCDCA = taurochenodeoxycholic acid, TCA = taurocholic acid, GCA = glycocholic acid, GDCA = glycodeoxycholic acid, GLCA = glycolithocholic acid, HDCA = hyodeoxycholic acid, TUDCA = tauroursodeoxycholic acid, GUDCA = glycoursodeoxycholic acid, TDCA = taurodeoxycholic acid, TMCA (a + b) = alpha- and beta-tauromuricholic acid, TLCA = taurolithocholic acid.
Correlation between the abundance of fecal microbiota and children’s diet
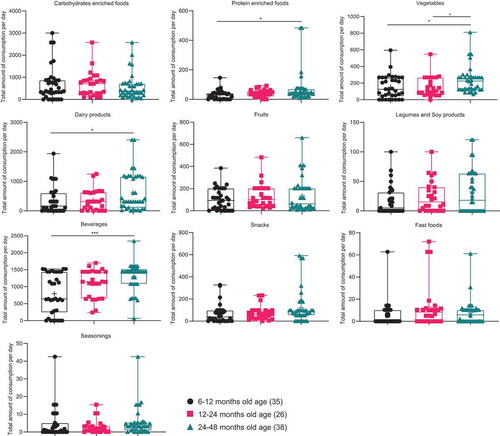
The children consumed significantly more meats, vegetables, dairy products, and beverages as they aged (). Several correlations were found between the abundance of specific fecal bacteria genera and the diet for the weaned infants (). Bifidobacterium was significantly associated with more than one food group. It was negatively associated with complex carbohydrates (mainly Indica rice) at 6-<12 months, with local fruits at 12-<24 months, and dairy products at 24–48 months. Bifidobacterium was positively associated with fast food and seasoning at 6-<12 months.
Table 2. Correlation between fecal bacterial genus abundance (> 1% of total OTUs) and amount of certain food groups children consumed per day at ages (a) 6–12 months, (b) 12–24 months and (c) 24–48 months.
Figure 7. Comparison of the total amount of dietary consumption (g) per day of children aged 6–48 months. The foods, which were significantly different between three age groups of children, are represented as **** p < .0001, *** p ≥ 0.0001 – < 0.001, ** p ≥ 0.001 – < 0.01, * p < .05.
Besides their effect on Bifidobacterium, complex carbohydrates appeared to have the most influence on bacterial abundance at younger children (6-<24 months), including a positive correlation with Lachnospiraceae, Ruminococcaceae, Clostridiales, Phascolarctobacterium and Lachnospira among those aged 6-<12 months, and Bacteroides, Ruminococcus, Akkermansia and Succinivibrio among the 12-<24 months. A negative correlation between complex carbohydrates and Phascolarctobacterium was observed at 12-<24 months.
Apart from their effect on Bifidobacterium, local fruits appeared to have more influence on bacterial abundance at the older age (12-<48 months). A positive correlation was observed between fruit consumption and Coprococcus and Ruminococcus at 12-<24 months, whereas fruit consumption was negatively correlated with Phascolarctobacterium at 6-<12 months, Lactobacillus at 12-<24 months, Ruminococcaceae, Akkermansia and Parabacteroides at 24-<48 months. Other food groups also influenced the fecal microbiota of children and are presented in .
Discussion
Bacteroides, Bifidobacterium, and Enterobacteriaceae were the dominant fecal bacteria in children during early life in this study, which has been reported in studies conducted in the Western countries.Citation19,Citation24–Citation26 The variation with age observed in the microbiota profile of the children’s fecal samples was due to the appearance of certain genera in the older age groups. In the 6–12 months and 12–24 months age groups, Prevotella, Blautia, Faecalibacterium, Lachnospiraceae, and Ruminococcaceae were the genera found. At the same time, the relative abundance of Bacteroides, Bifidobacterium, Enterobacteriaceae, and Klebsiella diminished after weaning (6-<12 months) and stabilized at lower levels at 24–48 months.
The rapid (less than one month after birth) establishment of the children’ GI microbiota as reflected in the fecal microbiota, from the mothers’ minority GI microbiota (in this case, Bacteroides and Bifidobacterium) may indicate swift growth and expansion of the microbiota in the GI tracts of the newborns when the GI environmental conditions are favorable for their proliferation and colonization. This calls into question the reason for the delay in the establishment of Bifidobacterium and Bacteroides in Cesarean-delivered infants, even those who are breastfed.Citation24,Citation43 It has been assumed that such delayed establishment is due to low vertical transmission from mother to child.Citation24,Citation43 However, as this study shows, it does not require high inoculation for a bacterium to rapidly establish in the GI tract during early infancy. It is possible that Cesarean section medical procedure, itself could instead alter the GI environment, hindering the establishment of commensal bacteria.
Human milk oligosaccharides promote the growth and colonization of Bifidobacterium before weaning.Citation44–Citation46 Furthermore, breast milk is high in fat,Citation47 which may induce secretion of bile acids in the GI, inhibit Prevotella and facilitate the proliferation of Bacteroides and Bifidobacterium, as reported in the literature.Citation48,Citation49 High levels of free primary bile acids were detected in the fecal water of children before weaning (). The changes in the GI microbiome after weaning resulted in the conversion of primary bile acids to secondary bile acids (), which is supported by a study of Japanese infants.Citation50
The function of Bacteroides and Bifidobacterium before weaning and the reason that they are prevalent in children’ GI requires attention. In the case of Indonesians, Bacteroides and Bifidobacterium are less likely contribute to the digestion of nutrients in adulthood, as shown in the shift of major microbiota from Bacteroides and Bifidobacterium to Prevotella upon weaning (up to 48 months old) and low prevalence of Bacteroides and Bifidobacterium in mothers (adults).
In this study, cytokines, which are responsible for proliferation and maturation of immune cells and the immune system (IL-1β, −2, −5, −8, −12, TNF-α and IFN-β), were found to be upregulated after weaning (). This implies that the active immunity of children develops around the weaning period. In a study of mice, Bacteroides fragilis colonization was found to suppress pro-inflammatory TH17 cell responses.Citation51 The abundance of Bacteroides found before weaning in this study suggests a possible down-regulation of pro-inflammatory cells.
Prevotella was the most abundant in the vaginal samples of mothers whose children were <1 month old (). The mothers may have inoculated their children heavily with Prevotella, but the bacterium may have been maintained in the children at a low level during the breastfeeding period and turned dominant after the children consuming the foods provided by the mothers upon weaning. Interestingly, the vaginal microbiota of European and North American mothers, whose GI microbiota are of the Bacteroides-Bifidobacterium type, are high in Prevotella,Citation16,Citation19 although Prevotella does not have a role in high fat/protein European and North American diets after weaning.Citation8,Citation11 The intrinsic factors for the establishment of Prevotella in the vaginas of mothers could be entrenched despite changes in dietary patterns in the developed country in recent years. The early human diet was largely vegetable-based, like the diet of Indonesians today.
Maternal microbiota transmission was still identified as the main source of children’s GI microbiota as all the microbiota of the children could be found in mothers (–). However, the high number of OTUs in mothers that were not shared with the children () indicates that only a small proportion of the GI, vagina, and breast milk microbiota from the mothers were able to establish in the GI of their children at the early age. The predominant microbiota of the mothers did not have an advantage in colonizing the GI tracts of the children. One explanation for the colonization of the infants’ GI by the mothers’ nondominant strains may be the selective preference of specific functional genes of the infants.Citation23,Citation52
The GI microbiota may have been transmitted not only vertically but also horizontally.Citation53 Nevertheless, as this and other studies have found, the percentages of shared fecal OTUs between mothers and children increased with age ().Citation22,Citation24 The fact that fecal samples of older children shared more OTUs with the vaginal swab of their mothers compared to those of younger children could reflect personal hygiene practices among the Indonesian subjects ().
The correlation index for fecal commensals and pathogens was 4.9 before weaning and 31.0 after weaning. This implies that commensal bacteria, in conjunction with the passive immunity provided by immunoglobulins and antibodies in the mothers’ breast milk, may have suppressed and prevented overgrowth of potential pathogens. These commensals protect children from potential pathogens before the development of immunity around the time of weaning. This was particularly important for the survival of pre-weaned children in the early period of human history when hygiene was not a common practice and remains so in developing countries. If this is the case, human pathogens of concern in the early history could be different from the potential pathogens detected in fecal samples in this study as Bifidobacterium, Bacteroides and Prevotella showed a negative correlation with the same groups of potential pathogens before weaning. Vibrio cholera is the most widespread fatal GI pathogen reported in developing countries but it was not identified in this study. Clostridiales have been reported to protect against GI colonization by bacterial pathogens in an animal model.Citation54 However, Clostridiales accounted for less than 1% of total OTUs in the first 6 months of life.
Bifidobacterium was negatively associated with complex carbohydrates, local fruits, and dairy products at various age groups. This study () supports a previous findingCitation10 of a negative association of Bifidobacterium with the presence of resistant starch. The main staple carbohydrate of Indonesia is Indica rice, which is high in resistant starch. Its presence due to consumption of rice after weaning and persistence in the GI tract lead to the removal of free bile acids from the lumen, which may have enabled Prevotella to proliferate and reduced the abundance of Bifidobacterium, as proposed in the literature.Citation10
Besides, Prevotella is a carbohydrate fermenter,Citation10,Citation11 which would proliferate in the high carbohydrate diet of the Indonesians. Furthermore, local fruits and dairy products appear to have inhibited the proliferation of Bifidobacterium in a strong dose-dependent matter (). Local fruits may produce anti-microbial biomolecules for self-preservation in a high temperature environment which favored microbial proliferation.Citation55–Citation57 In this case, Bifidobacterium could be one of the sensitive microbes, which needs to be further verified. This may explain the drastic decrease in the abundance of Bifidobacterium in the fecal samples of children after weaning and its low abundance in mothers (). In special cases where children consumed more fast foods, the digestible carbohydrate in the wheat-based foods, such as buns, and in potato chips may lead to the positive correlation between fast foods and Bifidobacterium ().Citation10,Citation58
The health-promoting functions of Bifidobacterium observed in European, North American and East Asian childrenCitation29-Citation32,Citation43,Citation54 may, in Indonesians, have been replaced by other commensal bacteria, such as Enterococcus faecalis.Citation59,Citation60 At 24–48 months, a matured, balanced microbiome resembling that of the mothers may have developed in the children, because of the convergence of their diets. The immune system may have approached maturation at 24–48 months, leading to the downregulation of regulatory cytokines, namely IL-1β, −2, −5, −8, −12, TNF-α and IFN-γ ().
Conclusions
The study suggests that:
The establishment of the predominant bacteria in infants is relatively rapid (within one month after birth) and that it can be initiated by only a small number of seeding bacterial cells from the mothers, such as Bacteroides and Bifidobacterium which were parts of minority microbiota in all mother’s samples (feces, breast milk, and vagina).
The predominant microbiota of children before weaning are associated with intrinsic and extrinsic factors, such as bile concentration, and cytokines, and possibly milk oligosaccharides and mucin glycan (proposed in literature, not measured in this study) which may favor Bacteroides and Bifidobacterium.
Bacteroides and Bifidobacterium are negatively associated with potential pathogens before weaning. Their roles in the protection against infectious diseases need to be verified in clinical studies.
Dietary shift after weaning modifies the fecal microbiota of the children from Bacteroides and Bifidobacterium to Prevotella.
Taken together, the data suggest that the children’s microbiota profiles were largely determined by the GI environment and dietary components rather than maternal transfer. In other words, certain intrinsic and extrinsic factors may determine the preferred microbiota that colonize the GI tract in children. This has important implications for approaches to remediating GI microbiota dysbiosis.
Methods
Study design
Recruitment of subjects
Three hundred healthy Indonesian mothers and their children under 4 years old were recruited from three community health centers in Yogyakarta, Indonesia. The inclusion criteria for recruitment of subjects were that the children had been born by normal vaginal delivery, had no history of hospitalization for serious illness at birth and had been exclusively breastfed before weaning period (6-<12 months old age). Only mothers and children who had not received intrapartum antibiotics were recruited. A total of 157 mother-child pairs participated in the study after screening for the inclusion criteria. The mother-child pairs were categorized into six groups according to the age of the child: <1 month (25 pairs), 1-<3 months (10 pairs), 3-<6 months (23 pairs), 6-<12 months (35 pairs), 12–<24 months (26 pairs) and 24-<48 months (38 pairs).
Collection of samples and dietary questionnaires
Fecal and breast milk samples and lower vaginal swabs were collected from mothers and fecal samples were collected from their children. A one-time sample collection was conducted for each mother and child. Most of the mothers in the age group 12-<24 months had stopped lactating.
On the same day of samples were collected, subjects whose children were weaned (the 6-<12, 12-<24 and 24-<48 months groups) were given the weaning food frequency questionnaire (FFQ) (Text S1). In the questionnaire, the mothers were asked to record the frequency of consumption per day/week/month and the serving size of each food item taken by their children.
Collection of fecal samples from mothers and children
The subjects were asked to collect approximately 10 g (3–5 scoops using the provided spatula) of feces which was then suspended in a collection tube containing 2 ml of RNAlater® (Ambion Inc., USA).
Collection of vaginal swabs from mothers
Health-care personnel swabbed the lower part of the vaginal region of each subject with a sterile cotton swab which was then preserved in a tube containing 1 ml of Amies Transport solution.
Collection of breast milk samples from mothers
The nipples and areola of the mother’s breast were cleaned with an alcohol swab, and approximately 5–10 ml of breast milk was collected in a sterile 50 ml tube.
Microbiome analysis
Sample processing and DNA extraction from samples
Fecal samples
Each fecal sample was further diluted 10 times by RNAlater® to make a fecal homogenate. 200 μl of each fecal homogenate was washed twice with 1x phosphate buffered saline (PBS). After washing, each fecal pellet was suspended with 300 ml of Tris-SDS solution. The mixture was transferred to a tube containing 0.3 g of glass beads (0.1 mm diameter), to which 500 ml of TE-saturated phenol (Sigma-Aldrich, USA) was added. A benchmark BeadBlaster 24 (Benchmark Scientific, Edison, USA) was used to mechanically break down the cells and the resulting lysate was centrifuged (15,000 rpm at 4°C for 5 minutes). The supernatant was transferred to a new tube containing 400 μl of phenol/chloroform/isoamyl alcohol (25:24:1) (Sigma-Aldrich, USA) was added. The supernatant and the phenol/chloroform/isoamyl alcohol were homogenized using Benchmark BeadBlaster 24. The mixture was centrifuged and 250 ml of supernatant was then transferred to a new tube, to which 25 ml of 3 M pre-chilled sodium acetate (pH 5.2) and 300 μl isopropanol (Sigma-Aldrich, USA) were added to precipitate the DNA. After the resultant supernatant was discarded, 500 ml of 70% ethanol was added to wash the DNA and the tubes were centrifuged. The supernatant was again discarded, and the tubes were dried on a heat block incubator at 60°C for 30 minutes. The DNA was then eluted by the addition of 200 ml of 1xTE buffer (pH 8.0).
Maternal vaginal swabs
The collected vaginal swabs were first vortexed for 5 minutes to resuspend the cells, and 500 μl of the aliquot from each swab was transferred to a new tube. To lyse the cells, 50 μl of lysozyme (10 mg/ml), 35 ml (140 U) of mutanolysin, 1 ml of lysostaphin and 50 ml of TE50 buffer (10 mM Tris-HCL and 50 mM EDTA, pH 8.0) were added to the tube, which was then incubated for 1 hour at 37°C. The mixture was transferred to a tube containing 0.05 g of glass beads (0.1 mm diameter), and the cells were agitated in the Benchmark BeadBlaster 24. The DNA was extracted from the resulting lysate using the QIAamp DNA Mini Kit, following the manufacturer’s protocol, and eluted by the addition of 50 μl of Buffer AE.
Breast milk samples
First, 5 ml of each breast milk sample was centrifuged at 5,000x g for 20 minutes at 4°C. After centrifugation, the top creamy layer and the remaining supernatant layer were removed and the pellet was washed twice with 1 ml of 1xPBS.
After washing, 500 μl of proteinase K, 8 μl of RNAse A stock solution (100 mg/ml), and 200 μl of Buffer AL from the QIAamp DNA Mini Kit were added to the pellet. The mixture was mixed after the addition of each reagent by pulse-vortexing for 15 seconds. After incubation at 56°C for 10 minutes, 1 ml of ethanol was added and the mixture was mixed again by pulse-vortexing for 15 seconds. The DNA was extracted from the resulting lysate using the QIAamp DNA Mini Kit, following the manufacturer’s protocol, and eluted by the addition of 50 μl of Buffer AE.
Next-generation DNA sequencing
Quantification of double-stranded DNA
The concentration of double-stranded DNA extracted was measured using the Quanti-itTM PicoGreen® kit (Invitrogen, USA). After quantification, each DNA sample was normalized to approximately 12.5 ng for polymerase chain reaction (PCR).
16 S rRNA amplicon production and purification
The KAPA HiFiTM PCR Kit (Kapa Biosystems, USA) was used in the PCR for 16 S rRNA DNA amplicon production. The reaction mixture for each DNA sample included 12.5 μl of 2x KAPA HiFiHotStart Ready Mix, 0.5 μl each of forward and reverse primers, and 11.5 μl of the normalized DNA sample. The PCR was done in a thermocycler as follows: initial denaturation at 95°C for 3 minutes, followed by 25 cycles of denaturation at 95°C for 30 seconds, annealing at 55°C for 30 seconds, extension at 72°C for 30 seconds, and a final extension cycle at 72°C for 5 minutes. After the PCR, the products were purified using Agencourt®AMPure®XP beads (Beckman Coulter, USA) and resuspended in 50 μl of 10 mMTris buffer (pH 8.5).
Addition of indices and adapters in Index PCR and purification of products
The reaction mixture for each DNA sample included 12.5 μl of 2x KAPA HiFiHotStart Ready Mix, 5 μl each of i7 and i5 primers (Illumina, USA), and 5 μl of the DNA amplicons produced in the previous PCR. The PCR was performed as follows: initial denaturation at 95°C for 3 minutes, followed by eight cycles of denaturation at 95°C for 30 seconds, annealing at 55°C for 30 seconds, extension at 72°C for 30 seconds, and a final extension at 72°C for 5 minutes. The libraries produced were purified again using Agencourt®AMPure®XP beads and resuspended in 25 μl of 10 mM Tris buffer (pH 8.5).
Library normalization, pooling, and re-quantification by Quantitative PCR (qPCR)
The library concentration for each sample was measured with the Quant-itTMPicoGreen® kit (Invitrogen, Carlsbad, CA, USA). Each library was then normalized to the required concentration with 10 mM Tris buffer (pH 8.5), and 5 μl of each normalized library was pooled into a tube. The resulting pooled amplicon library (PAL) was then re-quantified via qPCR using the KAPA Library Quantification Kit (Kapa Biosystems, USA) following the manufacturer’s protocol.
Denatur ationand dilution of library and PhiX Control
A 1:1 volume ration of 0.2 N sodium hydroxide (NaOH) and PAL was used to denature the DNA. The solution was vortexed briefly and incubated at room temperature for 5 minutes. Then, a 100x dilution of pre-chilled hybridization buffer (HT1) was added. The resultant denatured amplicon library (DAL) was diluted again with pre-chilled HT1 to a pre-defined concentration. The PhiX control was also denatured and diluted following the above procedure and spiked in at 20% to form the final combined library (the DAL and PhiX control libraries). The combined library was heat-shocked and cold-shocked before being placed in an Illumina© Miseq Desktop Sequencer (Illumina, USA) using the Miseq Reagent v2 (500 cycles) run cartridge (Illumina, USA).
Analysis of DNA sequence data
Quantitative Insights Into Microbial Ecology (QIIME) in 16 S rRNA DNA amplicon data analysis
The 16 S rRNA DNA sequence data obtained were analyzed with QIIME version 1.9.1.Citation61 In QIIME, the corresponding reverse and forward reads were joined, and the resultant paired reads were selected based on a Q-score of 25. Chimeric sequences were filtered out and removed using USEARCH v6.1.Citation62 The resultant sequences were then subjected to open-reference OTU picking, using Greengenes v13_8 as the reference database and a similarity threshold of 97%. The OTUs were then mapped using a taxa summary to further interpret the bacterial profiles of the samples. The bacterial genus data were further analyzed to compare the mothers’ and children’s profiles. The mean percentage of shared OTUs between the mothers’ and children’s samples in each children’s age group was also calculated. Using the Canoco5 software package (Microcomputer Power Co, Ithaca, USA), a principal component analysis (PCA) was performed on the square-root of Bray-Curtis distances based on the relative abundance of bacterial genus data.
Correlation index
A correlation index, comprising a summation of correlation values (r) for commensals and potential pathogens was used to quantify the degree of correlation. A zero-value correlation index implies no net correlation between any of the commensals and pathogens. The maximum positive correlation index is 168 (15 commensals x 14 pathogens x 0.8), whereas the highest negative correlation index is −84 (15 commensals x 14 pathogens x [−0.4]). The potential pathogens included were Neisseria, Pseudomonas, Bacteroides fragilis, Campylobacter ureolyticus, Clostridium difficile, Clostridium perfringens, Haemophilus influenzae, Haemophilus parainfluenzae, Klebsiella, Prevotella melaninogenica, Staphylococcus aureus, Staphylococcus epidermidis, Streptococcus agalactiae, and Streptococcus anginosus. The commensal species included were Akkermansia, Bifidobacterium, Blautia, Enterococci, Faecalibacteria, Lactobacilli, Ruminococci, Escherichia coli, other Bacilli, other Bacteroides, other Campylobacter, other Clostridia, other Prevotella, other Staphylococci, and other Streptococci.
Fecal water preparation
A mixture of 0.01 M Phenylmethylsulfonyl fluoride (PMSF) (Sigma-Aldrich, USA) and 1% Bovine Serum Albumin (BSA) in PBS solution was freshly prepared. Approximately 1 g of the freshly collected fecal sample was mixed with twice the volume of the prepared PMSF-BSA-PBS solution by vortexing. After centrifugation at 4,000 g for 5 minutes, the supernatant was transferred into a new tube and then centrifuged at 4,000 g for 10 minutes. The supernatant was transferred into another new tube and stored at −80°C for further analysis.
Fecal water cytokines analysis
Using the LUNARISTM Human 11-Plex cytokine kit (AYOXXA Biosystems, Austria), the levels of IL-1β, IL-2, IL-4, Il-5, IL-6, IL-8, IL-10, IL-12, IFN-γ, TNF-α, and GM-CSF were measured. The thawed and clear supernatant of fecal water was diluted in assay diluent 1. The diluted standards, diluted samples, and blanks (replicates) were first prepared in a 384-well microplate. All of them were transferred into a LUNARISTM BioChip and prepared according to the manufacturer’s protocol. Fluorescence images were captured with a fluorescence microscope (Zeiss Axio Imager M2, Zeiss, Germany), and quantification was performed using the LUNARISTM analysis suite included in the LUNARISTM accessory kit (AYOXXA Biosystems, Austria).
Bile acids analysis
Approximately 200 mg of fecal aliquot was mixed with three times the volume of feces extraction buffer (20 mM phosphate buffer and ethanol) (Sigma-Aldrich, USA). The homogenized samples were sonicated at 70 W and 0°C for 5 minutes after shaking at 0°C for 30 minutes. After two centrifugations, the supernatant was transferred into a new reaction tube. Then, 10 µl of the extracted fecal samples were taken for bile acids analysis using Biocrates® Bile Acids kit (Biocrates Life Sciences AG, Austria), following the manufacturer’s protocol. The analysis was conducted using the Agilent 1290 Infinity high-performance liquid chromatography system (Agilent Technologies, Germany) coupled to the AB SCIEX QTrap 5500 (mass spectrometry) (AB SCIEX Pte. Ltd, USA). The chromatograms were integrated using MultiQuant 3.0 software SCIEX (AB SCIEX Pte. Ltd, USA). The following bile acids were measured: Chenodeoxycholic acid (CDCA), colic acid (CA); ursodeoxycholic acid (UDCA), deoxycholic acid (DCA), lithocholic acid (LCA); glycochenodeoxycholic acid (GCDCA), taurochenodeoxycholic acid (TCDCA), taurocholic acid (TCA), glycocholic acid (GCA), glycodeoxycholic acid (GDCA), glycolithocholic acid (GLCA), hyodeoxycholic acid (HDCA), tauroursodeoxycholic acid (TUDCA), glycoursodeoxycholic acid (GUDCA), taurodeoxycholic acid (TDCA), alpha- and beta-tauromuricholic acid (TMCA [a + b]) taurolithocholic acid (TLCA), primary bile acids (sum of CDCA and CA) and secondary bile acids (sum of DCA, LCA, and UDCA).
Weaning foods questionnaire analysis
The food items were categorized into ten groups: complex carbohydrates, vegetables, legumes and soy, fruits, meats, dairy products, snacks, beverages, fast foods and seasonings (Text S1). The recorded frequencies and serving sizes of each food item consumed by the weaned children were calculated as consumption per day and further converted into the total amount of consumption in grams in a day.
Statistical analysis
All statistical analyses and data visualization were performed using GraphPad Prism 8 (GraphPad Software Inc., USA) and R 3.5.2 software (RStudio, Inc., USA). A permutational multivariate analysis of variance (PERMANOVA) was performed using the pairwiseAdonis R package.Citation63 The p values were corrected by post-hoc Bonferroni multiple comparisons. The two-way analysis of variance (ANOVA) and the post-hoc Bonferroni multiple comparisons test were performed on the data of the relative abundance of bacterial genera, fecal water cytokines and bile acids to check the significant differences in the distribution of bacterial abundances (> 1% of total OTUs), cytokines, and bile acids in the samples between children’s age groups and between children’s and mothers’ samples. The Kruskal-Wallis test and the post-hoc Dunn’s multiple comparisons test were performed to check for significant differences in individual food groups between children of different age groups after weaning. The Spearman non-parametric correlation test was also used to identify correlations between the OTUs of known gut commensals species and potential pathogens and between 1% of bacterial genera and the different food groups in weight using microbiome R packageCitation64 and GraphPad Prism 8.
Author contributions
Y-K. L and W. W. T. K wrote the main manuscript text. W. W. T. K, T. Y. S and S. K carried out the experimental work. W. W. T. K prepared the data analysis, performed data visualization and statistical analysis. Y-K. L and E. S. R led the study design, overall research collaboration, and coordination. S. S and J. N edited the manuscript. All authors reviewed the manuscript.
Availability of data and materials
All the data generated and the details methods in this paper were provided in the information, protocol exchange (2019) DOI: 10.21203/rs.3.pex-742/v1 and EBI repository (accession no: PRJEB34323). Materials and data should be addressed to Yuan-Kun Lee ([email protected]).
Disclosure of Potential Conflicts of Interest
No potential conflicts of interest were disclosed.
Ethics approval and consent to participate
The Universitas Gadjah Mada’s review board approved this study. All individuals before participation obtained informed consent and all experiments were performed by approved guidelines and regulations.
Supplemental Material
Download Zip (112.9 KB)Acknowledgments
Financial supports of National University Singapore Research funding are acknowledged. We would like to thank anyone who involved in the recruitment of subjects and sampling from Faculty of Agriculture Technology, Universitas Gadjah Mada, Yogyakarta, mainly Mariyatun, Linda Windiarti, and Andika Sidar. It is truly appreciated to Suiping Ohn (AYOXXA Biosystems GmbH, Singapore), Dr. Cheng Shang See and Ass Prof. Jianhong Ching (Metabolomics Facility @Duke-NUS, Singapore), and Dr. Manuel Kratzke and Dr. Markus Langsdorf (Biocrates® Life Sciences AG, Austria).
Supplementary material
Supplemental data for this article can be accessed on the publisher’s website.
Additional information
Funding
References
- Turroni F, Milani C, Duranti S, Lugli GA, Bernasconi S, Margolles A, Di Pierro F, van Sinderen D, Ventura M. The infant gut microbiome as a microbial organ influencing host well-being. Italian J Pediatrics. 2020;46:16.
- Olszak T, An D, Zeissig S, Vera MP, Richter J, Franke A, Glickman JN, Siebert R, Baron RM, Kasper DL, et al. Microbial exposure during early life has persistent effects on natural killer T cell function. Science. 2012;336(6080):489–19. doi:10.1126/science.1219328.
- Gensollen T, Iyer SS, Kasper DL, Blumberg RS. How colonisation by microbiota in early life shapes the immune system. Science. 2016;352(6825):539–544. doi:10.1126/science.aad9378.
- Scheepers L, Penders J, Mbakwa CA, Thijs C, Mommers M, Arts I. The intestinal microbiota composition and weight development in children: the KOALA birth cohort study. Int J Obesity. 2015;39:16–25. doi:10.1038/ijo.2014.178.
- De Filippo C, Cavalieri D, Di Paola M, Ramazzotti M, Poullet JB, Massart S, Collini S, Pieraccini G, Lionetti P. Impact of diet in shaping gut microbiota revealed by a comparative study in children from Europe and rural Africa. Proc Natl Acad Sci USA. 2010;107(33):14691–14696. doi:10.1073/pnas.1005963107.
- Khine WWT, Zhang YW, Goie JY, Wong MS, Liong MT, Lee YY, Cao H, Lee Y-K. Gut microbiome of pre-adolescent children of two ethnicities residing in three distant cities. Sci Rep. 2019;9(1):78931. doi:10.1038/s41598-019-44369-y.
- Kisuse J, La-Ongkham O, Nakphaichit M, Therdtatha P, Momoda R, Tanaka M, Fukuda S, Popluechai S, Kespechara K, Sonomoto K, et al. Urban diets linked to gut microbiome and metabolome alterations in children: a comparative cross-sectional study in Thailand. Front Microbiol. 2018;9:1345. doi:10.3389/fmicb.2018.01345.
- Nakayama J, Yamamoto A, Palermo-Conde LA, Higashi K, Sonomoto K, Tan J, Lee Y-K. Impact of Westernized diet on gut microbiota in children on Leyte islands. Front Microbiol. 2017;8:197. doi:10.3389/fmicb.2017.00197.
- Yatsunenko T, Rey FE, Manary MJ, Trehan I, Dominguez-Bello MG, Contreras M, Magris M, Hidalgo G, Baldassano RN, Anokhin AP, et al. Human gut microbiome viewed across age and geography. Nature. 2012;486(7402):222–227. doi:10.1038/nature11053.
- Nakayama J, Yamamoto A, Palermo-Conde LA, Higashi K, Sonomoto K, Tan J, Lee Y-K. Diversity in gut bacterial community of school-age children in Asia. Sci Rep. 2015;5:8397. doi:10.1038/srep08397.
- Wu GD, Chen J, Hoffmann C, Bittinger K, Chen -Y-Y, Keilbaugh SA, Bewtra M, Knights D, Walters WA, Knight R, et al. Linking long-term dietary patterns with gut microbial enterotypes. Science. 2011;334:6052. doi:10.1126/science.1208344.
- Zhang JC, Guo Z, Lim AA, Zheng Y, Koh EY, Ho D, Qiao J, Huo D, Hou Q, Huang W, et al. Mongolians core gut microbiota and its correlation with seasonal dietary changes. Sci Rep. 2014;4:5001. doi:10.1038/srep05001.
- Pelzer E, Gomez-Arango LF, Barrett HL, Nitert MD. Review: maternal health and the placental microbiome. Placenta. 2017;54:30–37. doi:10.1016/j.placenta.2016.12.003.
- Rautava S, Luoto R, Salminen S, Isolauri E. Perinatal microbial contact and the origins of human disease. Nat Rev Gastroenterol Hepatol. 2012;9:565–576. doi:10.1038/nrgastro.2012.144.
- Penders J, Thijs C, Vink C, Stelma CV, Snijders B, Kummeling I, van den Brandt PA, Stobberingh EE. Factors influencing the composition of the intestinal microbiota in early infancy. Paediatrics. 2006;118(2):511–521. doi:10.1542/peds.2005-2824.
- Dominguez-Bello MG, Costello EK, Contreras M, Magris M, Hidalgo G, Fierer N, Knight R. Delivery mode shapes the acquisition and structure of the initial microbiota across multiple body habitats in newborns. Proc Natl Acad Sci USA. 2010;107(26):11971–11975. doi:10.1073/pnas.1002601107.
- Asnicar F, Manara S, Zolfo M, Truong DT, Scholz M, Armanini F, Ferretti P, Gorfer V, Pedrotti A, Tett A, et al. Studying vertical microbiome transmission from mothers to infants by strain-level metagenomics profiling. mSystem. 2017;2(1):e00164–16. doi:10.1128/mSystems.00164-16.
- Funkhouser LJ, Bordenstein SR. Mom knows best: the universality of maternal microbial transmission. PLoS Biol. 2013;11(8):e1001631. doi:10.1371/journal.pbio.1001631.
- Mueller NT, Bakacs E, Combellick J, Grigoryan Z, Dominguez-Bello MG. The infant microbiome development: mom matters. Trends Mol Med. 2015;21(2):109–117. doi:10.1016/j.molmed.2014.12.002.
- Roger LC, Costabile A, Holland DT, Hoyles L, McCartney AL. Examination of fecal Bifidobacterium populations in breast- and formula-fed infants during the first 18 months of life. Microbiology Society. 2010;156(11):3329–3341. doi:10.1099/mic.0.043224-0.
- Koenig JE, Spor A, Scalfone N, Fricker AD, Stombaugh J, Knight R, Angenent LT, Ley RE. Succession of microbial consortia in the developing infant gut microbiome. Proc Natl Acad Sci USA. 2011;108(Suppl.1):4578–4585. doi:10.1073/pnas.1000081107.
- Ferretti P, Pasolli E, Tett A, Asnicar F, Gorfer V, Fedi S, Armanini F, Truong DT, Manara S, Zolfo M, et al. Mother-to-infant microbial transmission from different body sites shapes the developing infant gut microbiome. Cell Host Microbe. 2018;24:133–145. doi:10.1016/j.chom.2018.06.005.
- Yassour M, Jason E, Hogstrom LJ, Arthur TD, Tripathi S, Siljander H, Selvenius J, Oikarinen S, Hyöty H, Virtanen SM, et al. Strain-level analysis of mother-to-child bacterial transmission during the first few months of life. Cell Host Microbe. 2018;24:146–154. doi:10.1016/j.chom.2018.06.007.
- Bäckhed F, Roswall J, Peng Y, Feng Q, Jia H, Kovatcheva-Datchary P, Li Y, Xia Y, Xie H, Zhong H, et al. Dynamics and stabilization of the human gut microbiome during the first year of life. Cell Host Microbe. 2015;17:690–730. doi:10.1016/j.chom.2015.04.004.
- Makino H. Bifidobacterial strains in the intestines of newborns originate from their mothers. Biosci Microbiota Food Health. 2018;37:79–85. doi:10.12938/bmfh.18-011.
- Vaishampayan PA, Kuehl JV, Froula JL, Morgan JL, Ochman H, Francino MP. Comparative metagenomics and population dynamics of the gut microbiota in mother an infant. Genome Biol Evol. 2010;2:53–66. doi:10.1093/gbe/evp057.
- Milani C, Turroni F, Duranti S, Lugli GA, Mancabelli L, Ferrario C, van Sinderen D, Ventura M. Genomics of the genus Bifidobacterium reveals species-specific adaptation to the glycan-rich gut environment. Appl Environ Microbiol. 2015;82(4):980–991. doi:10.1128/AEM.03500-15.
- Duranti S, Lugli GA, Mancabelli L, Armanini F, Turroni F, James K, Ferretti P, Gorfer V, Ferrario C, Milani C, et al. Maternal inheritance of bifidobacterial communities and bifidophages in infants through vertical transmission. Microbiome. 2017;5:66. doi:10.1186/s40168-017-0282-6.
- Milani C, Duranti S, Bottacini F, Casey E, Turroni F, Mahony J, Belzer C, Delgado Palacio S, Arboleya Montes S, Mancabelli L, et al. The first microbial colonizers of the human gut: composition, activities and health implications of the infant gut microbiota. Microbiol Mol Biol Rev. 2017;81(4):e00036–17.
- Mulligan CM, Friedman JE. Maternal modifiers of the infant gut microbiota: metabolic consequences. J Endocrinol. 2017;235(1):R1–R12. doi:10.1530/JOE-17-0303.
- Fujimura KE, Sitarik AR, Havstad S, Lin DL, Levan S, Fadrosh D, Panzer AR, LaMere B, Rackaityte E, Lukacs NW, et al. Neonatal gut microbiota associates with childhood multisensitised atopy and T cell differentiation. Nat Med. 2016;22(10):1187–1191. doi:10.1038/nm.4176.
- Ismail IH, Boyle RJ, Licciardi PV, Oppedisano F, Lahtinen S, Robins-Browne RM, Tang MLK. Early gut colonization by Bifidobacterium breve and B. catenulatum differentially modulates eczema risk in children at high risk of developing allergic disease. Paediatric Allergy Immunol. 2016;27(8):838–846. doi:10.1111/pai.12646.
- Wampach L, Heintz-Buschart A, Fritz JV, Ramiro-Garcia J, Habier J, Herold M, Narayanasamy S, Kaysen A, Hogan AH, Bindl L, et al. Birth mode is associated with earliest strain-conferred gut microbiome functions and immunostimulatory potential. Nat Commun. 2018;9:5091. doi:10.1038/s41467-018-07631-x.
- Fouhy F, Watkins C, Hill CJ, ÓShea C-A, Nagle B, Dempsey EM, ÓToole PW, Ross RP, Ryan CA, Stanton C. Perinatal factors affect the gut microbiota up to four years after birth. Nat Commun. 2019;10:1517. doi:10.1038/s41467-019-09252-4.
- Shao Y, Forster SC, Tsaliki E, Vervier K, Strang A, Simpson N, Kumar N, Stares MD, Rodger A, Brocklehurst P, et al. Stunted microbiota and opportunistic pathogen colonisation in caesarean-section birth. Nature. 2019;574:117–121. doi:10.1038/s41586-019-1560-1.
- Nogacka A, Salazar N, Suárez M, Milani C, Arboleya S, Solís G, Fernández N, Alaez L, Hernández-Barranco AM, de Los Reyes-gavilán CG, et al. Impact of intrapartum antimicrobial prophylaxis upon the intestinal microbiota and the prevalence of antibiotic resistance genes in vaginally delivered full-term neonates. Microbiome. 2017;5(1):93. doi:10.1186/s40168-017-0313-3.
- Neuman H, Forsythe P, Uzan A, Avni O, Koren O. Antibiotics in early life: dysbiosis and the damage done. FEMS Microbiol Rev. 2018;42:489–499. doi:10.1093/femsre/fuy018.
- Robertson RC, Manges AR, Finlay BB, Prendergast AJ. The human microbiome and child growth- first 1000 days and beyond. Trends Microbiol. 2019;27(2):131–147. doi:10.1016/j.tim.2018.09.008.
- Gibson MK, Wang B, Ahmadi S, Burnham C-A, Tarr D, Warner PI, Dantas BB. G. Developmental dynamics of the preterm infant gut microbiota and antibiotic resistome. Nature Microbiology. 2016;1:16024. doi:10.1038/nmicrobiol.2016.24.
- Madan JC, Hoen AG, Lundgren SN, Farzan SF, Cottingham KL, Morrison HG, Sogin ML, Li H, Moore JH, Karagas MR. Association of caesarean delivery and formula supplementation with the intestinal microbiome of 6-week-old infants. JAMA Paediatrics. 2016;170(3):212–219. doi:10.1001/jamapediatrics.2015.3732.
- Moosavi S, Sepehri S, Robertson B, Bode L, Goruk S, Field CJ, Lix LM, de Souza RJ, Becker AB, Mandhane PJ, et al. Composition and variation of the human milk microbiota are influenced by maternal and early-life factors. Cell Host Microbe. 2019;25:324–335. doi:10.1016/j.chom.2019.01.011.
- Lax S, Smith DP, Hampton-Marcell J, Owens SM, Handley KM, Scott NM, Gibbons SM, Larsen P, Shogan BD, Weiss S, et al. Longitudinal analysis of microbial interaction between humans and the indoor environment. Science. 2014;345(6200):1048–1052. doi:10.1126/science.1254529.
- Dzidic M, Boix-Amorós A, Selma-Royo M, Mira A, Collado MC. Gut microbiota and mucosal immunity in the neonate. Med Sci (Basel). 2018;6:E56.
- Aakko J, Kumar H, Rautava S, Wise A, Autran C, Bode L, Isolauri E, Salminen S. Human milk oligosaccharide categories define the microbiota composition in human colostrum. Benef Microbes. 2017;8(4):563–567. doi:10.3920/BM2016.0185.
- Marcobal A, Barboza M, Froehlich JW, Block DE, German JB, Lebrilla CB, Mills DA. Consumption of human milk oligosaccharides by gut-related microbes. J Agric Food Chem. 2010;58(9):5334–5340. doi:10.1021/jf9044205.
- Duranti S, Lugli GA, Milani C, James K, Mancabelli L, Turroni F, Alessandri G, Mangifesta M, Mancino W, Ossiprandi MC, et al. Bifidobacterium bifidum and the infant gut microbiota: an intriguing case of microbe-host co-evolution. Environ Microbiol. 2019;21(10):3683–3695. doi:10.1111/1462-2920.14705.
- Andreas NJ, Kampmann B, Mehring L-DK. Human breast milk: a review on its composition and bioactivity. Early Hum Dev. 2015;91(11):629–635. doi:10.1016/j.earlhumdev.2015.08.013.
- Hayashi H, Shibata K, Sakamoto M, Tomita S, Benno Y. Prevotella copri sp. Nov. and Prevotella stercorea sp. Nov., isolated from human feces. Int J Syst Evol Microbiol. 2007;57:941–946. doi:10.1099/ijs.0.64778-0.
- Wahlstrom A, Sayin SI, Marschall H-U, Backhed F. Intestinal crosstalk between bile acids and microbiota and its impact on host metabolism. Cell Metab. 2016;24(1):41–50. doi:10.1016/j.cmet.2016.05.005.
- Masaru. T, Sanefuji M, Morokuma S, Yoden M, Momoda R, Sonomoto K, Ogawa M, Kato K, Nakayama J. The association between gut microbiota development and maturation of intestinal bile acid metabolism in the first three years of healthy Japanese infants. Gut Microbes. 2019. doi:10.1080/19490976.2019.1650997.
- Round JL, Lee SM, Li J, Tran G, Jabri B, Chatila TA, Mazmanian SK. The Toll-like receptor 2 pathway establishes colonisation by a commensal of the human microbiota. Science. 2011;332:974–977. doi:10.1126/science.1206095.
- Martin VNR, Schwab C, Krych L, Voney E, Geirnaert A, Braegger C, Lacroix C. Colonisation of Cutibacterium avidum during infant gut microbiota establishment. FEMS Microbiol Ecol. 2019;95:fiy215.
- Moeller AH, Suzuki TA, Phifer-Rixey M, Nachman MW. Transmission modes of the mammalian gut microbiota. Science. 2018;362:453–457. doi:10.1126/science.aat7164.
- Kim Y-G, Sakamoto K, Seo SU, Pickard JM, Gillilland MG 3rd, Pudlo NA, Hoostal M, Li X, Wang TD, Feehley T, et al. Neonatal acquisition of Clostridia species protects against colonization by bacterial pathogens. Science. 2017;356:315–319. doi:10.1126/science.aag2029.
- Oyedemi BOM, Kotsia EM, Stapleton PD, Gibbons S. Capsaicin and gingerol analogues inhibit the growth of efflux-multidrug resistant bacteria and R-plasmids conjugal transfer. J Ethnopharmacol. 2019;245:111871. doi:10.1016/j.jep.2019.111871.
- Kariu T, Nakao R, Ikeda T, Nakashima K, Potempa J, Imamura T. Inhibition of gingipains and Porphyromonas gingivalis growth and biofilm formation by prenyl flavonoids. J Periodontal Res. 2017;52(1):89–96. doi:10.1111/jre.12372.
- Cushnie TP, Cushnie B, Lamb AJ. Alkaloids: an overview of their antibacterial, antibiotic-enhancing and antivirulence activities. Int J Antimicrob Agents. 2014;44:377–386. doi:10.1016/j.ijantimicag.2014.06.001.
- Reed MO, Ai Y, Leutcher JL, Jane JL. Effects of cooking methods and starch structures on starch hydrolysis rates of rice. J Food Sci. 2013;78:H1076–1081. doi:10.1111/1750-3841.12165.
- Are A, Aronsson L, Wang S, Greicius G, Lee Y-K, Gustafsson JA, Pettersson S, Arulampalam V. Enterococcus faecalis from newborn babies regulate endogenous PPARgamma activity and IL-10 levels in colonic epithelial cells. Proc Natl Acad Sci USA. 2008;105:1943–1948. doi:10.1073/pnas.0711734105.
- Wang SG, Hibberd ML, Pettersson S, Lee Y-K. Enterococcus faecalis from healthy infants modulates inflammation through MAPK signaling pathways. PLoS One. 2014;9(5):e97523. doi:10.1371/journal.pone.0097523.
- Caporaso JG, Kuczynski J, Stombaugh J, Bittinger K, Bushman FD, Costello EK, Fierer N, Peña AG, Goodrich JK, Gordon JI, et al. QIIME allows analysis of high-throughput community sequencing data. Nat Methods. 2010;7:335–336. doi:10.1038/nmeth.f.303.
- Edgar RC. Search and clustering orders of magnitude faster than BLAST. Bioinformatics. 2010;26:2460–2461. doi:10.1093/bioinformatics/btq461.
- Martinez Arbizu P. pairwiseAdonis: pairwise multilevel comparison using adonis. R package version 0.3. 2019. https://github.com/pmartinezarbizu/pairwiseAdonis.
- Lahti L, Shetty S. Tools for microbiome analysis in R package 1.6.. 2017. http://microbiome.github.com/microbiome.