
ABSTRACT
Although the oral administration of Bifidobacterium longum (B. longum) relieves the signs of irritable bowel syndrome (IBS) in clinical settings, the mechanisms underlying its effects are unclear. In this study, we evaluated the precise effects of B. longum on IBS via regulation of Paneth cell function. We confirmed the beneficial effects of B. longum on defecation habits and visceral hypersensitivity in WAS rats. Further analysis revealed that B. longum enhanced mucosal repair, promoted lysozyme production, and ameliorated dysbiosis of the microbiota in WAS rats. These processes are closely correlated with Paneth cell functions. In vitro, we incubated primary cultured enteroids with B. longum and found that B. longum promoted the proliferation of these organoids; this may be attributed to the upregulation of the stem niche factors WNT3A and TGF-β, which are secreted by Paneth cells. Based on our findings, we propose that B. longum relieves IBS by restoring the antimicrobial activity and stem niche maintenance function of Paneth cells.
Introduction
Irritable bowel syndrome (IBS) is a common functional gastrointestinal disorder characterized by abdominal pain and altered bowel habits.Citation1 It affects the quality of life of patients and represents a substantial economic burden.Citation2 However, the etiology of IBS is still largely undetermined and effective treatments are unavailable. Consequently, there is a pressing need to elucidate the mechanisms underlying IBS and to establish effective treatments.
In this regard, Paneth cells have recently attracted considerable attention owing to their close association with intestinal innate immunity, microbiota dysbiosis, visceral hypersensitivity, and stress.Citation3 Paneth cells are morphologically distinct and functionally specialized intestinal epithelial cells (IECs) located at the base of the intestinal crypts.Citation4 These cells play important roles in the maintenance of small intestine homeostasis via the secretion of growth factors, such as WNTs, EGF, and Notch signals, which stimulate neighboring G-protein-coupled receptors rich in leucine (Lgr)5+ stem cells to maintain IEC self-renewal.Citation5 Paneth cells also produce substantial quantities of antimicrobial proteins or peptides (AMPs), including lysozyme and α-defensin, which contribute to the composition and maintenance of the intestinal microbiota.Citation6 Conversely, as a principal epithelial cell type in the intestinal mucosa, Paneth cells are directly exposed to the gut microbiota, and symbiotic bacteria-directed selective cargo sorting in Paneth cells has been reported in mice.Citation7 Furthermore, changes in the intestinal populations of Lactobacillus species can also lead to a reduction in the expression of antimicrobial proteins in Paneth cells.Citation8 These findings indicate that there is a close relationship between Paneth cell and the intestinal microbiota.
Bifidobacterium longum (B.longum) is one of the major genera of probiotic bacteria able to colonize the gastrointestinal tract.Citation9 In patients with IBS, intestinal populations of B. longum are typically highly reduced in size,Citation10,Citation11 and accumulating evidence indicates that the administration of B. longum is beneficial for the treatment of IBS.Citation12 For example, probiotic B. longum NCC3001BL reduces depression scores and enhances the quality of life of patients with IBS based on a placebo-controlled trial.Citation13 A mixture of B. infantis M-63, B. breve M-16 V, and B. longum BB536 alleviates abdominal pain in children with IBS.Citation14 However, the mechanisms underlying the beneficial effects of B. longum in IBS have not been clearly elucidated.
In this study, we characterized the efficacy of B. longum for the treatment of IBS. In particular, we evaluated the effects of B. longum on the antimicrobial activity and stem niche maintenance functions of Paneth cells, providing insight into the crosstalk between B. longum and these cells. These findings contribute to our understanding of the mechanisms by which B. longum relieves the symptoms of IBS and highlight the potential value of Paneth cells as therapeutic targets.
Results
B. longum improved defecation habits and alleviated visceral hypersensitivity in rats subjected to water avoidance stress (WAS)
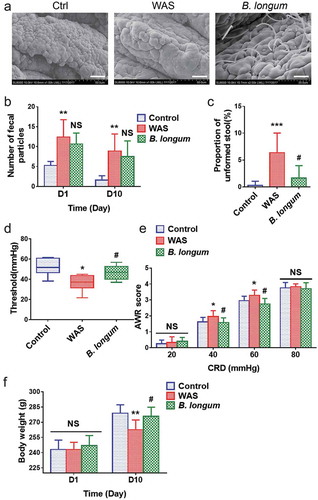
We used the WAS rat model, which is widely used for studies of IBS,Citation15,Citation16 to evaluate the effects of B. longum. After the oral administration of B. longum, scanning electron microscopy revealed a large number of bacteria engrafted in the mucosa of the terminal ileum (). To evaluate the effects of B. longum on IBS, we first assessed the defecation habits of WAS rats. Similar to humans with IBS, WAS rats showed a higher fecal pellet output (FPO) than that of control rats on day 1 (12.4 ± 4.4 vs 5.3 ± 1.0, p = .0004, n = 8 rats/group) and day 10 (8.9 ± 4.3 vs 1.6 ± 1.1, p = .006, n = 8 rats/group) post-administration. We did not detect a difference in FPO between rats administered B. longum and WAS rats on day 1 (10.6 ± 2.8 vs 12.4 ± 4.4, p = .496, n = 8 rats/group) (F = 11.86) or day 10 (7.5 ± 3.9 vs 8.9 ± 4.3, p = .704, n = 8 rats/group) (F = 10.18) (). Furthermore, we found that the FPO of WAS rats was associated with a higher proportion (%) of unformed stools during the 10-day WAS process (6.50 ± 3.68 vs 0.26 ± 0.80, p = .0006, n = 8 rats/group). However, the administration of B. longum resulted in a significant reduction in the proportion (%) of unformed stools in WAS rats (1.65 ± 2.30 vs 6.50 ± 3.68, p = .0459, n = 8 rats/group) (). Subsequently, we examined visceral hypersensitivity, a representative sign of IBS. We found that the pain threshold of WAS rats was significantly lower than that of control rats (36.8 ± 7.8 mmHg vs 52.1 ± 8.4 mmHg, p = .002, n = 8 rats/group). B. longum alleviated visceral hypersensitivity by enhancing the pain threshold of rats (47.3 ± 7.2 mmHg vs 36.8 ± 7.8 mmHg, p = .04, n = 8 rats/group) (F = 7.927) (). Compared with control rats, the abdominal withdrawal reflex (AWR) score for WAS rats also increased at pressures of 40 mmHg (2.17 ± 0.44 vs 1.50 ± 0.31, p = .005) and 60 mmHg (3.29 ± 0.33 vs 2.83 ± 0.18, p = .03), whereas B. longum treatment resulted in significantly lower AWR scores than those for WAS rats at both 40 mmHg (1.63 ± 0.21 vs 2.17 ± 0.44, p = .023) and 60 mmHg (2.75 ± 0.35 vs 3.29 ± 0.33, p = .016) (). Finally, we observed a lower body weight in WAS rats than in control rats (263 ± 10 g vs 279 ± 8 g, p = .0046) on day 10, and a higher body weight in the B. longum group than in the WAS group (276 ± 9 g vs 263 ± 10 g, p = .02) (F = 7.35) (). Collectively, these results indicated that the administration of B. longum can alleviate IBS-related symptoms in WAS rats.
Figure 1. Bifidobacterium longum (B.longum) colonized the ileum terminal epithelium and alleviated visceral sensitivity in water avoidance stress (WAS) rats. The WAS model was produced by placing rats on a block (10 × 8 × 8 cm) in the middle of a plastic tank at 8:00–9:00 o’clock every morning for 10 days. The B. longum group was administered 1 × 10⁹ CFU B. longum for 10 days, whereas rats in the control group were given normal saline. (a) Scanning electron microscopy indicated that B. longum could colonize the mucosa of the terminal ileum after oral administration. Scale bar = 200 μm. (b, c) Fecal pellet output (FPO) and the proportions of unformed stool were calculated among the three groups. (d, e) The threshold intensity of colorectal distention (CRD) and abdominal withdrawal reflex (AWR) score were evaluated among the three groups (n = 8). The threshold value in the WAS group was significantly decreased, and B. longum significantly increased the threshold. For the AWR, the WAS group showed an increased score at 40 and 60 mmHg pressure, and B. longum administration effectively decreased the AWR under both pressures. However, there was no significant difference in scores among the three groups at 20 and 80 mmHg pressure. (f) Body weight was recorded among the three groups on days 1 and 10. On day 1, the body weight among the three groups did not differ, whereas on day10, the weight of WAS group rats was much lower than that of control group rats; B. longum administration improved the body weight in the B. longum group. The data are shown as the mean ± SD, *, p < .05, **, p < .01, **, p < .001 WAS vs Ctrl and #, p < .05 B. longum vs WAS, n = 8.
B. longum ameliorated dysbiosis in WAS rats
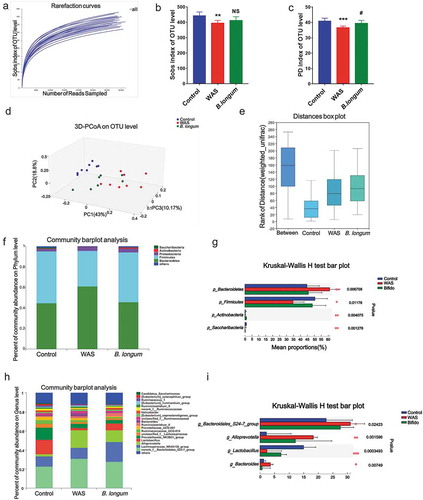
Microbiota dysbiosis is a characteristic feature of IBS. To examine the effect of B. longum on the microbiota, we evaluated fecal samples from rats by 16 S rRNA sequencing to determine the composition of the gut bacterial community. We obtained a total of 836671 clean reads and identified 797 operational taxonomic units (OTUs) from 23 samples (we failed to obtain data from one sample) collected from the three groups. The rarefaction curve for OTU levels indicated that the sample size was sufficient to capture the overall structure of the microbiota (). Although the Shannon diversity and Shannon evenness indices revealed no significant differences with respect to the α-diversity of bacterial communities among the three groups (Table S1), the Sobs and PD indices indicated a reduction in community richness and phylogenetic diversity in the WAS group (Table S1 and ,). Moreover, we detected significant differences (Statistic: 0.7615, p < .001) in β-diversity based on the unweighted (ANOSIM r = 0.7347, p = .001) (data not shown) and the weighted (ANOSIM r = 0.5992, p = .001) UniFrac distances among the three groups (,). A principal component analysis (-I) indicated differences in the composition of the gut microbiota between WAS rats and control rats. At the phylum level, the Bacteroides/Firmicutes ratio was higher in WAS rats than in control rats, and the administration of B. longum alleviated the imbalance (p_Bacteroidetes, Ctrl: 44.67 ± 7.309, WAS: 61.05 ± 9.773, and B. longum: 45.69 ± 8.836, p = .006647; p_Firmicutes, Ctrl: 50.43 ± 7.968, WAS: 34.68 ± 9.677, and B. longum: 48.59 ± 8.91, p = .01036; p_Actinobacteria, Ctrl:0.4338 ± 0.2614, WAS: 0.1974 ± 0.1604, and B. longum: 1.096 ± 0.5932, p = .005993; p_Cyanobacteria, Ctrl:0.2985 ± 0.3258, WAS: 0.004112 ± 0.004217, and B. longum: 0.03196 ± 0.03622, p = .03698) (,). In particular, predominant pathogens, including g_Bacteroidales_S24-7-group (Ctrl: 22.71 ± 4.886, WAS: 31.02 ± 4.588, and B. longum: 27.58 ± 8.989, p = .02423), g_Alloprevotella (Ctrl: 2.178 ± 1.431, WAS: 18.31 ± 12.51, and B. longum: 12.13 ± 8.455, p = .001596), and g_Bacteroides (Ctrl: 1.291 ± 0.9002, WAS: 3.572 ± 2.802, and B. longum: 0.7186 ± 0.6654, p = 00749) decreased in response to B. longum, whereas the numbers of probiotic g_ Lactobacillus (Ctrl: 14.96 ± 5.065, WAS: 2.368 ± 1.896, and B. longum: 7.191 ± 4.195, p = .0003493), which form symbioses with B. longum, were higher in the B. longum group than in WAS rats (,). These findings collectively indicate that the administration of B. longum ameliorated microbiota dysbiosis, which is characterized by a reduction in bacterial diversity and reversal of imbalances in various components of the bacterial community caused by WAS.
Figure 2. Alterations in the composition and diversity of the intestinal microbiota in water avoidance stress (WAS) rats following B. longum administration. (a) The rarefaction curve at the operational taxonomic unit (OTU) level showed a plateau and saturation phase, indicating that the sample size was sufficient to capture the overall microbiota structure. (b, c) The Sobs index (b) and phylogenetic diversity (PD) index (c) of the three groups at the OTU level. (d, e) β-Diversity was calculated by principal co-ordinate analysis (PCoA) (d) and analysis of similarities (ANOSIM) (e) at the OTU level based on weighted unifrac analysis, indicating the different fecal microbiota structure among the three groups (weighted unifrac, ANOSIM r = 0.5992, p = .001). (f, g) Relative abundance of the gut microbiota at the phylum level (f) and the top 4 of them with significant differences (g) among the three groups. (h, i) Relative abundance of microbiota at the genus level (h) and the top 4 microbiota of them with significant differences among the three groups (i). Data are shown as the mean ± SD, *, p < .05, **, p < .01, **, p < .001 WAS vs Ctrl and #, p < .05 B. longum vs WAS, n = 8.
B. longum enhanced lysozyme production in WAS rats
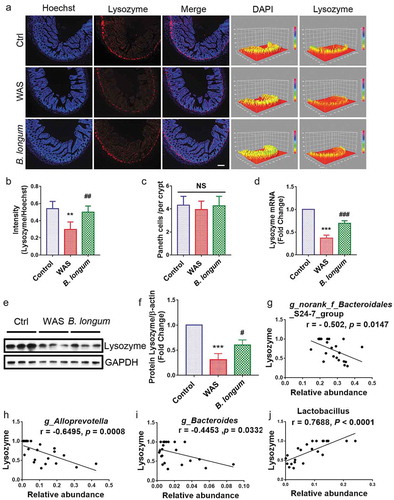
Multiple factors can modulate the composition of the gut microbiota, including the activation of host Paneth cells, which exert antimicrobial activity by synthesizing and secreting AMPs, including lysozyme. Based on immunofluorescence staining, lysozyme expression was lower in WAS rats (0.2996 ± 0.08587) than in control rats (0.5398 ± 0.08573) (p = .0014), and the administration of B. longum resulted in higher lysozyme production (0.501 ± 0.06993) than that in WAS rats (p = .0052) (F = 12.71) (,), although there was no significant change in the number of Paneth cells (Ctrl: 4.318 ± 0.7799; WAS: 3.955 ± 0.7222, p = .3191; B. longum: 4.273 ± 0.827, p = .4405) that produce lysozyme (). The mRNA and protein expression levels of lysozyme, as detected by QPCR and western blotting, respectively, were consistent with the results of the immunofluorescence analysis (setting levels in the Ctrl to 1.0, WAS: 0.3722 ± 0.06464, p < .0001, B. longum: 0.6958 ± 0.5642, p = .0005, F = 120.5 for lysozyme mRNA, WAS: 0.478 ± 0.04215, p < .0001, B. longum: 0.7083 ± 0.02819, p = .0002, F = 239.6 for lysozyme protein) (–f). Furthermore, a correlation analysis showed that the levels of lysozyme mRNA were negatively related to changes in the abundances of various pathogens, such as Bacteroidales_S24-7-group, Alloprevotella and Bacteroides rather than probiotic g_ Lactobacillus; the abundances of these genera were elevated in WAS rats (–j). These results can thus partially explain the mechanism by which B. longum remodeled the bacterial community in WAS rats.
Figure 3. Bifidobacterium longum (B.longum) enhanced lysozyme expression in Paneth cells. (a) Representative images of ileal sections of rats from health control group (Ctrl), water avoidance stress (WAS) treatment group (WAS), and group subjected to WAS treatment followed by administration of B. longum for 10 days (B. longum). Cell nuclei in the sections were stained using DAPI (blue) and lysozyme was stained with an anti-lysozyme antibody (red). The intensity of the cell nucleus and lysozyme was quantified with Image J software. Scale bar = 100 μm. (b) Expression of lysozyme in the rat ileum was determined by quantifying the relative intensity of lysozyme/DAPI fluorescence from an average of 5 sections per rat of 5 rats from each group using blind examination by independent readers. Data are shown as the mean ± SD, **, p = .0014 of Ctrl vs WAS, ##, p = .0052 of B. longum vs WAS. (c) Analysis of the number of Paneth cells per crypt from an average of 5 well-preserved crypts per slide and of 5 rats from each group. Data are shown as the mean ± SD, p = .3191 of Ctrl vs WAS, #, p = .4405 of B. longum vs WAS. (d) Relative expression of lysozyme mRNA of ileal tissue from Ctrl, WAS, and B. longum rats were quantified by QPCR. Data are shown as the mean ± SD, ***, p < .0001 of Ctrl vs WAS, ###, p = .0005 of B. longum vs WAS, n = 3. (E, F.) Western blot analysis of lysozyme protein expression in ileal tissue of 3 representative individual rats from each group. Data are shown as the mean ± SD, ***, p = .0002 of Ctrl vs WAS, #, p = .0190 of B. longum vs WAS, n = 3.(g–j) Correlation of antibacterial peptide Lysozyme mRNA expression with intestinal microbiome g _ Bacteroidales _ S24-7-group (g), g _ Alloprevotella (h), g _ Bacteroides (i), and g _ Lactobacillus (j). Data are shown as the mean ± SD.
B. longum promoted mucosal repair by restoring IEC proliferation
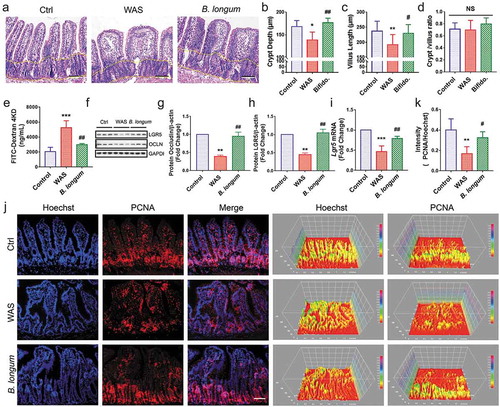
Further, we evaluated the morphological change of the ileum (). Both the crypt depth (138.4 ± 17.52 μm vs 168.1 ± 13.2 μm, p = .0173, n = 8 rats/group) and villus length (192 ± 33.72 μm vs 236.9 ± 33.02 μm, p = .0096, n = 8 rats/group) (F = 5.705) were significantly lower in the WAS group than in the control group, and this pattern was partially reversed in the B. longum group (crypt depth: 176.5 ± 10.15 μm vs 138.4 ± 17.52 μm, p = .0014; villus length: 229.6 ± 29.15 μm vs 192 ± 33.7 μm, p = .0436, n = 8 rats/group) (F = 5.705) (,). However, no significant differences were found in the crypt/villus ratios among the three groups (WAS: 0.698 ± 0.16, B. longum: 0.7983 ± 0.1009, Ctrl: 0.7123 ± 0.1034, p > .1 for all comparisons, n = 8 rats/group) (F = 1.52) (). We also observed that B. longum administration alleviated intestinal permeability to 4000-Da fluorescent dextran-FITC (DX-4000-FITC) (2991 ± 135.6 vs 5264 ± 915.2, p = .0018, n = 4 rats/group), which was markedly increased in the WAS Group (WAS vs Control: 5264 ± 915.2 vs 2041 ± 595.1, p = .0001, n = 4 rats/group) (F = 27.2) (). In addition, the expression of the tight junction molecule occludin in the intestinal mucosa, which downregulated in the WAS group (0.3919 ± 0.06237) compared with the control group (set to 1.0) (p = .0023) was increased following B. longum administration for 10 days (0.9463 ± 0.2054) (p = .0037) (F = 22.14) (,). Similarly, as a marker of intestinal stem cells, the mRNA and protein expression levels of LGR5 were restored in the B. longum group (setting levels in the Ctrl to 1.0, mRNA: WAS, 0.4665 ± 0.1395, p = .0007, B. longum, 0.788 ± 0.05677, p = .0095, F = 28.61; protein: WAS, 0.4475 ± 0.083, p = .0022, B. longum 1.047 ± 0.1746, p = .0014, n = 3 rats/group, F = 26.77) (,,). Moreover, we found that B. longum restored the proliferation of IECs in the intestinal mucosa (0.3232 ± 0.05932 vs 0.1678 ± 0.06748, p = .0271, n = 5 rats/group), which was suppressed in WAS rats, as determined by PCNA staining (0.1678 ± 0.06748 vs 0.4002 ± 0.109, p = .0019, n = 5 rats/group) (F = 10.53) (,). These results indicate that the altered intestinal barrier function in WAS rats may be linked to the impaired proliferation of IECs and that the administration of B. longum may enhance mucosal repair by promoting IEC proliferation.
Figure 4. Bifidobacterium longum (B.longum) restored intestinal epithelial cell proliferation and enhanced mucosal repair in water avoidance stress (WAS) rats. (a) H&E staining of representative ileal sections of the rats from the three groups. The dashed line indicates the position of intestinal crypt. Scale bar = 100 μm. (b–d) Morphometric quantification of the intestinal crypt depth (b), villus height (c), and crypt/villus ratio (d) from five well-preserved crypts per slide of 8 rats from each group. Data are shown as the mean ± SD, (B) *, p = .0173 of Ctrl vs WAS, ##, p = .0014 of B. longum vs WAS (C).**, p = .0096 of Ctrl vs WAS, #, p = .0436 of B. longum vs WAS. (D) p = .9710 of Ctrl vs WAS, p = .2626 of B. longum vs WAS. (e) Intestinal permeability assay to detect intestinal permeability by measuring the concentration of FITC-D4000 in the rat serum from the three groups (n = 4 per group). Data are shown as the mean ± SD, ***, p = .0001 of Ctrl vs WAS, ##, p = .0018 of B. longum vs WAS. (f–h) Western blot analysis of occludin and LGR5 protein expression in the ileal tissue of 3 representative individual rats from each group. Quantification of GAPDH-normalized band intensity by Image-Pro Plus; data are shown as the mean ± SD, (g) **, p = .0023 of Ctrl vs WAS, ##, p = .0037 of B. longum vs WAS, n = 3, (h) **, p = .0022 of Ctrl vs WAS, ##, p = .0014 of B. longum vs WAS, (k) **, p = .0019 of Ctrl vs WAS, ##, p = .0271 of B. longum vs WAS, n = 3. (i) QPCR analysis of Lgr5 mRNA expression dissected from ileal tissues of the three groups. Data are shown as the mean ± SD, ***, p = .0007 of Ctrl vs WAS, ##, p = .0095 of B. longum vs WAS, n = 3. (j) Representative images of intestinal epithelial cells of ileal sections of rats from the three groups with PCNA (red) staining. The intensity of the cell nucleus and PCNA was quantified by Image J software. Scale bar = 100 μm. Results in (J) are shown as the average values of 5 sections per rat of 5 rats from each group. Data are shown as the mean ± SD, *, p = .0019 of Ctrl vs WAS, #, p = .0271 of B. longum vs WAS.
B. longum promoted enteroid proliferation via the regulation of Paneth cell function
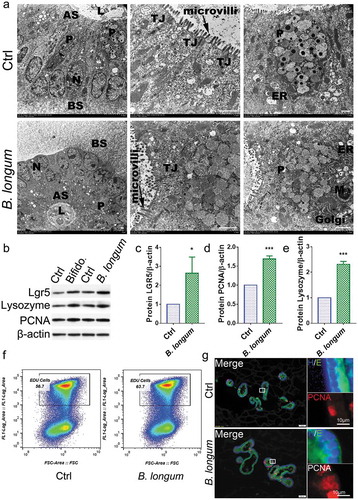
The enteroid model is widely used to investigate IEC-microbe interactions. We found that B. longum does not destroy the structure of organoids when it is added to the culture system (, S3). Consistent with our in vivo findings, we observed that the administration of B. longum had no detrimental effects on the epithelial barrier () and indeed promoted the proliferation of enteroids after incubation for 4 h, as reflected by increases in the protein levels of LGR5 and PCNA (LGR5: 2.639 ± 0.8513 vs 1.0, p = .0290, t = 3.334, PCNA: 1.687 ± 0.08 vs 1.0, p = .0001, t = 14.88) (,d). Moreover, increased cell proliferation in enteroids after incubation with B.longum was also detected by an EdU assay and PCNA staining (,). Lysozyme up-regulation was also detected in the B. longum group (2.312 ± 0.1121 vs 1.0, p < .0001, t = 20.28) (,).
Figure 5. Bifidobacterium longum (B.longum) promoted the proliferative activity of enteroids. (a) Transmission electron photomicrographs showed normal morphology and sizes of cell nucleus, endoplasmic reticulum, Golgi, tight junction, mitochondria, and microvilli of enteroids in B. longum group compared to in the control group. The large granules in the Paneth cells were secretory granules containing lysozyme. N, cell nucleus; ER, endoplasmic reticulum; TJ, tight junction; M, mitochondria; P, Paneth cells; AS, apical surfaces; BS, basolateral surfaces; L, lumen. Scale bar = 10 μm. (b–e) Western blot analysis of proteins expression of LGR5 (c), PCNA (d), and lysozyme (e) of enteroids after incubating with B. longum. Data are shown as the mean ± SD, (C) *, p = .029, (D) ***, p = .0001, (E) ***, p < .0001, n = 3. (f) EdU proliferation analysis of enteroids after incubation with B. longum. Dot plot of EdU-647 staining (Y-axis, 647) vs FSC. The percentage of gated cells (EdU-positive) is highlighted. (g) Representative images of fluorescence staining of E-cadherin (E, green), PCNA (red), and Hoechst (H, blue) staining of enteroids after incubating with B. longum. Scale bar = 50 µm (left) or 10 µm (right).
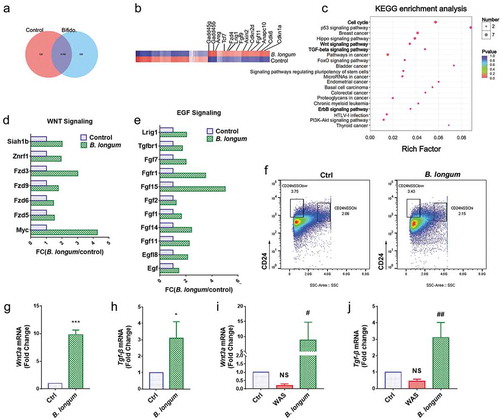
Using RNA sequencing, we identified 359 genes that were differentially expressed between enteroids of the B. longum group and the control group. (). Some genes that were up-regulated by greater than two-fold were related to proliferation (). Furthermore, a KEGG pathway analysis indicated that genes affected by B. longum administration were related to the activation of the cell cycle, WNT signaling, TGF signaling, and ErrB signaling pathways (). We further detected high enrichment for genes encoding components of the WNT and EGF signaling pathways (, ). As the primary source of WNT signals, we sorted Paneth cells by FACS and found similar numbers in the control group and B. longum group (). Furthermore, a QPCR analysis indicated that Wnt3a and Tgf-β, two important proliferative factors produced by Paneth cells, were significantly up-regulated in the B. longum group (Wnt3a: 9.813 ± 0.8346 vs 1.0, p < .0001, t = 18.29, Tgf-β: 3.09 ± 1.013, p = .0233, t = 3.575) (,). Finally, we observed similar expression changes in the intestinal mucosa (Wnt3a: WAS, 0.193 ± 0.1123, p = .5172, B. longum, 8.88 ± 5.902, p = .0190, Ctrl, set to 1.0; Tgf-β: WAS, 0.4502 ± 0.1263, p = .4647, B. longum 3.108 ± 0.9166, p = .0022, Ctrl, set to 1.0, F = 20.69) (,).
Figure 6. Alterations related to Paneth cells functions after incubating with Bifidobacterium longum (B. longum). (a) Venn diagram showing common and uncommon gene expression in enteroids between control and B. longum group by microarray analysis. There were 526 and 359 genes independently expressed in the Ctrl and B. longum groups, respectively, and 11,707 genes expressed in both groups. (b) The heat map of microarray expression experiments illustrates the expression differences in some proliferation-related mRNAs on the microarray between B. longum group and Control group. (c) KEGG pathway analysis indicated activation of the cell cycle, Wnt signaling, TGF-β signaling, and ErrB signaling pathways in the B. longum group. (d, e) Fold-change (FC) in genes encoding components of Egf signaling and Wnt signaling in microarray expression experiments. (f) Fluorescence-activated cell sorting (FACS) analysis of CD24-positive cells showing the proportion of Paneth cells in enteroids of the two groups (Ctrl and B. longum). Two CD24 high populations differed by side-scatter (SSC) pattern, and CD24hiSSClow cells were enteroendocrine cells, whereas CD24hiSSChi cells were Paneth cells according to previous reports. (g, h) QPCR analysis of mRNA expression of Wnt3a (g) and Tgf-β (h) in Paneth cells sorted from (F). Data are shown as the mean ± SD, (G) ***, p < .0001, (H) *, p = .0233, n = 3. (i, j) QPCR analysis of mRNA expression of Wnt3A (G) and TGF-β (H) in ileal tissue of rats from the healthy control group (Ctrl), water avoidance stress (WAS) group, and group subjected to WAS followed by administration of B. longum for 10 days (B. longum). Data are shown as the mean ± SD, (i) p = .5172 of Ctrl vs WAS, #, p = .0190 of B. longum vs WAS. (j) p = .4647 of Ctrl vs WAS, ##, p = .0022 of B. longum vs WAS.
Discussion
The oral administration of B. longum is a convenient, economical, and safe new choice for the treatment of IBS; however, the detailed mechanisms underlying its effects are yet to be determined. In this study, we found that B. longum promotes the recovery of WAS rats by altering Paneth cell-related functions, including the enhancement of lysozyme production and mucosal repair. Our in vitro analyses and RNA sequencing results provided further evidence that Paneth cells are affected by the administration of B. longum, thereby confirming the vital role of this cell type in the efficacy of B. longum for the treatment of IBS.
There is increasing interest in the effects and mechanism of action of B. longum in IBS. A study has shown that the administration of B. longum improves colon epithelium permeability and intestinal occludin expression, thus relieving visceral hypersensitivity in a postinfectious model.Citation17 In another study, either B. longum or Lactobacillus helveticus alone could decrease the visceral pain induced by chronic stress at a low volume of colorectal distention, and the combination of B. longum and L. helveticus was more effective.Citation18 Importantly, it is worth noting inconsistent results have been obtained. A recent meta-analysis of the effect of B. longum on symptomatic abdominal pain in patients with IBS showed that only 50% of enrolled studies demonstrate a statistically significant difference between B. longumbacteria supplementation and placebo groups.Citation19 Further analysis showed that the heterogeneity might be caused by the strain, dosage, and delivery method of B. longumbacteria,Citation19 and these factors should be investigated further.
Generally, pro-biotic bacteria contribute to health by the competitive exclusion of pathogens, strengthening the intestinal epithelial barrier function, and modulation of the host immune system.Citation20 Our results indicated that B. longum alters the structure of the intestinal flora and intestinal permeability. Some researchers have postulated that low-grade inflammation plays an important role in the pathophysiology of IBS,Citation21–Citation25 but support for this hypothesis is unclear owing to inconsistent results of studies with different sample sizes. In this study, we did not detect significant differences in the serum cytokine levels between the WAS and Ctrl groups (Fig S1), with no obvious effect of B. longum on the host immune system. Consistent with reported function of B. longum, we found that the species restored the decrease in Goblet cells by WAS (Fig S2), which was beneficial for the recovery of the intestinal mucosal barrier. In general, our findings support the functions of B. longum as a pro-biotic bacterium in IBS.
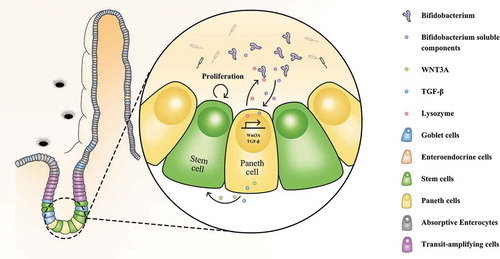
We focused on Paneth cells owing to their recently recognized importance in IBS. In this study, B. longum influenced Paneth cell-related functions, including lysozyme production, providing a novel mechanism underlying the effects of B. longum on IBS (). Paneth cells play important roles in innate immunity in the small intestine and intestinal stem cell proliferation.Citation5,Citation26 A lack of antimicrobial peptides from Paneth cells leads to the failure of intestinal barrier function and bacterial translocation.Citation27 Paneth cells also promote mucosal repair and improve intestinal permeability by restoring IEC proliferation. A loss of Paneth cells leads to visceral hypersensitivity, which is closely related to IBS.Citation3 However, little is known about how the gut microbiota affects the function of Paneth cells. Our results indicated that B. longum-stimulated lysozyme production by Paneth cells influences the composition of the commensal microbiota in WAS rats highlights the bidirectional interaction between gut microbes and Paneth cells. This provides important insight into the regulation of Paneth cell function.
Figure 7. Novel mechanism underlying the beneficial effects of Bifidobacterium longum (B. longum) for treatment of IBS. B. longum promoted the expression of lysozyme, WNT3A, and TGF-β in Paneth cells, and accordingly ameliorated microbiota dysbiosis and promoted intestinal stem cell proliferation.
Organoid technology has recently emerged as a powerful tool for studies of epithelial cells in vitro.Citation28–Citation30 However, enteroids are limited for analyses of interactions between epithelial cells (like Paneth cells) and the intestinal microbiota owing to their closed structures. To obtain sufficient experimental materials for further analyses, we incubated B. longum with enteroids directly rather than by injecting bacteria into the central lumen of enteroids.Citation31 This strategy has been successful in some IEC-microbe interaction studies.Citation32 More importantly, a clinical trial has shown that heat-inactivated Bifidobacterium bifidum MIMBb75 (SYN-HI-001) substantially alleviates IBS, indicating that the effects of specific beneficial bacteria are mediated by mechanisms independent of live cell contact.Citation33As B. longum cannot infiltrate the organoid lumen, we speculate that these bacteria may release certain small soluble molecules, such as fatty acids, vitamins, and amino acids, which can penetrate the mucosal barrier or directly interact with basolateral surfaces. This will be elucidated in our future work, including metabonomic analyses.
In conclusion, we verified the therapeutic effects of B. longum in IBS and propose novel mechanisms by which B. longum restores antimicrobial activity and stem niche maintenance functions of Paneth cells. Although more data are needed to confirm the direct effects of B. longum on Paneth cells, our findings improve our current understanding of the mechanism underlying the efficacy of pro-biotic bacteria and may promote further Paneth cell-oriented research related to IBS.
Materials and methods
Animals
The animal experiments were performed in adherence with the National Institutes of Health Guidelines on the Care and Use of Laboratory Animals and were approved by the Animal Experimentation Ethics Committee of the Second Military Medical University. All animals were purchased from Vital River Laboratory Animal Technology Co., Ltd (Beijing, China).
Chronic WAS model
Chronic exposure of adult rats to WAS was conducted as described previously.Citation15 In brief, adult male Sprague-Dawley rats weighing 225 ~ 260 g were placed on a block (10 × 8 × 8 cm) in the middle of a plastic tank (41 cm length × 38 cm width × 38 cm height) which was filled with water (25°C) to within 1 cm of the top of the block. The animals were maintained on the block during 8 to 9 o’clock every morning for 10 consecutive days. Rats were oral administrated 0.9% normal saline in WAS group or 1 × 10⁹ colony forming units (CFU) B. longum (Shanghai Sine Pharmaceutical Co., Ltd, 6–1/CMCCP001) in 1 ml 0.9% normal saline in B. longum group once a day.The control group was placed in a tank without water for 1 hour daily for 10 days at the same time. Rats were weighed every day before exposure to WA stress or sham WA session. Fecal pellets and proportion of unformed stool (refers to feces that are soft and shapeless) in the tank were counted at the end of each 1 hour exposure.
After ten days of model construction, fresh feces from each rat were collected and colorectal distension was measured. Then rats were anesthetized and the blood and ileum were collected. About 0.5 ~ 1 cm terminal ileum from each sample should be obtained and fixed in fresh 4% PFA or frozed in – 80 °C for further analyses.
Abdominal withdrawal reflex scale
An 4 cm long inflatable thin-walled balloon made of a surgical glove finger was used for the colorectal distension measurement as described previously.Citation34 The balloon was fixed to the end of a tube (1.0 mm in diameter), and the other end of the tube was connected via a Y connector to a syringe (20 mL) and a sphygmomanometer (Shanghai Medical Equipment, Shanghai, China). The flexible balloon was inserted 5 cm via the rat’s anus after anesthesia with isofluorane. Rats were allowed to recover for 30 minutes in small isolated cubicles of lucite (20 cm ×8 cm ×8 cm) before the test. A series of graded colorectal distention (CRD) were conducted at constant pressures of 20, 40, 60 and 80 mmHg (20 seconds duration; 4 minutes interstimulus interval) and visceral sensation was quantified by the behavioral indications.The AWR was scaled as follows: 0, no behavioral response to colorectal distension; 1, brief head movement only; 2, contraction of abdominal muscles; 3, lifting of abdomen; 4, body arching and lifting of pelvis. The threshold intensity of colorectal distention was defined as the stimulus intensity that evoked a visually identifiable contraction of the abdominal wall (i.e., score 2 or above).
Intestinal permeability assay
Intestinal permeability was measured as previous reports.Citation35,Citation36 In brief, rats were fasted overnight in prior to gavage with 0.5 ml 4-kDa fluorescein isothiocyanate (FITC)-dextran (120 mg/ml, Sigma-Aldrich, NSW, Australia) per 100 g in weight. Blood was collected from the portal vein 2 hours later and centrifuged at 1500 × g for 10 minutes at 4 °C. Serum was collected and fluorescence was quantified at an excitation wavelength of 480 nm and emission wavelength of 535 nm. Concentrations were calculated according to the standard curve.
Electron microscopy (EM)
For scanning EM, 3 rats were sacrificed from each group and the ilea were collected within 5 cm from the ileocecal site. The ilea were cut open, flushed with cold normal saline, cut into blocks (10 mm ×10 mm), and fixed in cold 4% glutaraldehyde solution. Samples were then dehydrated in a series of graded ethanol solutions, dried by critical point drying with Leica EMSCOPE CPD750, coated with gold-palladium for 5 minutes at 100 A/min, and observed with a S450 scanning electron microscope (SEM) (Hitachi) at an accelerating voltage of 15 kV.
For transmission EM, enteroids were harvested after incubating with B. longum for 4 hours, fixed in 2.5% glutaraldehyde + 4% PFA for 20 minutes, and then embedded in Histogel (Thermo Scientific, HG-4000021). The embedded blocks were re-fixed in 2.5% glutaraldehyde for 4 hours and post-fixed in 2% osmium tetroxide for 1.5 hours before being dehydrated and embedded in Araldite resin. Sections (1 μm) were pre-stained with toluidine blue to identify the location of enteroids. Ultrathin sections (70 nm) were floated in water, mounted on 200 mesh copper grids (AgarScientific, Stansted, UK) and counter-stained in uranyl acetate and lead citrate. Samples were observed using a transmission electron microscope (Hitachi H – 7650, Japan) at 100 KV.
Fecal microbiota composition analysis
Total bacterial genomic DNA was extracted and amplified using forward (5`- ACTCCTACGGGRSGCAGCAG `) and reverse (5`- GGACTACVVGGGTATCTAATC −3`) primers covering V3-V4 region of the bacterial 16 S rDNA. The amplified 16 S rDNA region was sequenced on an Illumina HiSeq PE250 platform according to the manufacturer’s instructions. The raw reads had been uploaded to the Sequence Read Archive (SRA) database (Accession Number: SRP 251659). OTUs that reached 97% similarity were used for alpha diversity estimations using Mothur (Version 1.30.2). The principal co-ordinate analysis (PCoA) was conducted based on the OTU level using the weighted unifrac test. Kruskal-Wallis H test was used to compare the differential phylum and genus among different groups. Correlations between lysozyme mRNA levels and the relative abundances of distinct genera were calculated using Spearman’s analysis.
Enteroids establishment, maintenance and co-culture with B.longum
Enteroids were cultured using crypt-enriched ileal fractions from 6 ~ 10-week-old C57/BL6 mice. Briefly, the distal 6 cm of the small intestine was collected and flushed gently with ice-cold Dulbecco’s Phosphate buffered saline (DPBS) without Ca2+ and Mg2+ 3 ~ 4 times. Then the ileal fractions were cut open along the longitudinal incision, re-washed with DPBS and cut to 2 mm. Crypts were isolated from the segments by incubating in 2 mM EDTA for 10 minutes, and then in 5 mM EDTA for 50 minutes.After removing villi and debris, crypts were collected in Dulbecco’s Modified Eagle’s Medium: Nutrient Mixture F – 12 with 15 mM HEPES (DMEM – F12), then mixed with Matrigel (Corning Company) in 1:1 ratio. Then 50 µL crypt suspension was planted into the center of each well of the pre-warmed 24-well plate, and 750 μL of Organoid Growth Medium (Stem cell Technologies, #06005) was added per well. Once established, half medium was replaced every other day, and organoids were passaged every 7 ~ 10 days.
The B. longum strain was kindly provided by the Research Center of Shanghai Sine Pharmaceutical Co., Ltd (Shanghai, China) and grown anaerobically in 100 mL of Microbiology MRS broth (Merck KGaA) at 37°C as previously described.Citation37,Citation38 Collected B. longum were re-suspended in DMEM/F-12 to a density of 2 × 10⁸ CFU/mL. One milliliter of this suspension was added to enteroids per well and incubated at 37°C and 5% CO2 for 4 hours before further analysis.
EdU assay
EdU assay kit (Abcam, ab219801) was used to assess the proliferation of enteroids incubating with B longum according to the manufacturer’s instructions. In brief, 10 μM EdU was added to the medium 1 hour after co-culture and incubated for additional 3 hours. The matrigel was dissociated with Cell Recovery Solution (Corning, #354253) for 15 minutes at 4 °C, and afterward enteroids were digested in 0.25% Trypsin + 5% EDTA in PBS for 30 minutes in a 37°C water bath. Then, 10% BSA-PBS was added to stop the digestion and cells were centrifuged at 400 × g for 5 minutes at 4 °C and re-suspended in 3% BSA-PBS. After filtration using a 40 μm aperture strainer, cells were fixed with 4% PFA, permeated and incubated with EdU Reaction mix. Then cells were washed twice and re-suspended in 200 ~ 300 µL PBS for analyzing by Moflo XDP (Beckman Coulter) at Ex/Em = 491/520 nm.
Histological staining and immunofluorescence staining
For histological analysis, ileal tissues of WAS rats were fixed in formalin for 24 hours and then paraffin embedded. Sections of 4 μm were cut. The sections were deparaffinized and hydrated, and then stained with hematoxylin and eosin (H&E) solution. Villus length and crypt depth were measured using image J software. Analyses were done on five well preserved crypts per slide and on 8 rats from each group.
For immunofluorescence analysis, ileal tissues were paraffin embedded, sectioned, dewaxed and antigen retrieval performed, while organoids were O.C.T. compound (SAKURA, USA) embedded, frozened, sectioned and antigen retrieval performed. Then, ileal tissues or organoid sections were blocked in 5% normal goat serum for 1 hour, and incubated with primary antibodies (anti-E-cadherin, 1:100, Cell Signaling, 3195; anti-PCNA, 1:50, Santa Cruz Biotechnology, sc-56; anti-lysozyme, 1:200, DAKO, clone EC32117) overnight at 4 °C, followed by 1 hour of incubation with secondary antibodies (Alexa Fluor 647 goat-anti-mouse IgG H + L, 1:200, Jackson Immuno Research, 715–605-150; Alexa Fluor 647 goat-anti-rabbit IgG H + L, 1:200, Jackson Immuno Research, 111–005-045) at room tempeture. Then, the samples were counterstained with Hoechst 33342 (1:10,000, Sigma-Aldrich) for 10 minutes at room tempeture. Fluorescence images were captured using fluorescence microscopy (DXM, Nikon).
Flow cytometry
For flow cytometry, single cells of enteroids were collected and incubated with 10% donkey serum (Jackson Immuno Research, West Grove, PA, 017–000-121) for block. Then single cells were stained with PE/Cy7-labeled anti-mouse CD24 (Biolegend, 101822) or PE/Cy7-labeled Rat IgG2b, κ Isotype Ctrl (Biolegend, 400618). CD24hiSSChi cells were sorted as Paneth cells on a Moflo XDP (Beckman Coulter) and assessed.
RNA-sequence
Total RNA was extracted from the enteroids and RNA-seq transcriptome library was prepared by TruSeqTM RNA sample preparation Kit (Illumina, San Diego, CA). RNA-seq library was sequenced with the Illumina HiSeq xten/NovaSeq 6000 sequencer (2 × 150 bp read length). The raw paired end reads were trimmed and quality controlled by SeqPrep (https://github.com/jstjohn/SeqPrep) and Sickle (https://github.com/najoshi/sickle) with default parameters. Then clean reads were separately aligned to reference genome with orientation mode using TopHat (http://tophat.cbcb.umd.edu/, version2.0.0) software. To identify differential expression genes (DEGs), the expression level of each transcript was calculated according to the fragments per kilobase of exon per million mapped reads (FRKM) method. GO functional enrichment and KEGG pathway analysis were carried out by Goatools (https://github.com/tanghaibao/Goatools) and KOBAS (http://kobas.cbi.pku.edu.cn/home.do). The data were deposited to the GEO database (accession number: GSE149592).
Quantitative PCR
Total RNA was extracted from ileal tissues or enteroids using Trizol reagent (Invitrogen, Carlsbad, Calif). Reverse-transcribed reaction was conducted using a reverse transcription kit (PrimeScript™RT Master Mix, TakaRa). A SYBR green-based quantitative PCR method was performed using Real Time PCR System (Light Cycler 480II, Roche). The housekeeping gene Gapdh was used as endogenous controls to normalizing genes of interest. The oligonucleotide primers used in this study are showed in Table S2.
Western blot analysis
Total proteins from ileal tissues or enteroids were extracted using tissue extraction reagent (Beyotime Biotechnology, Jiangsu, China) according to the manufacturer’s instructions. The protein concentrations were quantified using a bicinchoninic acid protein assay kit (Thermofisher). Equal amounts of proteins (20 μg) were electrophoresed through a Express Plus PAGE gel (GenScript, M42015 C, M42010 C) and transferred to polyvinylidene fluoride membranes. Membranes were subsequently put into 5% (w/v) nonfat milk for 2 hours at room temperature, and then incubated with a primary antibody (Occludin, 1:500, Clone OC-3F10, Invitrogen, 33–1500; LGR5, 1:500, Boster Biological Technology, BM4244; PCNA, 1:500, Santa Cruz Biotechnology, sc-56; lysozyme, DAKO, 1:500, Glostrup, clone EC32117; GAPDH, 1:5000, CMCTAG, USA, AT0002; β-actin, 1:5000, CMCTAG, AT0001) overnight at 4°C. On the next day, membranes were incubated with second antibody for 1 hour at room temperature. The protein bands were visualized using an ECL kit (Perkin-Elmer Applied Biosystems) under GE system and quantified using Image J software.
ELISA
Blood samples were collected from the heart of all rats after being anesthetized and then clotted for 2 hours at room tempeture before centrifuging for 20 minutes at 1000 × g. Serum samples were removed, aliquotted and stored at −80 °C. The profile of inflammatory factors in serum was measured using Quantibody Rat Cytokine Array 2 (Cat# QAR-CYT-2, RayBiotech, Inc.) which included interleukin 1 beta (IL-1β), IL-6, IL-10, interferon gamma (IFN-γ), intercellular adhesion molecule 1 (ICAM-1), leptin, monocyte chemotactic protein 1 (MCP-1), tissue inhibitor of metalloproteinases 1 (TIMP-1), L-selectin and tumor necrosis factor alpha (TNF-α). The experiment was carried out in accordance with the manufacturer’s instructions. Briefly, pre-coated antibody array membranes were incubated with coating buffer for 30 minutes. After that, the blocking buffer was decanted and replaced with 100 µL standard cytokines or samples at 4 °C with shaking. On the next day, the membranes were incubated with biotinylated antibody for 2 hours and then Cy3 Equivalent Dye-Streptavidin was added to each subarray. Signals were visualized and analyzed using a laser scanner Axon GenePix (Axon Instruments, Foster City). The total normalized fluorescence values of replicate spots were averaged and calculated as fold increase over the control samples.
Statistical analyses
Statistical analysis was performed using GraphPad Prism version 7.0 (GraphPad Software, San Diego, California, USA). Data were analyzed by the unpaired t test between two groups or the one-way ANOVA among three groups followed by Tukey multiple comparisons if the data were in Gaussian distribution and had equal variance. Data were analyzed by Kruskal-Wallis followed by Dunn’s multiple comparisons if the data were not normally distributed. Data were showed as box plots [2.5% to 97.5%] or means ± SD, and p < .05 were considered statistically significant.
Disclosure of interest
No potential conflicts of interest were disclosed.
Supplemental Material
Download Zip (14.4 MB)Acknowledgments
Authors wish to acknowledge funding from the National Natural Science Foundation of China (81370493, 81800479, 81670485 and 81800570), Young Medical Talents Program and Natural Science Research Project of Universities in Jiangsu Province (C-H Zhou, QNRC2016863, 18KJB320021).
Supplementary material
Supplemental data for this artilcle can be accessed here.
Additional information
Funding
References
- Chey WD, Kurlander J, Eswaran S. Irritable bowel syndrome: a clinical review. JAMA. 2015;313:949–17. doi:10.1001/jama.2015.0954.
- Canavan C, West J, Card T. Review article: the economic impact of the irritable bowel syndrome. Aliment Pharmacol Ther. 2014;40:1023–1034. doi:10.1111/apt.12938.
- Riba A, Olier M, Lacroix-Lamande S, Lencina C, Bacquie V, Harkat C, Gillet M, Baron M, Sommer C, Mallet V, et al. Paneth cell defects induce microbiota dysbiosis in mice and promote visceral hypersensitivity. Gastroenterology. 2017;153:1594–1606 e2. doi:10.1053/j.gastro.2017.08.044.
- Crosnier C, Stamataki D, Lewis J. Organizing cell renewal in the intestine: stem cells, signals and combinatorial control. Nat Rev Genet. 2006;7:349–359. doi:10.1038/nrg1840.
- Sato T, van Es JH, Snippert HJ, Stange DE, Vries RG, van den Born M, Barker N, Shroyer NF, van de Wetering M, Clevers H. Paneth cells constitute the niche for Lgr5 stem cells in intestinal crypts. Nature. 2011;469:415–418. doi:10.1038/nature09637.
- Menard S, Forster V, Lotz M, Gutle D, Duerr CU, Gallo RL, Henriques-Normark B, Putsep K, Andersson M, Glocker EO, et al. Developmental switch of intestinal antimicrobial peptide expression. J Exp Med. 2008;205:183–193. doi:10.1084/jem.20071022.
- Zhang Q, Pan Y, Yan R, Zeng B, Wang H, Zhang X, Li W, Wei H, Liu Z. Commensal bacteria direct selective cargo sorting to promote symbiosis. Nat Immunol. 2015;16:918–926. doi:10.1038/ni.3233.
- Lamas B, Richard ML, Leducq V, Pham HP, Michel ML, Da Costa G, Bridonneau C, Jegou S, Hoffmann TW, Natividad JM, et al. CARD9 impacts colitis by altering gut microbiota metabolism of tryptophan into aryl hydrocarbon receptor ligands. Nat Med. 2016;22:598–605. doi:10.1038/nm.4102.
- Bahaka D, Neut C, Khattabi A, Monget D, Gavini F. Phenotypic and genomic analyses of human strains belonging or related to Bifidobacterium longum, Bifidobacterium infantis, and Bifidobacterium breve. Int J Syst Bacteriol. 1993;43:565–573. doi:10.1099/00207713-43-3-565.
- Zhuang X, Xiong L, Li L, Li M, Chen M. Alterations of gut microbiota in patients with irritable bowel syndrome: A systematic review and meta-analysis. J Gastroenterol Hepatol. 2017;32:28–38. doi:10.1111/jgh.13471.
- Kerckhoffs AP, Samsom M, van der Rest ME, de Vogel J, Knol J, Ben-Amor K, Akkermans LM. Lower Bifidobacteria counts in both duodenal mucosa-associated and fecal microbiota in irritable bowel syndrome patients. World J Gastroenterol. 2009;15:2887–2892. doi:10.3748/wjg.15.2887.
- Allen AP, Hutch W, Borre YE, Kennedy PJ, Temko A, Boylan G, Murphy E, Cryan JF, Dinan TG, Clarke G. Bifidobacterium longum 1714 as a translational psychobiotic: modulation of stress, electrophysiology and neurocognition in healthy volunteers. Transl Psychiatry. 2016;6:e939. doi:10.1038/tp.2016.191.
- Pinto-Sanchez MI, Hall GB, Ghajar K, Nardelli A, Bolino C, Lau JT, Martin FP, Cominetti O, Welsh C, Rieder A, et al. Probiotic bifidobacterium longum ncc3001 reduces depression scores and alters brain activity: A pilot study in patients with irritable bowel syndrome. Gastroenterology. 2017;153:448–459 e8. doi:10.1053/j.gastro.2017.05.003.
- Giannetti E, Maglione M, Alessandrella A, Strisciuglio C, De Giovanni D, Campanozzi A, Miele E, Staiano A. A mixture of 3 bifidobacteria decreases abdominal pain and improves the quality of life in children with irritable bowel syndrome: A multicenter, randomized, double-blind, placebo-controlled, crossover trial. J Clin Gastroenterol. 2017;51:e5–e10. doi:10.1097/MCG.0000000000000528.
- Bradesi S, Schwetz I, Ennes HS, Lamy CM, Ohning G, Fanselow M, Pothoulakis C, McRoberts JA, Mayer EA. Repeated exposure to water avoidance stress in rats: a new model for sustained visceral hyperalgesia. Am J Physiol Gastrointest Liver Physiol. 2005;289:G42–53. doi:10.1152/ajpgi.00500.2004.
- Moloney RD, O’Mahony SM, Dinan TG, Cryan JF. Stress-induced visceral pain: toward animal models of irritable-bowel syndrome and associated comorbidities. Front Psychiatry. 2015;6:15. doi:10.3389/fpsyt.2015.00015.
- Bai T, Zhang L, Wang H, Qian W, Song J, Hou X. Fecal microbiota transplantation is effective in relieving visceral hypersensitivity in a postinfectious model. Biomed Res Int. 2018;2018:3860743. doi:10.1155/2018/3860743.
- Ait-Belgnaoui A, Payard I, Rolland C, Harkat C, Braniste V, Theodorou V, Tompkins TA. Bifidobacterium longum and lactobacillus helveticus synergistically suppress stress-related visceral hypersensitivity through hypothalamic-pituitary-adrenal axis modulation. J Neurogastroenterol Motil. 2018;24:138–146. doi:10.5056/jnm16167.
- Pratt C, Campbell MD. The effect of bifidobacterium on reducing symptomatic abdominal pain in patients with irritable bowel syndrome: A systematic review. Probiotics Antimicrob Proteins. 2019. doi:10.1007/s12602-019-09609-7.
- Bron PA, Tomita S, Mercenier A, Kleerebezem M. Cell surface-associated compounds of probiotic lactobacilli sustain the strain-specificity dogma. Curr Opin Microbiol. 2013;16:262–269. doi:10.1016/j.mib.2013.06.001.
- Spiller R, Garsed K. Postinfectious irritable bowel syndrome. Gastroenterology. 2009;136:1979–1988. doi:10.1053/j.gastro.2009.02.074.
- Barbara G, Stanghellini V, De Giorgio R, Cremon C, Cottrell GS, Santini D, Pasquinelli G, Morselli-Labate AM, Grady EF, Bunnett NW, et al. Activated mast cells in proximity to colonic nerves correlate with abdominal pain in irritable bowel syndrome. Gastroenterology. 2004;126:693–702. doi:10.1053/j.gastro.2003.11.055.
- Chadwick VS, Chen W, Shu D, Paulus B, Bethwaite P, Tie A, Wilson I. Activation of the mucosal immune system in irritable bowel syndrome. Gastroenterology. 2002;122:1778–1783. doi:10.1053/gast.2002.33579.
- Goral V, Kucukoner M, Buyukbayram H. Mast cells count and serum cytokine levels in patients with irritable bowel syndrome. Hepatogastroenterology. 2010;57:751–754.
- Thabane M, Kottachchi DT, Marshall JK. Systematic review and meta-analysis: the incidence and prognosis of post-infectious irritable bowel syndrome. Aliment Pharmacol Ther. 2007;26:535–544. doi:10.1111/j.1365-2036.2007.03399.x.
- Bevins CL, Salzman NH. Paneth cells, antimicrobial peptides and maintenance of intestinal homeostasis. Nat Rev Microbiol. 2011;9:356–368. doi:10.1038/nrmicro2546.
- Teltschik Z, Wiest R, Beisner J, Nuding S, Hofmann C, Schoelmerich J, Bevins CL, Stange EF, Wehkamp J. Intestinal bacterial translocation in rats with cirrhosis is related to compromised Paneth cell antimicrobial host defense. Hepatology. 2012;55:1154–1163. doi:10.1002/hep.24789.
- Sato T, Vries RG, Snippert HJ, van de Wetering M, Barker N, Stange DE, van Es JH, Abo A, Kujala P, Peters PJ, et al. Single Lgr5 stem cells build crypt-villus structures in vitro without a mesenchymal niche. Nature. 2009;459:262–265. doi:10.1038/nature07935.
- Jung P, Sato T, Merlos-Suarez A, Barriga FM, Iglesias M, Rossell D, Auer H, Gallardo M, Blasco MA, Sancho E, et al. Isolation and in vitro expansion of human colonic stem cells. Nat Med. 2011;17:1225–1227. doi:10.1038/nm.2470.
- Bar-Ephraim YE, Kretzschmar K, Clevers H. Organoids in immunological research. Nat Rev Immunol. 2019. doi:10.1038/s41577-019-0248-y.
- Han X, Lee A, Huang S, Gao J, Spence JR, Owyang C. Lactobacillus rhamnosus GG prevents epithelial barrier dysfunction induced by interferon-gamma and fecal supernatants from irritable bowel syndrome patients in human intestinal enteroids and colonoids. Gut Microbes. 2019;10:59–76. doi:10.1080/19490976.2018.1479625.
- Zhang YG, Wu S, Xia Y, Sun J. Salmonella-infected crypt-derived intestinal organoid culture system for host-bacterial interactions. Physiol Rep. 2014:2. doi:10.14814/phy2.12147.
- Andresen V, Gschossmann J, Layer P. Heat-inactivated Bifidobacterium bifidum MIMBb75 (SYN-HI-001) in the treatment of irritable bowel syndrome: a multicentre, randomised, double-blind, placebo-controlled clinical trial. Lancet Gastroenterol Hepatol. 2020. doi:10.1016/S2468-1253(20)30056-X.
- Al-Chaer ED, Kawasaki M, Pasricha PJ. A new model of chronic visceral hypersensitivity in adult rats induced by colon irritation during postnatal development. Gastroenterology. 2000;119:1276–1285. doi:10.1053/gast.2000.19576.
- Cani PD, Bibiloni R, Knauf C, Waget A, Neyrinck AM, Delzenne NM, Burcelin R. Changes in gut microbiota control metabolic endotoxemia-induced inflammation in high-fat diet-induced obesity and diabetes in mice. Diabetes. 2008;57:1470–1481. doi:10.2337/db07-1403.
- Cani PD, Possemiers S, Van de Wiele T, Guiot Y, Everard A, Rottier O, Geurts L, Naslain D, Neyrinck A, Lambert DM, et al. Changes in gut microbiota control inflammation in obese mice through a mechanism involving GLP-2-driven improvement of gut permeability. Gut. 2009;58:1091–1103. doi:10.1136/gut.2008.165886.
- Guglielmetti S, Tamagnini I, Minuzzo M, Arioli S, Parini C, Comelli E, Mora D. Study of the adhesion of bifidobacterium bifidum MIMBb75 to human intestinal cell lines. Curr Microbiol. 2009;59:167–172. doi:10.1007/s00284-009-9415-x.
- Yuan J, Wang B, Sun Z, Bo X, Yuan X, He X, Zhao H, Du X, Wang F, Jiang Z, et al. Analysis of host-inducing proteome changes in bifidobacterium longum NCC2705 grown in Vivo. J Proteome Res. 2008;7:375–385. doi:10.1021/pr0704940.