
ABSTRACT
Gut microbial communities of athletes differ from that of sedentary persons in both diversity and the presence of certain taxa. However, it is unclear to what degree elite athletes and non-elite athletes harbor different gut microbial community patterns and if we can effectively monitor the potential of athletes based on microbiota. A team of professional female rowing athletes in China was recruited and 306 fecal samples were collected from 19 individuals, which were separated into three cohorts: adult elite athlete’s (AE), youth elite athlete’s (YE), and youth non-elite athlete’s (YN). The differences in gut microbiome among different cohorts were compared, and their associations with dietary factors, physical characteristics, and athletic performance were investigated. The microbial diversities of elite athletes were higher than those of youth non-elite athletes. The taxonomical, functional, and phenotypic compositions of AE, YE and YN were significantly different. Additionally, three enterotypes with clear separation were identified in athlete’s fecal samples, with majority of elite athletes stratified into enterotype 3. And this enterotype-dependent gut microbiome is strongly associated with athlete performances. These differences in athlete gut microbiota lead to establishment of a random forest classifier based on taxonomical and functional biomarkers, capable of differentiating elite athletes and non-elite athletes with high accuracy. Finally, these versatilities of athlete microbial communities of athletes were found to be associated with dietary factors and physical characteristics, which can in concert explain 41% of the variability in gut microbiome.
Introduction
The symbiotic human microbiota consist of over 100 trillion microbial cells, colonizing primarily the gut,Citation1–3 that has become an inalienable part of the host. In recent decades, the potential role of the gut microbiome has become the focus of human health research,Citation4 primarily in terms of its contribution to host physiology, metabolism, nutrition, and immune system development.Citation5,Citation6 The composition of the human gut microbial community is highly associated with environmental and stochastic factors, such as age, diet, antibiotic treatment,Citation7 and exercise.Citation8 Previous studies have reported that age-related changes could affect the human gut microbial ecosystem and alter the microbiota composition at the different stages of life, which demonstrated that the human gut microbial composition is strongly associated with the age of host.Citation9–11 A growing number of studies highlight that the composition of human gut microbiota and enterotypes could be influenced by changes in dietCitation12,Citation13 and antibiotic treatments,Citation14 yet only a few studies have illustrated the relationship between the gut microbiota and exercise,Citation15,Citation16 particularly for professional athletes.Citation8 Nevertheless, these studies have suggested that exercise may influence the composition of the gut microbial community.Citation15
During training or competition, athletes tolerate numerous hours of physical and emotional stress, which induces a biological and psychological response that ultimately activates the sympathetic-adrenomedullary system and hypothalamus-pituitary-adrenal axes, resulting in release of stress and catabolic hormones, inflammatory cytokines, and microbial molecules, and changing the physiological homeostasis of athletes.Citation17–19 Recent evidence shows that athletes, particularly elite athletes, are more tolerant to various kinds of stressesCitation20,Citation21 and that the gut microbiota can modulate excitatory and inhibitory neurotransmitters and neurotransmitters-like substances, especially in response to physical and emotional stress.Citation22,Citation23 Specifically, a close correlation has been characterized between physical and emotional stress during exercise and changes in gut microbial composition.Citation22,Citation23 Moreover, the gastrointestinal tract responds to stress by releasing hormones, such as neuropeptide Y and dopamine.Citation24 Given the diverse roles of gut microbiota in gastrointestinal function, enteric immunity,Citation25 endocrinologyCitation26 and regulating oxidative stress,Citation27 it is not surprising that efforts to explore the functions of gut microbiota in athletes, particularly elite athletes, are increasing. In recent studies, the microbial communities of a cohort of professional male athletes of international-level rugby players have been assessed against healthy controls at the taxonomical and functional structure levels,Citation8,Citation16 which demonstrated that the gut microbiota of athletes was significantly more diverse than that of healthy controls, while several gut microbiota taxa were identified as significantly different. Specifically, 22 distinct phyla were positively associated with protein consumption and creatine kinase. Further, certain pathways and fecal metabolites, including amino acid and carbohydrate metabolism, as well as microbial-produced short-chain fatty acids acetate and butyrate, were reported to exhibit significant differences. Similarly, comparison of the gut microbiota of healthy controls and the top Polish endurance athletes revealed that excessive training correlates with differences in gut microbial composition and increased the bacterial diversity.Citation28 However, these previous studies focused primarily on the composition and richness of gut microbiota with the primary goal of differentiating microorganisms between athletes and sedentary controls. It, therefore, remains elusive if elite athletes and non-elite athletes, adult athletes and youth athletes, even within the same sport, harbor different gut microbiome patterns in regard to both taxonomical and functional compositions. This information could prove highly significant for monitoring the potential of elite athletic candidates, while also informing the development of novel microbiome approaches for the regulation of the gut microbiota of athletes. Furthermore, the direct associations between athletes’ gut microbiome and their environmental factors, including dietary factors, physical characteristics, and sport-related features, remain to be characterized.
Hence, in this study, a team of 19 professional female rowing athletes in China, including elite and non-elite athletes, was recruited. A total of 306 fecal samples (on average 16 samples per person) were collected and analyzed via 16S rRNA gene sequencing. The dietary factors, physical characteristics, and sport-related features of these 19 athletes were measured and recorded. The elite and non-elite athletes were included to determine variations in taxonomical and functional compositions corresponding to these factors and to identify the enterotypes specific to different classes of athletes. Moreover, the factors responsible for shaping the microbial community of athletes were also explored. Importantly, the results of this study have facilitated the construction of a random forest classifier capable of monitoring the potential of elite athletes with high accuracy. Our work has the potential to impact multiple facets of sports science, including the monitoring of athletic candidates via microbiome-assisted approaches, as well as precision dietary preparation for athletes.
Results and discussions
Microbial diversity of gut microbiota in elite and youth non-elite athletes
A total of 45,997,508 high-quality sequencing reads were obtained by sequencing the V3–V4 region of the 16S rRNA gene of bacteria and archaea from 306 fecal samples collected from 19 Chinese female rowing athletes (ranging from 54,667 to 308,119 sequences, mean = 150,318 sequences and median = 146,111 sequences, Table S1). We identified 11,533 operational taxonomic units (OTUs) for these fecal samples, ranging from 343 to 2,894 OTUs (median = 1,086 OTUs, Table S1) using the ‘pick_closed_reference_otus.py’ command in QIIME platform.
Previous studies have reported a higher microbial richness and diversity in athletes compared to healthy controlsCitation8,Citation16,Citation28 and found that exercise could increase the microbial diversity for gut microbial communities of both mice and humans.Citation8,Citation29 In the present study, the Shannon and Simpson indices were stable, suggesting that most of the microbiota had been detected. Furthermore, the Shannon and Simpson indices of adult elite athlete (AE) and youth elite athlete (YE) cohorts were significantly higher than the youth non-elite athlete (YN) cohort (, Kruskal–Wallis test, p < .01), suggesting that the microbial diversity of elite athletes was rich compared to the youth non-elite athletes.
Figure 1. Microbial diversity of gut microbiota in professional Chinese female rowing athletes reveals that significant differences exist in elite and youth non-elite athletes. Comparison of (a) Shannon index and (b) Simpson index of microbial communities among AE, YE and YN cohorts. Linear discriminant analysis was performed to maximize the separation of AE, YE and YN cohorts based on (c) taxonomical composition and d: functional composition collapsed to the level three of the KEGG hierarchy
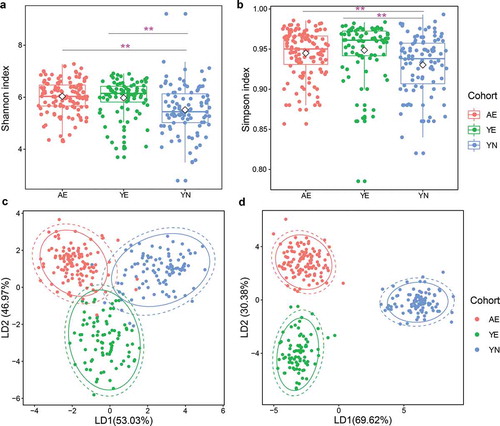
The microbial composition of AE, YE and YN cohorts was distinctly separated based on weighted and unweighted UniFrac distance metrics and the Abund-Jaccard distance metric (Supplementary Figure S1). We then applied linear discriminant analysis (LDA) to differentiate AE, YE and YN cohorts based on taxonomical and functional compositions, respectively. Differences in microbial composition among AE, YE and YN cohorts were observed ( and S2), revealing that the AE and YE cohorts harbor distinct gut microbial compositions compared to the YN cohort in regard to both taxonomical composition (Permutational multivariate analysis of variance (PERMANOVA), Bray–Curtis dissimilarity index, Bonferroni–corrected p < .01, ) and functional composition (PERMANOVA, Bray–Curtis dissimilarity index, Bonferroni–corrected p < .01, , ANOSIM, Bray–Curtis dissimilarity, p = .001, Figure S2a).
Gut microbes that differentiate elite and youth non-elite athletes
We observed that Firmicutes, Bacteroidetes, Proteobacteria and Actinobacteria constituted the four most enriched bacterial phyla in AE, YE and YN cohorts. Importantly, these were also the four most abundant phyla identified within the Chinese population.Citation30,Citation31 Herein, we investigated the relative abundances of these phyla in rowing athletes against other sports. Specifically, the average relative abundances of Firmicutes and Proteobacteria of AE (76.27% and 8.73%) and YE (64.7% and 10.69%) were higher than those of YN (58.12% and 8.01%, and S3a); whereas the average relative abundance of Bacteroidetes in YN (26.19%) was significantly higher than that of AE (11.41%) and YE (16.63%, and S3a). These results for female Chinese rowers correspond to those reported for male rugby players, for which the relative abundance of Bacteroidetes phylum was also decreased.Citation8 Recently, the Firmicutes:Bacteroidetes (F/B) ratio was reported to be positively correlated with fecal total short-chain fatty acids (SCFAs),Citation32,Citation33 most noticeably for fecal butyrate,Citation34,Citation35 and higher maximal oxygen uptake (VO2 max/kg, a key characteristic of elite athletes) was also reported.Citation36 Therefore, the F/B values were calculated in the present study, and the F/B values of AE (average F/B: 94.71) and YE (average F/B: 52.21) were found to be significantly higher than that of the YN cohort (average F/B: 12.51, Kruskal–Wallis test, all p < .01), indicating a decrease in F/B in the YN cohort. Hence, we speculated an increase in SCFAs production in AE and YE cohorts compared to the YN cohort. In addition, Euryarcharota, which was the only detected phylum in the archaea domain, was predominant in the YE cohort. At the genus level, we found that Riminococcaceae_unclassified, Clostridiales_unclassified, Faecalibacterium and Lachnospiraceae_unclassified were enriched in the AE cohort, while Bacteroides and Prevotella were dominant in the YE cohort and YN cohort, respectively ( and S3b). The differences in taxonomical composition of AE, YE and YN cohorts were the driving forces for the differences in the microbial community structures.
Figure 2. Differentially abundant taxonomical, phenotypic and functional compositions in gut microbiomes for elite and youth non-elite athletes. (a) Ternary plot showing the distribution of samples from AE, YE and YN cohorts based on the relative abundance of three dominant phyla. (b) Radar charts showing the taxonomical composition for AE, YE and YN cohorts at the genus level. The genera with mean relative abundances greater than 1.5% of the total abundance in these three cohorts are included. Thus, only the 14 most abundant genera in each group are shown for clarity. (c) Phenotypic composition for AE, YE and YN cohorts. Discrete phenotype relative abundances were compared using pairwise Mann–Whitney–Wilcoxon tests with false discovery rate correction. (d) Functional composition for AE, YE and YN cohorts. The KOs with mean relative abundances greater than 0.2% of the total abundance in these three cohorts are included. Ultimately, only the 13 most abundant KOs in each group are shown for clarity
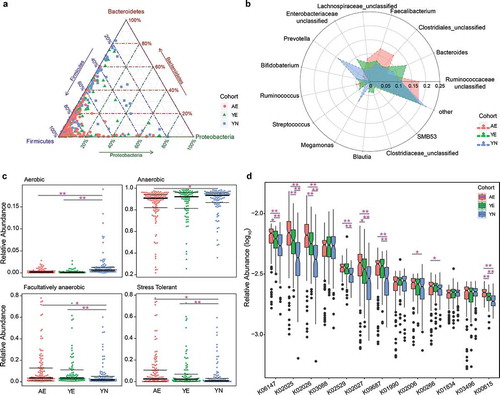
Based on the taxonomical composition, we investigated the phenotypic compositions among the three cohorts of athletes using Bugbase.Citation37 The results showed that the proportion of aerobic microbiota in the YN cohort (mean: 1.54%) was significantly higher than that of the AE (mean: 0.32%) and YE cohorts (mean: 0.24%, pairwise Mann–Whitney–Wilcoxon tests, pairwise p values < .01, Kruskal–Wallis test, group p value < .01, ); meanwhile, the relative abundance of anaerobic microbiota in the YN cohort (mean: 88.54%) was significantly higher than in the AE cohort (mean: 84.38%, pairwise Mann–Whitney–Wilcoxon tests, p < .01, ), and the proportion of facultative anaerobic microbiota in the AE (mean: 11.02%) and YE cohorts (mean: 9.97%) were significantly higher than in the YN cohort (mean: 6.49%, pairwise Mann–Whitney–Wilcoxon tests, pairwise p values < .05, Kruskal–Wallis test, group p value < .01, ). Interestingly, we found that the relative abundances of oxidative stress tolerant microbiota in AE (mean: 9.82%) and YE cohorts (mean: 8.35%) were significantly higher than those in the YN cohort (mean: 5.3%, pairwise Mann–Whitney–Wilcoxon tests, pairwise p values < .01, Kruskal–Wallis test, group p value < .005, ). Oxidative stress, which is defined as an imbalance between the production of oxygen-free radicals (reactive oxygen species) and their elimination by protective mechanisms,Citation38 is a critical mediator of low-grade inflammation in various diseases.Citation39,Citation40 Furthermore, previous studies have reported that different strains of intestinal microbiota exhibit different tolerance to oxidative stress,Citation38 suggesting that gut microbiota might play a key role in controlling oxidative stress, inflammatory responses and improving metabolism and energy expenditure.Citation41 Hence, we speculated that a higher proportion of oxidative stress tolerant microbiota may serve to improve performance in competitive sports, such as rowing. Additionally, we observed significant differences in the proportion of gram-positive (Kruskal–Wallis test, group p value < .01, Figure S4a) and gram-negative bacteria (Kruskal–Wallis test, group p value < .01, Figure S4b) between the AE, YE and YN cohorts.
Increasing evidence shows that the functional composition of the gut microbial community of professional athletes differs from that of healthy controls. Specifically, the relative increases have been reported in amino acid and antibiotic biosynthesis, and carbohydrate metabolism, in professional international rugby union players compared to healthy controls.Citation8,Citation16 Here, we also sought to identify differences in functional pathways among the AE, YE and YN cohorts in this study. The results showed significant differences in the functional composition between the three cohorts (Adonis PERMANOVA, Bray–Curtis dissimilarity index, p < .01, Figure S5). Of the top 13 KEGG Orthologs (KOs) determined to be enriched in the three cohorts (Table S2), 11 were associated with energy metabolisms and found to differ significantly between the cohorts (). Specifically, K06147, K09687, K01990 and K02006 are involved in ATP metabolisms and K00266 is involved in NADPH/NADH metabolisms, while K02025, K02026, K02027 are involved in multiple the sugar transport system (Table S2). Furthermore, K02529, K01834 and K00615 contribute to carbohydrate metabolisms (Table S2), which is critical for athletes.Citation28,Citation42 Overall, our results reveal an increase in the proportion of functional pathways involved in ATP metabolisms, multiple sugar transport systems and carbohydrate metabolisms in the microbial communities of elite athletes compared to youth non-elite athletes.
Enterotype analysis in elite and youth non-elite athletes
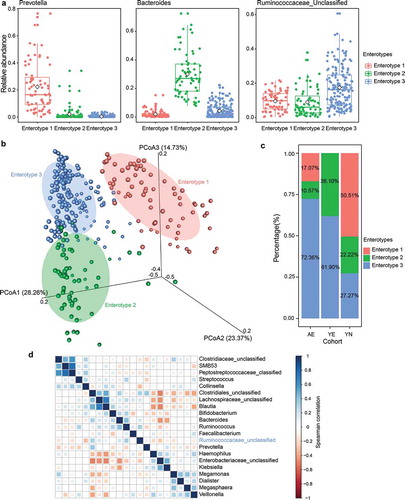
To gain insights into the differences in microbial communities among AE, YE and YN cohorts, we stratified the 306 gut microbial community samples. Based on the microbial composition at the genus level, we used partitioning around medoids (PAM) method and stratified these samples into three enterotypes. We found that Prevotella, Bacteroides and Ruminococcaceae_unclassified were predominant in enterotype 1, enterotype 2 and enterotype 3 (), respectively. We then applied principal coordinates analysis (PCoA) of Jensen–Shannon distance at the genus level to visualize the three enterotypes, which showed that their microbial composition was distinctly different with each other (Adonis PERMANOVA, Bray–Curtis dissimilarity index, p < .01, ). A higher proportion of the AE and YE cohorts were distributed in enterotype 3 (72.3% for AE and 61.9% for YE), while 50.51% YN samples were found in enterotype 1 (). Interestingly, the members of Ruminococcaceae, the predominant genus in enterotype 3, belong to the order Clostridiales, which are likely to produce SCFAs,Citation43 can improve insulin sensitivity,Citation44 and interact with specific G-protein coupled receptors on the intestinal L-cells.Citation45 These findings suggest that enterotype 3 may represent a gut microbiota associated with elite athletes. Additionally, considering the enrichment of elite athletes in enterotype 3, we chose the dominant genera (average relative abundance > 0.01%) and performed co-occurrence analysis via Spearman’s correlation and found that 20 genera were not positively correlated with Ruminococcaceae_unclassified (Spearman’s correlation < 0.4), the enriched genus in enterotype 3 (), suggesting that Ruminococcaceae_unclassified might play a key role in enterotype 3, and associates with elite athletes.
Figure 3. Gut enterotypes in elite and youth non-elite athletes. A total of 306 samples are stratified into three enterotypes. The major contributor in the three enterotypes is Prevotella, Bacteroides and Ruminococcaceae_unclassified, respectively. (a) Relative abundances of the top genera (Prevotella, Bacteroides and Ruminococcaceae_unclassified) in each enterotype. (b) Three enterotypes were visualized by PCoA of Jensen-Shannon distance at the genus level. (c) The proportion of AE, YE and YN samples distributed in three enterotypes. 72.3% AE, 61.9% YE and 27.27% YN samples are found in enterotype 3. (d) Co-occurrence patterns among the dominant genera (average relative abundance > 0.01%) across the samples from enterotype 3, as determined by the Spearman correlation analysis
Correlation between enriched gut microbiota and dominant functional composition
To gain insights into the interactions from an ecological perspective among the members of the microbial community, we next investigated the interactions between dominant microbiota based on the SparCC algorithm. In the genus-genus co-occurrence network, we observed 50 differently abundant microbiota in the AE, YE and YN cohorts. Moreover, the number of differently abundant microbiota was higher in the YE cohort (25) compared to the AE (10) and YN cohorts (15, ). A large proportion of the observed correlations between the enriched microbiota among AE, YE and YN cohorts were negative, while many of the correlations between enriched microbiota were positive within each cohort (). For example, we observed that Klebsiella, Erwinia, Trabulsiella, Serratia and Citrobacter exhibited strong positive correlations in the AE cohort, while WAL_1855D, Prophyromonas, Peptoniphilus, and Anaerococcus were strongly and positively correlated in the YE cohort; and Paraprevotella, Eubacterium, Paraprevotellaceae Prevotella, Prevotellaceae Prevotella and Lactobacillus have strong positive correlations in the YN cohort ().
Figure 4. Correlations between enriched microbiota and dominant functional traits. (a) Correlation among the 50 differentially abundant microbiota in professional Chinese female rowing athletes. Nodes with correlations between circles are labeled with faint red (positive correlation) and green (negative correlation). The area of each circle is divided into three parts labeled with faint red (enriched in AE cohort), green (enriched in YE cohort) and pale blue (enriched in YN cohort). The colors of the boundary of circles represent different phylum. (b) Correlations between abundant microbiota and abundant functional composition, as determined by the Spearman’s rank correlations analysis
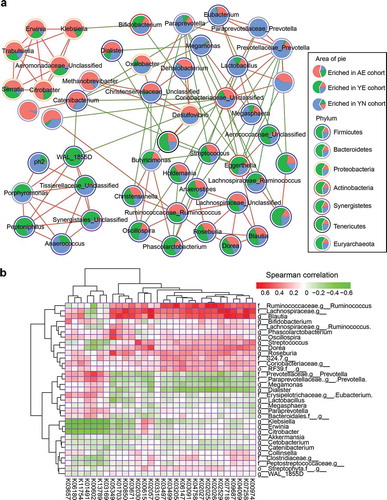
To explore the relationship between dominant microbiota and abundant functional composition, we calculated the Spearman rank correlation between them. We found that the enriched microbiota in the YE cohort, such as Ruminococcus and Blautia, were strongly positively correlated with enriched KOs (), such as K00974, K07258, K04069, K07718 and K05349, which contribute to carbon fixation (reductive pentose phosphate cycle), methane metabolism, central carbohydrate metabolism, branched-chain amino acid metabolism, as well as phosphate and amino acid transport systems. The enriched microbiota in the YN cohort, including Prevotella, Megamonas, Dialister and Eubacterium, were negatively correlated with the functional composition that was positively correlated with the enriched microbiota of the YE cohort, however, were positively correlated with KOs, such as K03169, K13789, K00602, K01491, K11757, K06180, and K03657, which contribute to carbon fixation (reductive acetyl-CoA pathway), terpenoid backbone biosynthesis, purine metabolism, as well as cofactor and vitamin biosynthesis (). Alternatively, the enriched microbes of AE, including Klebsiella, Erwinia and Citrobacter, were negatively correlated with the KOs that were positively correlated in the YE and YN cohorts, while the remainder of the enriched microbiota, such as Clostridiaceae_unclassified and Peptostreptococcaceae_unclassified were positively correlated with carbon fixation (reductive pentose phosphate cycle), methane metabolism, central carbohydrate metabolism, branched-chain amino acid metabolism, as well as phosphate and amino acid transport systems ().
These findings demonstrate that diverse microbes dominated in different cohorts, which causes the diverse functional modules enriched in the different cohorts. Furthermore, we found that the taxonomical composition of the microbial community of elite athletes is positively correlated with carbon fixation (reductive pentose phosphate cycle), methane metabolism, central carbohydrate metabolism, branched-chain amino acid metabolism, as well as phosphate and amino acid transport systems. Due to the fact that the human gut microbial composition is strongly associated with the age of host,Citation9,Citation10,Citation46 we speculated that the difference of human gut microbial composition, including taxonomical and functional compositions, was correlated with age and other environmental factors.
Classification assessment for monitoring the potential of athletes
To further explore the taxonomical and functional signatures of elite athletes, we used LEfSe to identify biomarkers for each cohort based on the taxonomical and functional compositions. We obtained 21 taxa with lda score > 3.5 () and 20 KOs with lda score > 2.0 (). Prevotella and Bacteroides were selected as biomarkers for YN and YE cohorts, respectively, while Ruminococcaceae and Ruminococcus were selected as biomarkers for the AE cohort (). The results were consistent with the dominant genera in each enterotype. Additionally, Faecalibacterium, which has been reported as SCFA-producing taxa, and is positively associated with exercise-induced butyrate concentrations,Citation47 was also observed as a biomarker for the AE cohort. Moreover, previous studies have reported that Faecalibacterium spp. also induces a local and systemic anti-inflammatory response.Citation48,Citation49 We speculate that exercise leads the observed differences in the microbial composition of athletes, and the high proportion of Faecalibacterium () can induce the production of more SCFAs to improve the sport performance for the AE cohort. This has been confirmed by mapping the functional biomarkers to the KEGG pathway, which demonstrated that these functional biomarkers mainly contribute to glycan biosynthesis and metabolism, as well as carbohydrate metabolism.
Figure 5. Biomarker analysis and a classification assessment for the monitoring of potential of athletes. (a) Taxonomical biomarkers for identification of AE, YE and YN cohorts. (b) Functional biomarkers for identification of AE, YE and YN cohorts. Random forest models are constructed using the (c) taxonomical biomarkers, (d) functional biomarkers, and (e) the combination of taxonomical biomarkers and functional biomarkers for differentiating the AE cohort (faint red) and YE cohort (green) from YN cohort
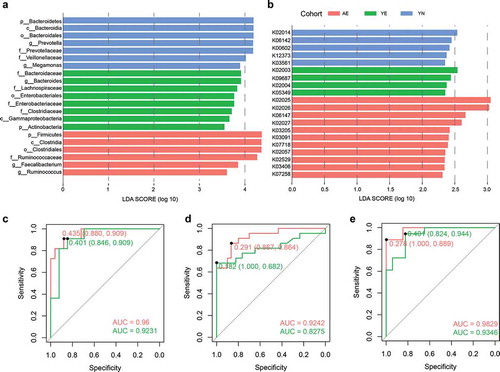
To exploit the potential of taxonomical biomarkers and functional biomarkers for monitoring the potential of athletes, we constructed random forest classifiers using the identified biomarkers. A random forest model using tenfold cross-validation and 50 time repeats was generated. Average accuracy was calculated and the receiver operating characteristic (ROC) curves for classifying AE and YE samples from YN samples was visualized (). Our results show that, based on the taxonomical biomarkers, the average accuracy for discriminating AE and YE samples from YN samples was 92.93% (82.22–100%), and 90.7% (75.76–100%, ), respectively. Similarly, based on the functional biomarkers, the average accuracy for identifying AE and YE samples from YN samples was 89.18% (80–100%) and 79.63% (65.71–97.06%, ), respectively. We also investigated the utility of the classifier based on combination of taxonomical biomarkers and functional biomarkers and found that the average accuracy for detecting AE samples (94.52%, ranging from 86.96% to 100%) from YN samples was higher than the accuracy using taxonomical biomarkers or functional biomarkers individually (). The average accuracy for identifying YE samples from YN samples based on the combination of taxonomical biomarkers and functional biomarkers was similar to the accuracy based on taxonomical biomarkers (). We then evaluated the feature importance for the random forest model and found that the most discriminatory taxonomical biomarkers were Megamonas, Ruminococcus, Prevotella, Prevotellaceae and Ruminococcaceae. Among these, a previous study reported that the members of Ruminococcus, such as R. lactaris, may improve the ability of glucose tolerance for the host.Citation50 We also identified that the most discriminatory functional biomarkers were K00602 (Phosphoribosylaminoimidazolecarboxamide formyltransferase/IMP cyclohydrolase), K07258 (D-alanyl-D-alanine carboxypeptidase), K03561 (biopolymer transport protein ExbB), K02004 (putative ABC transport system permease protein) and K03406 (methyl-accepting chemotaxis protein, Figure S6).
Taken together, the taxonomical and functional signature analyses revealed significant differences in the microbial community of elite and youth non-elite athletes. Our results have great potential to provide guidance for monitoring the potential of elite athletes from a group of athletes. Of course, our results only provide the information from the microbiota perspective alone; hence, further validation is required as the gut microbiota composition of athletes is affected by a myriad of factors, including exercise training schedule, and dietary habits. Once the dietary habits, or the intensity of exercise training changes, the gut microbiota composition of athletes responds in kind and becomes altered,Citation41,Citation51 which provides a unique opportunity to manipulate and remodel the gut microbiota via microbiome approaches. In summary, our results can be used as a supplement in monitoring the potential of the elite athletes.
Factors influencing the structure of gut microbiota for elite and youth non-elite athletes
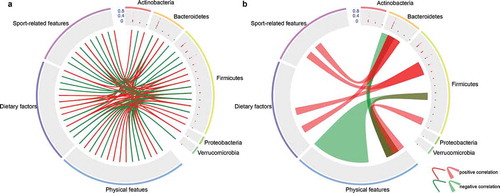
Out of these 19 athletes, we chose the taxonomical composition of six individuals (4 YE and 2 YN, 120 fecal samples) and 47 factors (Table S3), which were divided into dietary factors, physical characteristics, and sport-related features, to explore the correlations among microbial community, dietary factors, physical characteristics and sport-related features. We set the threshold of average relative abundance of genus as 0.05% and selected 78 differentially abundant microbiota. The Spearman correlation coefficients were calculated between 78 differentially abundant microbiota and 47 factors. Based on the p value (p < .05) and Spearman correlation coefficients (cutoff > 0.6), we obtained 22 differentially abundant microbiota with strong positive or negative correlations with 37 different factors (Table S4), including physical characteristics (15), dietary factors (12) and sport-related features (10, ). Moreover, we found that diverse factors have various correlations with the dominant microbiota (). Furthermore, due to the collinear nature of these 37 factors, we used the interactive forward selection function of Canoco software (version: 5.0) to eliminate collinearity and to select factors depending on their contribution, p value and adjusted p value of each feature.Citation52 Ultimately, five factors were selected (referred to the section of Materials and Methods), namely, intermediate cell, erythrocyte, staple food, vegetables, and the time of closing one’s eyes while standing on left foot, to estimate the effects on the microbial community. The variation partitioning analysis specifies that 41% of the inter-person microbiome variability is associated with the concert effects of factors related to physical characteristics (intermediate cell and erythrocyte), dietary factors (staple food and vegetables) and sport-related features (the time of closing one’s eyes while standing on left foot). Inter-person microbiome variability is mainly affected by dietary factors (29%) and physical characteristics (21%). The remaining inter-person microbiome variability may be associated with host genetics and other factors, such as female hormone concentration. For instance, previous studies have reported that female hormones fluctuate throughout the menstrual cycle,Citation53 and their concentration varies with age.Citation54 Considering that the current study was limited to only fecal sample collection, detailed information regarding hormones was not obtained, while complete understanding regarding the relationship between athletic and physical activity and female hormone concentrations would be critical in future investigations. Nevertheless, our results highlight that the versatility of the microbial communities in athletes is associated with dietary factors and their physical characteristics. Namely, dietary habits and the athlete’s physical characteristics have profound impacts on shaping the gut microbiota of athletes, and obvious differences could be observed for the resulting enterotypes for elite and youth non-elite athletes. Hence, we speculate that while dietary factors and physical characteristics strongly affect the performance of rowers, the gut microbiome plays a mediating role in this process.
Figure 6. Correlations between environmental factors and dominant microbiota. (a) Correlation between the 22 differentially abundant microbiota (genus level) and environmental factors. (b) Correlations between one microbiota and multiple factors or between multiple microbiota with one factor. Among the 78 differentially abundant microbiota (0.05%), 22 differentially dominant microbiota were selected based on the p value (p < .05) and Spearman correlation coefficients (cutoff > 0.6). Genera are grouped at the phylum level. The 37 factors were divided into three groups, including physical features (15), dietary features (12) and sport-related features (10). Lines and ribbons were colored according to the Spearman correlation coefficients. Red links represent positive correlation while green links represent negative correlation
Conclusion
Our work has focused on the complex associations among athlete performance, gut microbiota, dietary factors, physical characteristics and sport-related features, for elite and youth non-elite athletes in the professional Chinese female rowing teams. Firstly, stratification of athlete gut microbiota revealed that the gut microbiota of elite athletes and youth non-elite athletes has different gut microbial community patterns (enterotypes), in regard to both taxonomical structure and functional composition, with the majority of elite athletes assigned to enterotype 3. We also found that the SCFA-producing bacteria, such as Clostridiales, Ruminococcaceae and Faecalibacterium, are dominant in the microbial community of elite athletes. Secondly, in-depth functional profiling revealed that ATP metabolisms, multiple sugar transport systems and carbohydrate metabolisms are enriched in the microbial community of elite athletes. Thirdly, an accurate classifier was constructed based on the combination of taxonomical and functional biomarkers, which highlighted great potential for monitoring candidate elite athletes from a group of athletes. Finally, we demonstrated that the gut microbiota is strongly associated with physical characteristics, dietary factors and sport-related features, which can in concert explain 41% of the variability in gut microbiome. Importantly, the versatility of the microbial community of athletes, which might affect the performance of athletes by altering the gut microbiome, is associated with dietary factors (29%) and physical characteristics (21%). These findings have highlighted the complex interplay of gut microbiota, dietary factors, physical characteristics and performance of athletes, with gut microbiota serving as a key player among them. Several limitations associated with our study should also be noted, especially concerning the use of only female athletes, lack of fecal metabolomics data and direct functional data, as well as the lack of long-term follow-up analysis, to confirm our results. Despite these limitations, we believe that the patterns and associations discovered in this study are general enough in sports science, for guiding the monitoring of candidate athletes, as well as for precision dietary preparation for athletes.
Materials and methods
Study design and sample collection
Professional female rowing athletes (n = 19), aged 12–26 (median age 19), with no medical issues and no antibiotic treatment within the previous 4 months, were selected for fecal sample collection. According to the 19 athletes’ performance, grade in athletic competition and information regarding technical level obtained from General Administration of Sport of China (https://ydydj.univsport.com/index.php), we found that 12 athletes won individual or team championships in the province-level, national-level and international-level champion competition. These 12 individuals were thus categorized as elite athletes (champion) while the remaining seven were divided into non-elite athletes (non-champion, Table S3). An adult is defined as 19 y old or aboveCitation55 and an athlete’s age greatly influences the body characteristics, such as hormones and growth.Citation56 The age of non-elite athletes (YN, n = 6) ranged from 12 to 16 y in this present study, and we selected the median age (19) as the threshold to divide elite athletes into an adult (age: 19–26, AE, n = 7) and youth cohort (age: 12–17, YE, n = 6) to better compare the differences in microbial communities between elite and non-elite athletes, youth elite and youth non-elite athletes, as well as youth elite athletes and adult elite athletes. We recruited these 19 athletes and collected their fecal samples from April to May 2017. Due to varying times of competitions for the individual athletes participating in the study, inconsistencies arose in the amount of time spent at the Wuhan training base, resulting in variations in the collection of fecal samples. In the present study, we attempted to recruit more athletes and collect more fecal samples from these athletes on the time series. As a result, there are differences in the number of fecal samples for each athlete. A total of 123 and 84 fecal samples were collected from the AE and YE cohorts, respectively, as well as 99 samples from the YN cohort. In total, 306 fecal samples with an average of 16 samples per person were collected (Table S1). Except the athletes designated as ST01, the number of fecal samples was greater than nine (Table S1) and the fecal samples constituted longitudinal samples. Fecal samples were collected and stored in a 50 mL sterilized tube, immediately placed on frozen freezer packs and transformed to the laboratory to store at −80°C. To explore the major drivers of gut microbial composition, we recorded dietary factors by using a questionnaireCitation31 and measured physical characteristics and sport-related indices for each athlete (Table S3). The dietary factors presented in Table S3 are comprised of drinking, staple food, vegetables, meat poultry, seafood, bean, grease, salt, raw garlic, etc., and the number of each feature of dietary factors in Table S3 represents the relative amount consumed for each type of diet. Physical characteristics refer to the result of a complex combination of various factors, such as age, height, weight, body composition, and several indicators of the physiological and biochemical system. We obtained the values of physical characteristics for athletes via different strategies. The age of athletes was obtained using a questionnaire. The height and weight of athletes were measured using an electronic height tester. The body composition of athletes (Table S3), including protein mass, body fat content, fat percentage, etc., were measured with the professional body composition analyzer (X-SCAN PLUS II, Jawon Medical Co., Ltd, South Korea).Citation57 The indicators of the physiological and biochemical system (Table S3), such as intermediate cell and hemoglobin, were measured via routine blood tests at the school hospital of Wuhan Sports University.Citation58 The sport-related features (Table S3) were mainly measured with MetaLyzer II (Cortex, Leipzig, Germany)Citation59 and Technogym multipower system D4773L (TECHNOGYM, Italy).Citation60 To investigate the difference of characteristic differences among YN, YE and AE groups, we compared the features of dietary factors, physical characteristics, and sport-related features, which showed that these features, including age, intermediate cell, erythrocyte, snacks, maximal anaerobic power, the maximum oxygen uptake determination by power bicycle, etc., were significantly different between different groups (Table S3).
DNA extraction and 16S rRNA gene sequencing
DNA was extracted from fecal samples using the PowerSoil DNA Isolation Kit (MoBio, USA) following manufacturer’s instructions. All extracted DNA was dissolved in TE buffer and stored at −20°C. DNA concentration was quantified using a Qubit® 2.0 Fluorometer (Invitrogen, Carlsbad, CA) and DNA quality was assessed on 0.8% agarose gels. To determine the taxonomical composition of the gut microbial community, we sequenced the V3−V4 hypervariable region of the 16S rRNA gene of microbes for each sample. Specifically, we used 5–50 ng of DNA as a template for amplifying the V3−V4 amplicon using the forward primer (5ʹ-CCTACGGRRBGCASCAGKVRVGAAT-3ʹ) and reverse primer (5ʹ-GGACTACNVGGGTWTCTAATCC-3ʹ). Indexed adapters were added to the ends of 16S rDNA amplicons via limited cycle PCR and the sequencing library was constructed using a MetaVxTM Library Preparation kit (GENEWIZ, Inc., South Plainfield, and NJ, USA). DNA libraries were verified and quantified by an Agilent 2100 Bioanalyzer (Agilent Technologies, Palo Alto, CA, USA) and Qubit® 2.0 (Applied Biosystems, Carlsbad, CA, USA). All sequencing reactions were performed on the Illumina MiSeq platform using a paired-end sequencing strategy. All sequencing data for 306 fecal samples were deposited into NCBI’s Sequence Read Archive (SRA) database with the Bioproject number PRJNA513393.
Quality control, OTU clustering, and taxonomical profiles
All 16S rRNA gene amplicons were processed to obtain high-quality sequences. We spliced the paired-end reads using the ‘make.contigs’ command in mothurCitation61 (version 1.25.0) with default settings. All spliced reads containing ambiguous base calls (N), longer than 550 bp and shorter than 220 bp, were removed using the ‘trim.seqs’ command in mothur. We identified putative chimeras against the SILVA databaseCitation62 (Release 123) and removed the chimeras using the ‘chimera.uchime’ and ‘remove.seqs’ commands in mothur. High-quality sequences were analyzed in QIIME package (Quantitative Insights Into Microbial Ecology, Boulder, CO, USA, v1.9.1)Citation63 for OTU classification, tree construction and taxonomic assignment. The Greengenes database (version 13_5)Citation64 was used as the reference database for classifying OTUs that were clustered at the 97% nucleotide identity threshold using the ‘pick_closed_reference_otus.py’ command. We removed singletons from the OTUs table before performing subsequent analysis.
Microbial diversity assessment
Using QIIME, we calculated the alpha diversity and beta diversity values. Shannon and Simpson indices were chosen for assessing the alpha diversity of microbial communities among the YN, AE and YE cohorts. For beta diversity, the final OTU table was rarefied to 54,661 reads per sample. Abund-Jaccard, weighted and unweighted UniFrac distance metricsCitation65 were used to measure the similarity of community structure between samples. Microbial communities clustering was arrayed by principle coordinate analysis (PCoA) and visualized using R (version: 3.4.3) with ‘rgl’ package (version: 0.99.16).
Prediction of functional and phenotypic compositions
We applied Phylogenetic Investigation of Communities by Reconstruction of Unobserved States (PICRUSt, version: 1.0.0-dev)Citation66 to profile the functional composition of microbial communities based on the high-quality of 16S rRNA gene according to the manual of PICRUSt. The functional trait abundances were determined using the KEGG database (version 66.1, May 1, 2013).Citation67 The predicted functional content was collapsed to level three of the KEGG hierarchy and the KOs were mapped to the KEGG modules. BugBase,Citation37 an algorithm that can predict biologically interpretable phenotypes at the organism-level, was used to predict the phenotypic composition, including oxygen tolerance, Gram staining, and pathogenic potential, using high-quality 16S rRNA gene.
Enterotype analysis
In this work, the R package ‘BiotypeR’ (version: 0.1.3) was used to investigate whether the 306 samples were stratified into enterotypes. The Jensen–Shannon (JS) distance among samples was calculated based on the genus level composition of the 306 fecal samples. The enterotype of each fecal sample was analyzed by the PAM method using the relative abundance of genera in each community.Citation68 Silhouette index, as previously described, was applied to select the optimal number of clusters.Citation69,Citation70
Biomarker analysis
Linear discriminate analysis (LDA) effect size (LEfSe)Citation71 was used to identify differentially abundant features, and to evaluate the statistical significance of biomarkers, among the YN, AE and YE cohorts. Specifically, the p value for the factorial Kruskal−Wallis testCitation72 among groups was set at 0.05. The threshold for the logarithmic LDA score for discriminative features was set at 3.5.
Correlation and network analyses among significant dominant genera
Firstly, the genera with a significant difference between the YN and AE groups, between the YN and YE groups, or between the AE and YE groups, were identified. Secondly, dominant genera with at least 2-fold change between the AE and YN groups, or between the YE and YN cohorts, were identified from the significantly different genera. Thirdly, correlations between significant dominant genera were calculated with the SparCC algorithm.Citation73 The cutoff for the absolute correlation was set at 0.3 and only significant correlations with p values < .05 were included in downstream analysis. The genus-genus co-occurrence network was visualized with Cytoscape (version: 3.6.1).
Statistical analysis
Statistical analysis was conducted mainly using the R platform (http://www.r-project.org/). Based on the Shannon and Simpson indices, the alpha diversity was compared among groups by the Kruskal−Wallis test. PERMANOVACitation74 was performed on the Bray−Curtis distance matrix to evaluate whether the gut microbiota structure was significantly different across the groups. LDA, a supervised learning approach that utilizes a linear combination of features, such as taxon and functions, was applied to maximize the separation of groups. Random forest model using tenfold cross-validation and repeating for 50 times was built with the “caret” package in R. We calculated the Spearman correlation between dominant microbiota (>0.1%) and abundant functional composition (>0.15%) to explore their relationship. We calculated the Spearman correlation between environmental factors (including dietary factors, physical characteristics and sport-related features, Table S3) and the taxonomical composition at genus level (>0.05%), which were classified into five phyla. The p value and Spearman correlation coefficient cutoffs were set at 0.05 and 0.6, respectively. We visualized the Spearman correlation between different features and different genera with OmicCircos.Citation75 Depending on the contribution, p value and adjusted p value of each feature with the interactive forward selection function of Canoco software (version: 5.0)Citation76 to eliminate collinearity between factors,Citation52 we selected five important features, namely intermediate cell, erythrocyte, staple food, vegetables, and the time of closing one’s eyes while standing on left foot, to determine the effect induced by factors on the microbial community using the ‘varpart’ function of the ‘vegan’ package in the R environment.Citation77,Citation78
Authors’ contributions
This study was designed by KN, QWL and SW. KY and MZH collected the samples. MZH, PSY, CFZ and CYC analyzed the data. MZH and KN wrote the initial draft of the manuscript. All authors revised the manuscript.
Declaration of interests
The authors declare no competing financial interests.
Supplemental Material
Download Zip (1.8 MB)Supplementary material
Supplemental data for this article can be accessed on the publisher’s website.
Additional information
Funding
References
- Glasner ME. Finding enzymes in the gut metagenome. Science. 2017;355:577–578. doi:10.1126/science.aam7446.
- Qin J, Li R, Raes J, Arumugam M, Burgdorf KS, Manichanh C, Nielsen T, Pons N, Levenez F, Yamada T, et al. A human gut microbial gene catalogue established by metagenomic sequencing. Nature. 2010;464:59–65. doi:10.1038/nature08821.
- McKenna P, Hoffmann C, Minkah N, Aye PP, Lackner A, Liu Z, Lozupone CA, Hamady M, Knight R, Bushman FD, et al. The macaque gut microbiome in health, lentiviral infection, and chronic enterocolitis. PLoS Pathog. 2008;4:e20. doi:10.1371/journal.ppat.0040020.
- Clemente JC, Ursell LK, Parfrey LW, Knight R. The impact of the gut microbiota on human health: an integrative view. Cell. 2012;148:1258–1270. doi:10.1016/j.cell.2012.01.035.
- Hooper LV, Littman DR, Macpherson AJ. Interactions between the microbiota and the immune system. Science. 2012;336:1268–1273. doi:10.1126/science.1223490.
- Sharon G, Sampson TR, Geschwind DH, Mazmanian SK. The central nervous system and the gut microbiome. Cell. 2016;167:915–932. doi:10.1016/j.cell.2016.10.027.
- Spor A, Koren O, Ley R. Unravelling the effects of the environment and host genotype on the gut microbiome. Nat Rev Microbiol. 2011;9:279. doi:10.1038/nrmicro2540.
- Clarke SF, Murphy EF, O’sullivan O, Lucey AJ, Humphreys M, Hogan A, Hayes P, O’Reilly M, Jeffery IB, Wood-Martin R, et al. Exercise and associated dietary extremes impact on gut microbial diversity. Gut. 2014;63(12):1838–1839. doi:10.1136/gutjnl-2013-306541.
- Buford TW. (Dis) trust your gut: the gut microbiome in age-related inflammation, health, and disease. Microbiome. 2017;5:80. doi:10.1186/s40168-017-0296-0.
- Ayeni FA, Biagi E, Rampelli S, Fiori J, Soverini M, Audu HJ, Cristino S, Caporali L, Schnorr SL, Carelli V, et al. Infant and adult gut microbiome and metabolome in rural bassa and urban settlers from Nigeria. Cell Rep. 2018;23:3056–3067. doi:10.1016/j.celrep.2018.05.018.
- Nagpal R, Mainali R, Ahmadi S, Wang S, Singh R, Kavanagh K, Kitzman DW, Kushugulova A, Marotta F, Yadav H. Gut microbiome and aging: physiological and mechanistic insights. Nutr Healthy Aging. 2018;4:267–285.
- Fujisaka S, Avila-Pacheco J, Soto M, Kostic A, Dreyfuss JM, Pan H, Ussar S, Altindis E, Li N, Bry L, et al. Diet, genetics, and the gut microbiome drive dynamic changes in plasma metabolites. Cell Rep. 2018;22(11):3072–3086. doi:10.1016/j.celrep.2018.02.060.
- Hicks AL, Lee KJ, Couto-Rodriguez M, Patel J, Sinha R, Guo C, Olson SH, Seimon A, Seimon TA, Ondzie AU, et al. Gut microbiomes of wild great apes fluctuate seasonally in response to diet. Nat Commun. 2018;9(1):1786. doi:10.1038/s41467-018-04204-w.
- Yassour M, Vatanen T, Siljander H, Hämäläinen A-M, Härkönen T, Ryhänen SJ, Franzosa EA, Vlamakis H, Huttenhower C, Gevers D, et al. Natural history of the infant gut microbiome and impact of antibiotic treatment on bacterial strain diversity and stability. Sci Transl Med. 2016;8:343ra81–ra81. doi:10.1126/scitranslmed.aad0917.
- Petersen LM, Bautista EJ, Nguyen H, Hanson BM, Chen L, Lek SH, Sodergren E, Weinstock GM. Community characteristics of the gut microbiomes of competitive cyclists. Microbiome. 2017;5(1):98. doi:10.1186/s40168-017-0320-4.
- Barton W, Penney NC, Cronin O, Garcia-Perez I, Molloy MG, Holmes E, Shanahan F, Cotter PD, O’Sullivan O. The microbiome of professional athletes differs from that of more sedentary subjects in composition and particularly at the functional metabolic level. Gut. 2018;67:625–633.
- Morgan JA, Corrigan F, Baune BT. Effects of physical exercise on central nervous system functions: a review of brain region specific adaptations. J Mol Psychiatry. 2015;3:3. doi:10.1186/s40303-015-0010-8.
- Hackney AC. Stress and the neuroendocrine system: the role of exercise as a stressor and modifier of stress. Expert Rev Endocrinol Metab. 2006;1:783–792. doi:10.1586/17446651.1.6.783.
- Clark A, Mach N. Exercise-induced stress behavior, gut-microbiota-brain axis and diet: a systematic review for athletes. J Int Sports Nutr. 2016;13:43. doi:10.1186/s12970-016-0155-6.
- Freitas CG, Aoki MS, Franciscon CA, Arruda AF, Carling C, Moreira A. Psychophysiological responses to overloading and tapering phases in elite young soccer players. Pediatr Exerc Sci. 2014;26:195–202. doi:10.1123/pes.2013-0094.
- Zamanian F, Haghighi M, Forouzandeh E, Sedighi Z, Salehian MH. A comparison of emotional intelligence in elite student athletes and non-athletes. Ann Biol Res. 2011;2:179–183.
- Clarke G, Stilling RM, Kennedy PJ, Stanton C, Cryan JF, Dinan TG. Minireview: gut microbiota: the neglected endocrine organ. Mol Endocrinol. 2014;28:1221–1238. doi:10.1210/me.2014-1108.
- Moloney RD, Desbonnet L, Clarke G, Dinan TG, Cryan JF. The microbiome: stress, health and disease. Mamm Genome. 2014;25:49–74.
- Holzer P, Farzi A. Neuropeptides and the microbiota-gut-brain axis. Adv Exp Med Biol. 2014;817:195–219.
- Neish AS. Mucosal immunity and the microbiome. Ann Am Thorac Soc. 2014;11:S28–S32. doi:10.1513/AnnalsATS.201306-161MG.
- Stilling RM, Dinan TG, Cryan JF. Microbial genes, brain & behaviour–epigenetic regulation of the gut–brain axis. Genes Brain Behav. 2014;13:69–86.
- Redondo Useros N, Gheorghe A, Serrano Labajos R, Nova Rebato E, Marcos Sanchez A. HYDRAGUT study: influence of HYDRAtion status on the GUT microbiota and their impact on the immune system. Faseb J. 2015;29:593.1.
- Kulecka M, Fraczek B, Mikula M, Zeber-Lubecka N, Karczmarski J, Paziewska A, Ambrozkiewicz F, Jagusztyn-Krynicka K, Cieszczyk P, Ostrowski J. The composition and richness of the gut microbiota differentiate the top Polish endurance athletes from sedentary controls. Gut Microbes. 2020;11(5):1374–1384. doi:10.1080/19490976.2020.1758009.
- Choi JJ, Eum SY, Rampersaud E, Daunert S, Abreu MT, Toborek M. Exercise attenuates PCB-induced changes in the mouse gut microbiome. Environ Health Perspect. 2013;121:725. doi:10.1289/ehp.1306534.
- Zhang J, Guo Z, Xue Z, Sun Z, Zhang M, Wang L, Wang G, Wang F, Xu J, Cao H, et al. A phylo-functional core of gut microbiota in healthy young Chinese cohorts across lifestyles, geography and ethnicities. ISME J. 2015;9(9):1979–1990. doi:10.1038/ismej.2015.11.
- Liu H, Han M, Li SC, Tan G, Sun S, Hu Z, Yang P, Wang R, Liu Y, Chen F, et al. Resilience of human gut microbial communities for the long stay with multiple dietary shifts. Gut. 2019;68(12):2254–2255. doi:10.1136/gutjnl-2018-317298.
- Fernandes J, Su W, Rahat-Rozenbloom S, Wolever T, Comelli E. Adiposity, gut microbiota and faecal short chain fatty acids are linked in adult humans. Nutr Diabetes. 2014;4:e121. doi:10.1038/nutd.2014.23.
- Mariat D, Firmesse O, Levenez F, Guimarăes V, Sokol H, Doré J, Corthier G, Furet J-P. The firmicutes/bacteroidetes ratio of the human microbiota changes with age. BMC Microbiol. 2009;9(1):123. doi:10.1186/1471-2180-9-123.
- Rahat-Rozenbloom S, Fernandes J, Gloor GB, Wolever TM. Evidence for greater production of colonic short-chain fatty acids in overweight than lean humans. Int J Obes (Lond). 2014;38:1525–1531. doi:10.1038/ijo.2014.46.
- Yamamura R, Nakamura K, Kitada N, Aizawa T, Shimizu Y, Nakamura K, Ayabe T, Kimura T, Tamakoshi A. Associations of gut microbiota, dietary intake, and serum short-chain fatty acids with fecal short-chain fatty acids. Biosci Microbiota Food Health. 2019;39:11–17. doi:10.12938/bmfh.19-010.
- Durk RP, Castillo E, Márquez-Magaña L, Grosicki GJ, Bolter ND, Lee CM, Bagley JR. Gut microbiota composition is related to cardiorespiratory fitness in healthy young adults. Int J Sport Nutr Exerc Metab. 2019;29:249–253. doi:10.1123/ijsnem.2018-0024.
- Ward T, Larson J, Meulemans J, Hillmann B, Lynch J, Sidiropoulos D, Spear JR, Caporaso G, Blekhman R, Knight R, Fink R. BugBase predicts organism level microbiome phenotypes. BioRxiv. 2017:133462.
- Qiao Y, Sun J, Ding Y, Le G, Shi Y. Alterations of the gut microbiota in high-fat diet mice is strongly linked to oxidative stress. Appl Microbiol Biotechnol. 2013;97:1689–1697. doi:10.1007/s00253-012-4323-6.
- Houstis N, Rosen ED, Lander ES. Reactive oxygen species have a causal role in multiple forms of insulin resistance. Nature. 2006;440:944. doi:10.1038/nature04634.
- Wellen KE, Fucho R, Gregor MF, Furuhashi M, Morgan C, Lindstad T, Vaillancourt E, Gorgun CZ, Saatcioglu F, Hotamisligil GS. Coordinated regulation of nutrient and inflammatory responses by STAMP2 is essential for metabolic homeostasis. Cell. 2007;129(3):537–548. doi:10.1016/j.cell.2007.02.049.
- Mach N, Fuster-Botella D. Endurance exercise and gut microbiota: a review. J Sport Health Sci. 2017;6:179–197. doi:10.1016/j.jshs.2016.05.001.
- Murtaza N, Burke LM, Vlahovich N, Charlesson B, O’Neill HM, Ross ML, Campbell K, Krause L, Morrison M. Analysis of the effects of dietary pattern on the oral microbiome of elite endurance athletes. Nutrients. 2019;11:614. doi:10.3390/nu11030614.
- Yu Y, Mao G, Wang J, Zhu L, Lv X, Tong Q, Fang Y, Lv Y, Wang G. Gut dysbiosis is associated with the reduced exercise capacity of elderly patients with hypertension. Hypertens Res. 2018;41(12):1036–1044. doi:10.1038/s41440-018-0110-9.
- Watterson KR, Hudson BD, Ulven T, Milligan G. Treatment of type 2 diabetes by free fatty acid receptor agonists. Front Endocrinol. 2014;5:137. doi:10.3389/fendo.2014.00137.
- Tan J, McKenzie C, Potamitis M, Thorburn AN, Mackay CR, Macia L. The role of short-chain fatty acids in health and disease. Adv Immunol. 2014;121:91–119.
- Yatsunenko T, Rey FE, Manary MJ, Trehan I, Dominguez-Bello MG, Contreras M, Magris M, Hidalgo G, Baldassano RN, Anokhin AP. Human gut microbiome viewed across age and geography. Nature. 2012;486:222–227. doi:10.1038/nature11053.
- Allen JM, Mailing LJ, Niemiro GM, Moore R, Cook MD, White BA, Holscher HD, Woods JA. Exercise alters gut microbiota composition and function in lean and obese humans. Med Sci Sports Exerc. 2018;50(4):747–757. doi:10.1249/MSS.0000000000001495.
- Breyner NM, Michon C, de Sousa CS, Vilas Boas PB, Chain F, Azevedo VA, Langella P, Chatel JM. Microbial anti-inflammatory molecule (MAM) from faecalibacterium prausnitzii shows a protective effect on DNBS and DSS-induced colitis model in mice through inhibition of NF-kappaB pathway. Front Microbiol. 2017;8:114.
- Singh RK, Chang HW, Yan D, Lee KM, Ucmak D, Wong K, Abrouk M, Farahnik B, Nakamura M, Zhu TH. Influence of diet on the gut microbiome and implications for human health. J Transl Med. 2017;15:73. doi:10.1186/s12967-017-1175-y.
- Azad MB, Vehling L, Chan D, Klopp A, Nickel NC, McGavock JM, Becker AB, Mandhane PJ, Turvey SE, Moraes TJ, et al. Infant feeding and weight gain: separating breast milk from breastfeeding and formula from food. Pediatrics. 2018;142:e20181092. doi:10.1542/peds.2018-1092.
- Cresci GA, Bawden E. Gut microbiome: what we do and don’t know. Nutr Clin Pract. 2015;30:734–746. doi:10.1177/0884533615609899.
- Magalhaes MF, Batalha DC, Collares-Pereira MJ. Gradients in stream fish assemblages across a Mediterranean landscape: contributions of environmental factors and spatial structure. Freshwater Biol. 2002;47:1015–1031. doi:10.1046/j.1365-2427.2002.00830.x.
- Hirschberg AL. Sex hormones, appetite and eating behaviour in women. Maturitas. 2012;71:248–256. doi:10.1016/j.maturitas.2011.12.016.
- Copeland JL, Consitt LA, Tremblay MS. Hormonal responses to endurance and resistance exercise in females aged 19–69 years. J Gerontol A Biol Sci Med Sci. 2002;57:B158–B65. doi:10.1093/gerona/57.4.B158.
- Kraemer WJ, Rogol AD. The endocrine system in sports and exercise. Hoboken, New Jersey: Wiley Online Library; 2005. p. 110–121.
- Bertelloni S, Ruggeri S, Baroncelli GI. Effects of sports training in adolescence on growth, puberty and bone health. Gynecol Endocrinol. 2006;22:605–612. doi:10.1080/09513590601005730.
- Piepiora P, Superson M, Witkowski K. Personality and the body composition of athletes using the example of the Polish national youth female wrestling team. J Combat Sports Martial Art. 2017;8(2):107–109.
- Haslacher H, Ratzinger F, Perkmann T, Batmyagmar D, Nistler S, Scherzer TM, Ponocny-Seliger E, Pilger A, Gerner M, Scheichenberger V, et al. A combination of routine blood analytes predicts fitness decrement in elderly endurance athletes. PLos One. 2017;12(5):e0177174. doi:10.1371/journal.pone.0177174.
- Yuktasir B. Warm-up: a case study on maximal oxygen consumption as it relates to acute stretching. J Hum Kinet. 2008;19:165–176. doi:10.2478/v10078-008-0013-y.
- Capodaglio P, Capodaglio Edda M, Facioli M, Saibene F. Long-term strength training for community-dwelling people over 75: impact on muscle function, functional ability and life style. Eur J Appl Physiol. 2007;100:535–542. doi:10.1007/s00421-006-0195-8.
- Schloss PD, Westcott SL, Ryabin T, Hall JR, Hartmann M, Hollister EB, Lesniewski RA, Oakley BB, Parks DH, Robinson CJ, et al. Introducing mothur: open-source, platform-independent, community-supported software for describing and comparing microbial communities. Appl Environ Microbiol. 2009;75:7537–7541. doi:10.1128/AEM.01541-09.
- Quast C, Pruesse E, Yilmaz P, Gerken J, Schweer T, Yarza P, Peplies J, Glöckner FO. The SILVA ribosomal RNA gene database project: improved data processing and web-based tools. Nucleic Acids Res. 2013;41:590–596. doi:10.1093/nar/gks1219.
- Caporaso JG, Kuczynski J, Stombaugh J, Bittinger K, Bushman FD, Costello EK, Fierer N, Peña AG, Goodrich JK, Gordon JI, et al. QIIME allows analysis of high-throughput community sequencing data. Nat Methods. 2010;7(5):335–336. doi:10.1038/nmeth.f.303.
- DeSantis TZ, Hugenholtz P, Larsen N, Rojas M, Brodie EL, Keller K, Huber T, Dalevi D, Hu P, Andersen GL, et al. Greengenes, a chimera-checked 16S rRNA gene database and workbench compatible with ARB. Appl Environ Microbiol. 2006;72(7):5069–5072. doi:10.1128/AEM.03006-05.
- Lozupone C, Knight R. UniFrac: a new phylogenetic method for comparing microbial communities. Appl Environ Microbiol. 2005;71:8228–8235. doi:10.1128/AEM.71.12.8228-8235.2005.
- Langille MG, Zaneveld J, Caporaso JG, McDonald D, Knights D, Reyes JA, Clemente JC, Burkepile DE, Thurber RL, Knight R, et al. Predictive functional profiling of microbial communities using 16S rRNA marker gene sequences. Nat Biotechnol. 2013;31:814–821. doi:10.1038/nbt.2676.
- Kang C, Zhang Y, Zhu X, Liu K, Wang X, Chen M, Chen H, Hui S, Huang L, Zhang Q. Healthy subjects differentially respond to dietary capsaicin correlating with specific gut enterotypes. J Clin Endocrinol Metab. 2016;101:4681–4689. doi:10.1210/jc.2016-2786.
- Arumugam M, Raes J, Pelletier E, Le Paslier D, Yamada T, Mende DR, Fernandes GR, Tap J, Bruls T, Batto J-M, et al. Enterotypes of the human gut microbiome. Nature. 2011;473(7346):174–180. doi:10.1038/nature09944.
- Li J, Zhao F, Wang Y, Chen J, Tao J, Tian G, Wu S, Liu W, Cui Q, Geng B, et al. Gut microbiota dysbiosis contributes to the development of hypertension. Microbiome. 2017;5(1):14. doi:10.1186/s40168-016-0222-x.
- Lim MY, Rho M, Song Y-M, Lee K, Sung J, Ko G. Stability of gut enterotypes in Korean monozygotic twins and their association with biomarkers and diet. Sci Rep. 2014;4:7348.
- Segata N, Izard J, Waldron L, Gevers D, Miropolsky L, Garrett WS, Huttenhower C. Metagenomic biomarker discovery and explanation. Genome Biol. 2011;12(6):R60. doi:10.1186/gb-2011-12-6-r60.
- Breslow N. A generalized Kruskal-Wallis test for comparing K samples subject to unequal patterns of censorship. Biometrika. 1970;57:579–594. doi:10.1093/biomet/57.3.579.
- Friedman J, Alm EJ. Inferring correlation networks from genomic survey data. PLoS Comput Biol. 2012;8:e1002687. doi:10.1371/journal.pcbi.1002687.
- Anderson MJ. A new method for non‐parametric multivariate analysis of variance. Aust Ecol. 2001;26:32–46.
- Hu Y, Yan C, Hsu C-H, Chen Q-R, Niu K, Komatsoulis GA, Meerzaman D. OmicCircos: a simple-to-use R package for the circular visualization of multidimensional omics data. Cancer Inform. 2014;13(CIN):S13495. doi:10.4137/CIN.S13495.
- Šmilauer P, Lepš J. Multivariate analysis of ecological data using CANOCO 5. Cambridge: Cambridge University Press; 2014.
- Peres-Neto PR, Legendre P, Dray S, Borcard D. Variation partitioning of species data matrices: estimation and comparison of fractions. Ecology. 2006;87:2614–2625.
- Falony G, Joossens M, Vieira-Silva S, Wang J, Darzi Y, Faust K, Kurilshikov A, Bonder MJ, Valles-Colomer M, Vandeputte D. Population-level analysis of gut microbiome variation. Science. 2016;352:560–564. doi:10.1126/science.aad3503.