
ABSTRACT
Dietary fiber supplements are a strategy to close the ‘fiber gap’ and induce targeted modulations of the gut microbiota. However, higher doses of fiber supplements cause gastrointestinal (GI) symptoms that differ among individuals. What determines these inter-individual differences is insufficiently understood. Here we analyzed findings from a six-week randomized controlled trial that evaluated GI symptoms to corn bran arabinoxylan (AX; n = 15) relative to non-fermentable microcrystalline cellulose (MCC; n = 16) at efficacious supplement doses of 25 g/day (females) or 35 g/day (males) in adults with excess weight. Self-reported flatulence, bloating, and stomach aches were evaluated weekly. Bacterial taxa involved in AX fermentation were identified by bioorthogonal non-canonical amino acid tagging. Associations between GI symptoms, fecal microbiota features, and diet history were systematically investigated. AX supplementation increased symptoms during the first three weeks relative to MCC (p < 0.05, Mann-Whitney tests), but subjects ‘adapted’ with symptoms reverting to baseline levels toward the end of treatment. Symptom adaptations were individualized and correlated with the relative abundance of Bifidobacterium longum at baseline (rs = 0.74, p = 0.002), within the bacterial community that utilized AX (rs = 0.69, p = 0.006), and AX-induced shifts in acetate (rs = 0.54, p = 0.039). Lower baseline consumption of animal-based foods and higher whole grains associated with less severity and better adaptation. These findings suggest that humans do ‘adapt’ to tolerate efficacious fiber doses, and this process is linked to their microbiome and dietary factors known to interact with gut microbes, providing a basis for the development of strategies for improved tolerance of dietary fibers.
Introduction
Dietary fiber is an important dietary component for the prevention of chronic diseasesCitation1,Citation2 and to ensure gut microbiome diversity and metabolic functionality.Citation3 Governmental and nutritional organizations encourage consumption of fiber-rich whole foods to achieve recommended intakes of 25–38 g/day.Citation4–6 However, fiber intake in socioeconomically developed societies has remained at only half of what is recommended,Citation5,Citation7 resulting in a ‘fiber gap’.Citation4 We and others have argued that the fiber gap might be even larger in light of the amounts of dietary fiber consumed throughout most of human evolution, which is likely to have led to adaptations in human physiology and host-microbiome symbiosis to elevated levels of fiber.Citation8–10 Thus, suggestions have been made that higher doses of dietary fiber may be necessary for consistent health benefits,Citation3,Citation11 a notion supported by systematic reviews and meta-analyses.Citation1,Citation12,Citation13 Dietary fibers also offer exciting prospects for selective, targeted, and personalized modulations of gut microbiota composition and metabolic functions relevant to health,Citation14–17, but physiologically relevant changes to the gut microbiome require higher doses.Citation18,Citation19 Purified fibers can be used in foods or as supplements to close the fiber gap,Citation8,Citation10,Citation20 but it remains unknown whether modern humans would tolerate ancestral amounts of fiber. Even amounts required for consistent health benefits and/or to induce physiologically relevant changes to the gut microbiota induce symptoms in a subset of humans.Citation18
Dietary fibers remain largely intact until they reach the colon where, dependent on chemical structure, some of them undergo fermentation by the microbiota. This process results in the formation of short-chain fatty acids (SCFAs) and other organic acids that acidify the colonic environment,Citation2,Citation21 as well as gases such as H2, CO2, and CH4.Citation22,Citation23 Elevated colonic gas production leads to flatulence and increased intestinal wall tension by raising intraluminal pressures, triggering the perception of bloating, abdominal discomfort, and related symptoms via colonic mechanoreceptor simulation.Citation24,Citation25 The magnitude of symptoms is dependent on dietary fiber molecular size and structure. Larger, more complex fiber molecules, such as resistant starches, acacia gum, and arabinoxylans (AXs; a cereal derived fiberCitation26), are fermented slower by fecal microbiota relative to inulin and resistant oligosaccharide molecules,Citation27–31 which are less well tolerated.Citation32,Citation33 Accordingly, doses of resistant starch, resistant maltodextrin, and acacia gum of around 40 g/day are comparatively well tolerated.Citation19,Citation34,Citation35 To our knowledge, effects of long-chain AXs on gastrointestinal (GI) symptoms have not been assessed beyond 15 g/day,Citation36 and limited knowledge exists on how GI symptoms are linked to the gut microbiome.
Although symptoms can deter individuals from consuming fiber-rich foods, there is some evidence that suggests that humans can, at least to some degree, ‘adapt’ to sustained fiber consumption at high quantities, a process proposed to involve the gut microbiota.Citation37 For instance, previous studies supplementing with acacia gum,Citation38 partially hydrolyzed guar gum,Citation39 inulin,Citation40 resistant maltodextrin,Citation41 and a blend of inulin and resistant maltodextrinCitation42 have observed reductions in symptoms within two to four weeks of treatment. In addition, Mego and colleagues have shown that self-reported flatulence and number of gas evacuations decreased within two weeks of galactooligosaccharide treatment,Citation37 with improvements stemming predominantly from reductions in the volume of intestinal gas produced.Citation43 However, the dose of this study was, with 2.8 g/day, lower than what might be required for physiological and maximum bifidogenic effects.Citation44,Citation45 Therefore, whether humans can adapt to higher, more relevant supplementation doses and the factors that determine these responses (e.g., the gut microbiota), remains insufficiently understood.
In previous studies, we have tested the effects of long-chain corn bran AX at daily doses of 25 and 35 grams (for women and men, respectively) on healthCitation46 and the gut microbiotaCitation47 using an exploratory randomized controlled trial (RCT) in adults with excess weight (BMI: 25–35 kg/m2). These studies revealed that AX exerted global changes on fecal bacterial community composition; promoted a range of bacterial taxa such as Bifidobacterium longum, Blautia obeum, Subdoligranulum sp., and Prevotella copri; increased fecal propionate concentrations (albeit highly individualized);Citation47 and improved perceived satiety and measures of glucose homeostasis.Citation46 In the current study, we extended our previous work in adults with excess weight to evaluate the severity of GI symptoms during high-dose AX supplementation, determined to what degree humans adapted to tolerate AX, and explored whether gut microbiota features or dietary-related factors associate with interpersonal differences in AX tolerance.
Results
AX induced moderate yet significant GI symptoms in comparison to non-fermentable microcrystalline cellulose (MCC)
Thirty-eight volunteers with excess weight were enrolled in the study and instructed to supplement their diet, over six weeks, with either AX or MCC at a daily dose of 25 g (females) or 35 g (males); GI symptoms were reported at baseline, and weekly throughout the intervention ( and Supplementary Table S1). Although AX was on average well tolerated (average symptom scores were < 2 points), overall symptoms, flatulence, bloating, stomach ache, and composite ratings were significantly higher when compared to subjects consuming MCC (treatment effect p < 0.05, generalized estimated equation models; and Supplementary Figure S1A). Considerable collinearity was detected between AX-induced symptoms; for instance, flatulence positively correlated with bloating (rs = 0.55, p < 0.0001; Supplementary Figure S2). Comparison of maximum absolute change (MAX) severity scores (i.e., highest symptoms rating over entire treatment period) between AX and MCC treatments showed that flatulence, bloating, and composite ratings increased during AX consumption as compared to MCC (p < 0.05, Mann-Whitney tests; and Supplementary Figure S1B) (see Supplementary Figure S3A for explanation of severity scores). Accordingly, flatulence area under the curve severity (AUCseverity) scores (i.e., overall flatulence severity during the intervention) were higher for AX relative to MCC (p = 0.045), with differences in composite AUCseverity also approaching statistical significance (p < 0.1) ().
Figure 1. Study design.
Figure 2. Symptoms in response to AX consumption and adaptation toward AX as compared to MCC consumption.
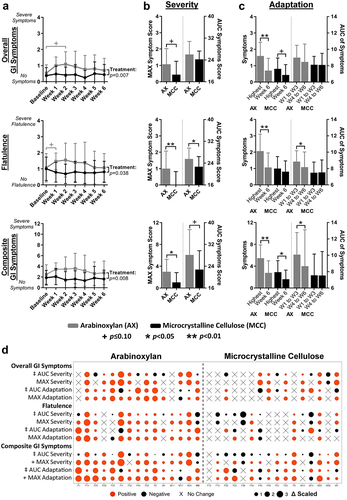
Subjects showed an ‘adaptation’ to AX in that symptoms declined over time
Symptoms ratings for flatulence, bloating, stomach ache, and composite scores improved during AX consumption, with ratings at week 6 being lower than MAX values and often close to baseline values (p < 0.05, Wilcoxon tests; and Supplementary Figure S1C) (see Supplementary Figure S3B for explanation of adaptation scores). Although minor and unrelated to microbial fermentation, significant improvements in composite ratings were also detected at six weeks of MCC consumption relative to MAX composite values (p = 0.01; ). In addition to MAX shifts, AUCs of weeks 1 to 3 were significantly higher than those of weeks 4 to 6 for both flatulence (p = 0.02) and composite scores (p = 0.02) during AX but not MCC consumption (). These findings suggest that although corn bran AX, at doses of 25 g/day and 35 g/day, induced symptoms and primarily flatulence, effects were temporary, as most subjects ‘adapted’ to AX within six weeks of sustained consumption.
Inter-individualized variation in symptoms is linked to fecal microbiota composition
Although significant increases in GI symptoms were detected in the study cohort, symptom severity and the degree of adaptation were highly individualized ( and Supplementary Figure S1D). MAX composite severity scores were increased by ≤ 2 out of 12 points for 40% of subjects, while 33% reported scores ≥ 4. For most individuals (80%), composite ratings reverted to baseline, as MAX composite severity and adaptation scores were equivalent (i.e., difference of ≤ 1 point). However, for the two subjects that reported the most intense symptoms, symptoms did not recover completely (i.e., F4 reduced from 10 to 6 points; M24 reduced from 9 to 6 points).
Symptoms linked to increased fiber consumption such as flatulence and bloating are likely the result of gas formation during fermentation by the gut microbiota,Citation22,Citation23 which shows substantial inter-individual variation.Citation48–50 We therefore performed a systematic analysis between the AUCseverity of GI symptoms during AX and MCC supplementation and the relative abundance of bacterial taxa at different taxonomic levels. Spearman’s correlation analyses also included co-abundance response groups (CARGs), which are groups of inter-correlated operational taxonomic units (OTUs),Citation47 since bacteria collaborate during fiber fermentation and engage in complex cross-feeding interactions within what can be considered ecological guilds.Citation51 As fecal samples were collected in weeks 1 and 6, AUCseverity ratings from weeks 1 to 3 were correlated with measurements in week 1 samples, and AUCseverity ratings from weeks 4 to 6 were correlated with measurements in week 6 samples.
This analysis showed that neither α-diversity, assessed by Shannon index, nor the total number of OTUs was associated with severity ratings for AX (p>0.01; ). The analysis at phylum-level revealed that, during AX consumption, the abundance of Actinobacteria negatively correlated with composite (rs = -0.53, p = 0.003) and bloating (rs = -0.53, p = 0.003) severity, while Bacteroidetes positively correlated with bloating severity (rs = 0.53, p = 0.002) (). At lower taxonomic levels, the family Bifidobacteriaceae (rs = -0.52, p = 0.003; ) and genus Bifidobacterium (rs = -0.52, p = 0.003; ) negatively correlated with composite severity, while negative correlations with both bloating and stomach ache severity approached statistical significance (p < 0.05). In contrast, positive correlations were detected between the family Porphyromonadaceae and composite (rs = 0.52, p = 0.003) and bloating (rs = 0.50, p = 0.005) severity; with Oscillibacter, Parabacteroides, and Odoribacter genera also showing positive correlations with composite severity that approached statistical significance (p < 0.05).
Figure 3. Associations between symptom severity and bacterial abundance during AX and MCC consumption.
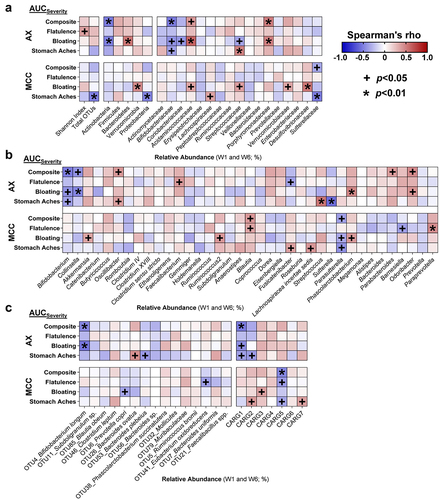
For OTUs and CARGs, analyses were focused on only AX-responsive OTUs (termed ‘significant OTUs’Citation47) to avoid type-1 error, while all seven CARGs were included. This analysis revealed that the relative abundance of B. longum (OTU4) during AX consumption negatively correlated with composite (rs = -0.48, p = 0.007) and bloating (rs = -0.54, p = 0.002) severity (). The relative abundance of CARG1 – the CARG dominated by B. longumCitation47 (Supplementary Figure S4) – was also shown to negatively correlate with composite severity (rs = -0.53, p = 0.003), while negative correlations for both bloating and stomach ache severity approached statistical significance (p < 0.05). The above-mentioned correlations were not detected during MCC consumption (p > 0.1; ), which might indicate that these associations are related to symptoms induced by AX fermentation. Overall, these findings suggest that higher abundance of B. longum during AX supplementation designates better GI tolerance, while higher Porphyromonadaceae designates worse GI tolerance.
Severity and adaptation scores correlate with baseline and AX-Induced shifts in microbiota composition
To evaluate if the tolerance of AX is pre-determined by the baseline microbiota, we assessed whether MAX and AUC severity and adaptation scores associated with relative pre-treatment abundances of the significant OTUs and CARGs. This analysis revealed that greater relative abundances of B. longum (OTU4; rs = -0.67, p = 0.007) and CARG1 (rs = -0.67, p = 0.008) prior to AX supplementation associated with lower bloating AUCseverity scores (Supplementary Figure S5), with composite AUCseverity also showing a tendency to be lower (p < 0.05; ). Relative pre-treatment abundances of B. longum (OTU4; rs = 0.74, p = 0.002) and CARG1 (rs = 0.77, p = 0.001) were also positively associated with better composite AUCadaptation scores.
Figure 4. Improved composite scores during AX consumption were linked to the relative abundance of Bifidobacterium longum.
Next, we determined whether AX-induced shifts (week 6 – baseline) of significant OTUs and CARGs correlated with severity and adaptation scores. While associations were not detected for B. longum (OTU4) or CARG1 (p > 0.05; ), enrichment of Subdoligranulum sp. (OTU11) by AX was associated with higher composite AUCadaptation scores (rs = 0.68, p = 0.007), with bloating and stomach ache AUCadaptation scores also showing a tendency to be higher (p < 0.05) (Supplementary Figure S6).
Finally, we applied bioorthogonal non-canonical amino acid-tagging (BONCAT) to identify the bacterial consortia within the fecal microbiota of the subjects that are involved in the fermentation of AX,Citation46 and then assessed associations between the activated bacterial amplicon sequence variants (ASVs) and MAX and AUC severity and adaptation scores. This analysis revealed that only the relative abundance of B. longum (ASVic9×vj), within the active consortia, positively associated with composite (rs = 0.69, p = 0.006; ) and bloating (rs = 0.68, p = 0.006; Supplementary Figure S7) AUCadaptation scores. Taken together, the findings suggest that the adaptation to tolerate AX at high-doses is influenced more by the relative abundances of specific AX degrading microbes such as B. longum, than by AX-induced changes in community membership.
Tolerance to AX is associated with changes in fecal pH and SCFAs
Previously, we showed that AX increased fecal propionate (overall effect p = 0.015, Friedman’s test), while remaining SCFAs and fecal pH did not change (overall effect p > 0.1).Citation47 Given the substantial variation in these parameters, we asked whether inter-subject differences in severity and adaptation were linked to different shifts in fecal pH (week 6 – baseline). This analysis showed that fecal acidification was associated with both lower composite AUCseverity for AX (rs = 0.54, p = 0.039; ) and bloating AUCseverity for MCC (rs = 0.54, p = 0.034; ). Fecal acidification was also associated with greater abundances of B. longum (OTU4) during AX consumption (rs = -0.44, p = 0.016; Supplementary Figure S8A), a correlation that approached statistical significance for MCC (rs=-0.30, p = 0.093; Supplementary Figure S8B).
Figure 5. Shifts in fecal pH and SCFA concentrations correlated with the severity and adaptation of AX- and MCC-induced symptom.
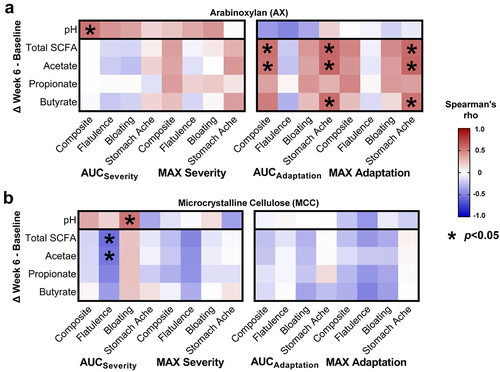
Analysis of fecal SCFA shifts further revealed positive correlations between composite AUCadaptation scores and total SCFAs (rs = 0.55, p = 0.036), and acetate (rs = 0.54, p = 0.039) (). Stomach ache AUCadaptation scores were also correlated positively with total SCFAs (rs = 0.60, p = 0.021), acetate (rs = 0.59, p = 0.022), and butyrate (rs = 0.57, p = 0.027). Although no associations were detected between pH and SCFA shifts (p > 0.1, data not shown), positive correlations that approached statistical significance were detected between acetate shifts and B. longum (OTU4) abundance during AX (rs = 0.33, p = 0.072; Supplementary Figure S8A) and MCC (rs = 0.30, p = 0.097; Supplementary Figure S8B) consumption. Overall, these findings suggest that the adaptation to tolerate AX is partially driven by inter-individual differences in microbial fermentation of AX and subsequent acidification of the colonic environment, primarily through acetate (the major SCFA produced by bifidobacteria).Citation52
Association between baseline diet and GI tolerance of AX and MCC
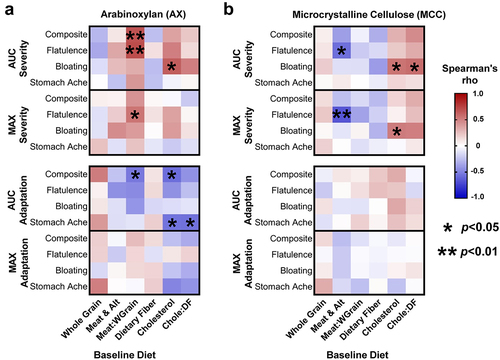
Previous research has shown that habitual intake of animal- vs. plant-based diets differentially affect gut microbiota composition and metabolic activity.Citation6–55 We therefore investigated whether pre-treatment, calorie-adjusted intake of meat/meat alternatives, whole grains (where AX is the dominant fiberCitation26), cholesterol (found only in animal-based foods), and dietary fiber, or the ratio between animal- and plant-based foods/nutrients were linked to MAX and AUC severity and adaptation scores.
This analysis revealed that, for AX, a higher proportion of meat/meat alternatives to whole grains in the subjects’ pre-treatment diet correlated positively with composite (rs = 0.68, p = 0.007) and flatulence (rs = 0.70, p = 0.005) AUCseverity scores, and negatively with composite AUCadaptation (rs = -0.54, p = 0.042) (). The ratio of meat/meat alternatives to whole grains was further shown to positively correlate with MAX flatulence severity (rs = 0.54, p = 0.04). Interestingly, for MCC, the calorie-adjusted intake of meat/meat alternatives also correlated inversely with flatulence MAX (rs = -0.67, p = 0.005) and AUC (rs=-0.57, p = 0.02) severity scores (). In terms of nutrients, higher intakes of cholesterol correlated positively with bloating AUCseverity for AX (rs = 0.63, p = 0.013) and MCC (rs = 0.54, p = 0.03). Negative associations were also observed between cholesterol intake and composite (rs = -0.58, p = 0.027) and stomach ache (rs = -0.55, p = 0.036) AUCadaptation scores for AX but not MCC (). Although no associations were detected between intakes of whole grains or meat/meat alternatives and the relative abundance of B. longum (OTU4) at baseline (p > 0.1), an inverse correlation that approached statistical significance was detected between intakes of cholesterol and baseline B. longum levels (rs = -0.35, p = 0.052; Supplementary Figure S9). In summary, habitual intake of more animal-based foods and less whole grains appears to elevate the perceived severity of GI symptoms and lessen symptom improvements during AX supplementation.
Figure 6. Baseline diet history correlated with symptom severity and adaptation during AX and MCC consumption.
Discussion
In agreement with findings from human trials with other fermentable fibers,Citation24,Citation32,Citation33 consumption of corn bran AX at high doses of 25 g/day (females) or 35 g/day (males) intensified GI symptoms. After higher symptoms within the first three weeks of supplementation, ratings reverting almost completely back to baseline levels during weeks 4 to 6. This observation is relevant as it indicates that humans can adapt to high amounts of AX within a relatively short time frame. Severity and adaptation responses were both subject-dependent and correlated with gut microbiota composition, fecal acidification, and baseline diet. These correlations provide potential explanations for the inter-individualized variation in the adaptations toward tolerating dietary fibers, which can serve as a basis for the development of personalized microbiome-targeted or dietary strategies aimed to increase fiber consumption by alleviating fiber-induced symptoms.
Compared to many other fibers, AX is rather well tolerated. Inulin and resistant oligosaccharides appeared to induce symptoms at doses of ~10 g/day that are equivalent or higher than what we detected for 25–35 g/day of corn bran AX.Citation32,Citation33,Citation45,Citation56 Higher tolerance of corn bran AX might arise from its complex molecular structure.Citation47 Accordingly, in vitro fecal fermentation studies have demonstrated lower gas production rates by corn bran AX and hydrolyzates thereof relative to fructooligosaccharides and even AXs with more simple molecular structures (i.e., sorghum and rice AX).Citation27,Citation29,Citation31 Other complex fibers characterized by slow fermentation rates in vitro (e.g., resistant starch, acacia gum, and polydextroseCitation28,Citation30,Citation57) have also shown to be more tolerable at doses above 30 g/day.Citation18, Citation31 − Citation33,Citation47 Overall, the findings suggest that increased structural complexity attenuates the rate of fiber fermentation, which permits colonic absorption and evacuation of gases without colonic buildup, leading to improved tolerance.Citation23
Previous studies have suggested that symptoms of fiber consumption are predominantly influenced by the gut microbial community, affecting colonic gas production and the removal of H2.Citation37,Citation43,Citation58 While associations were not detected with putative hydrogenotrophic bacterial taxa in our study (i.e., acetogens, methanogens, and sulfate-reducing bacteria), Bifidobacterium abundance correlated with severity and adaptation of both bloating and composite symptoms. These correlations are in agreement with previous findings from a longitudinal study in healthy individuals, where higher Bifidobacterium abundance was inversely associated with abdominal pain and intestinal discomfort.Citation59 In addition, probiotic intervention trials showed that Bifidobacterium strains reduced bloating in irritable bowel syndrome.Citation60–62 Although cause and effect relationships and mechanisms cannot be established in our study, several aspects of the metabolism of Bifidobacterium provide a potential explanation for reduced gas production rates during AX fermentation. First, Bifidobacterium species are non-gas-producing.Citation52 Competition of B. longum for AX could therefore reduce net colonic gas production by other organisms. Second, Bifidobacterium produce lactate and acetate from carbohydrate fermentation,Citation52 which acidify the colonic environment. In general, acidification has been shown to lower the rate and net production of H2 during microbial fermentation of carbohydrates.Citation63 This mechanism is supported by the correlations between GI tolerance to AX and shifts in fecal pH and acetate (the dominant SCFA produced by bifidobacteria) in our study. Interestingly, associations were also detected with both ex vivo activity of AX-utilizing B. longum and CARG1, the dominate responding co-abundance cluster during AX consumption that encompassed six inter-correlated AX-responding OTUs, including B. longum and Subdoligranulum sp., which also produces lactate.Citation47,Citation64 Overall, correlations detected in our study suggest that severity and adaptation of AX-induced symptoms are to some degree determined by the bacterial consortia involved in AX degradation and specifically B. longum’s position within the active consortia.
We can only speculate about the mechanisms by which adaptation to AX occurs. One possibility is that bacteria within CARG1, for instance B. longum, adapt to become more efficient at utilizing AX. Cooperative cross-feeding interactions among members of CARG1, such as between B. longum (proposed primary degrader) and B. obeum or Subdoligranulum sp. (proposed secondary fermenters),Citation47 may also become more efficient. Previously, we have shown that while AX-induced shifts in gut microbiota composition manifested within one week without further changes, adaptation in the production of propionate was detected in 40% of subjects and predicted by CARG1 shifts.Citation47 Therefore, it is feasible that within six weeks, this bacterial consortium exhibits a functional adaptation toward reduced gas production during AX fermentation, improving symptoms perceived by the individual. However, other mechanisms are also possible; for instance, B. longum could mitigate the perception of visceral stimuli through upregulation of neurotransmitters, which would improve symptoms without altering gas production.Citation65 Therefore, future studies are needed that apply more sophisticated techniques – such as whole metagenomic, shotgun sequencing in combination with ingestible gas-sensing capsulesCitation22 – to evaluate adaptation.
Our correlation analyses between GI symptoms and diet indicate that habitual consumption of a diet higher in whole grains at the expense of animal-based foods enhances the tolerance of AX. Previous studies have suggested that long-term dietary habits play a role in shaping the composition and metabolic activity of the gut microbiota.Citation53,Citation55,Citation66 For instance, higher intakes of animal proteins and fats have been linked to greater relative abundances of the family Porphyromonadaceae and genera Odoribacter, Parabacteroides, and Bacteroides.Citation53 It is possible that dietary patterns rich in whole grains (which are rich in AXs) over time select for microbes that can adapt to more efficiently ferment these substrates, which might be linked to less H2 production during AX fermentation and explain the inter-individualized adaptations observed toward the tolerance of AX. Diets rich in animal products, on the other hand, might select for microbes that are less AX-adapted and produce more H2. These speculations would align with the inverse association between B. longum and dietary cholesterol that approached significance and the positive correlation observed between Porphyromonadaceae and composite AUCseverity, with positive correlations for Odoribacter and Parabacteroides approaching significance. Other groups have additionally reported positive associations between the genera Parabacteroides and Bacteroides and increased flatulence.Citation67,Citation68 Overall, these findings provide further support that the gut microbiota can adapt toward dietary fiber to attenuate GI symptoms and suggest that habitual diet might be an important factor in this process that contributes to personalized tolerance of fibers.
The findings obtained in this study are important for several reasons. First, our study showed that humans are capable of adapting to dietary fiber doses that modulate microbiota community composition and function (propionate)Citation47 and show clinical effects (satiety and insulin resistance).Citation46 Adaption appears to occur both short-term (during the AX intervention) and longer-term (through the habitual diet) and constitutes an avenue by which tolerance to physiologically relevant and perhaps even ancestral doses can be both achieved, making closing the fiber gap feasible. Second, even though the design of this study does not allow causal inferences between symptom adaptations and the gut microbiota, the associations observed, specifically with the abundance of B. longum and fecal acetate (the dominant SCFA produced by B. longum), point toward possible mechanisms by which tolerance arises. Further research is needed to elucidate the mechanisms that underly personalized adaptations toward the tolerance of physiologically relevant levels of fiber consumption. Third, this information provides a basis to use B. longum strains (and perhaps other members of CARG1) well adapted to competitively utilize AX as probiotics to enhance the tolerance of AX. However, a rigorously designed RCT would be needed to confirm whether this synergistic synbiotic strategy attenuates GI symptoms induced by AX, especially in those individuals experiencing more sever symptoms. Such an RCT would aid in inferring causality between GI tolerance and the gut microbiota. Finally, our findings suggest that microbiome benefits are adaptable and can therefore be altered through selection, opening options for evolutionary-based strategies to modulate the gut microbiome.
Materials and methods
Registration
As described previously,Citation46,Citation47 this six-week, exploratory RCT was registered with ClinicalTrials.gov, registry number NCT02322112, as part of a large four-arm RCT aimed to compare the effects of AX, acacia gum, resistant starch type-IV, and MCC consumption on the gut microbiota and human health. In response to requests by reviewers of a grant application, the AX arm was separated from the original RCT and data from the 15 protocol completers were analyzed independently and compared to data from the first 16 completers of the MCC protocol (non-fermentable controls). Study procedures were approved by the University of Alberta Health Research Ethics Board, identifier Pro00050274, with written informed consent obtained prior to participant enrollment (for study procedures refer to Ref.Citation47).
Study design and subjects
Thirty-eight volunteers with excess weight were enrolled in the study and instructed to supplement their diet, over six weeks, with either AX or MCC at a daily dose of 25 g (females) or 35 g (males) (). AX was AGRIFIBER SFC (previously named BIOFIBER GUM), a fermentable long-chain AX isolated from corn bran (AgriFiber Solutions LLC, Illinois, USA), while the non-fermentable control was MICROCEL MC-12, a large particle wood derived MCC (Blanver Farmoquimica LTDA, São Paulo, Brazil).Citation47 Thirty-one subjects aged 33 ± 9 years and body mass index 28.7 ± 2.3 kg/m2 completed the intervention and were analyzed per-protocol, which consisted of 21 females and 10 males (AX arm: 10F and 5 M; MCC arm: 11F and 5 M; Supplementary Table S1). On average, the total intake of dietary fiber was increased during the intervention from 19 ± 5 and 21 ± 11 g/day to 40 ± 5 and 56 ± 10 g/day for females and males, respectively (assessed by two 24-hr recalls).Citation46
Assessment of habitual diet at baseline
Diet history was assessed at baseline using the online one-month Canadian Diet History Questionnaire II (C-DHQ II), a food frequency questionnaire adapted for Canada.Citation69 C-DHQ II responses were analyses using Diet*Calc software (v1.5.0) and an updated C-DHQ II nutrient database, which included eight additional food group variables that align with Canada’s 2007 Food Guide serving-size-equivalents.Citation70 Prior to statistical integration with GI symptoms, C-DHQ II data were adjusted for total caloric intake.Citation71
Assessment of perceived GI symptoms
Participants reported GI symptoms at baseline, and weekly throughout the intervention by completing a symptoms diary. At the end of each week, subjects rated their overall symptoms, flatulence, bloating, and stomachache intensity using a scale from 0 (no symptoms) to 4 (severe symptoms).Citation48 A composite symptom rating was calculated by summing flatulence, bloating, and stomachache ratings, resulting in a possible range from 0 to 12 (higher ratings corresponded to more severe symptoms).
Two different approaches were used to quantify the “severity” of GI symptoms in response to AX and the degree of “adaptation” for each subject: maximum absolute change (MAX) in symptoms throughout the intervention and area under the curve (AUC) of symptoms (explained in Supplementary Figure S3). Although alike, MAX was used to ascertain extreme changes in symptom intensity, while AUC averaged the change in symptoms during the intervention.
To assess severity, the MAX severity score was calculated by subtracting baseline ratings from the highest reported rating during weeks 1 to 5, where higher scores represent more intense symptoms. To calculate the AUCseverity score, AUCs from weeks 1 to 6 were computed, where higher scores correspond to more severe symptoms during the six-week intervention relative to baseline. To evaluate adaptation, the MAX adaptation score was calculated by subtracting week 6 ratings from the highest reported rating during weeks 1 to 5. While higher scores represent greater reductions in symptom intensity, differences between the ratings indicate the degree to which symptoms adapted. To determine AUCadaptation, weeks 1 to 3 and weeks 4 to 6 AUCs were first computed, wherein differences between the AUCs indicate the degree of adaptation. AUCadaptation scores were then calculated by dividing the AUC from weeks 1 to 3 by the AUC from weeks 4 to 6, where higher scores equate to better adaptation during the final three weeks of treatment.
Fecal microbiota compositional and functional analyses
Compositional and functional features of the fecal microbial community were assessed at baseline and in response to one and six weeks of AX consumption. Findings from 16S rRNA gene amplicon profiling of fecal microbiota, including the identification of CARGs (groups of inter-correlated OTUs), as well as the characterization of fecal pH and SCFAs have been published previously by Nguyen et al.Citation47
To confirm whether bacterial taxa within the fecal microbial community specifically involved in the fermentation of AX influenced the severity and adaptation of GI symptoms during AX consumption, we utilized an ex vivo approach based on BONCAT.Citation46,Citation72 Briefly, this approach fluorescently labeled bacterial cells that were metabolically active during a 6-hr anaerobic incubation with AX, and then active bacteria were isolated using fluorescence-activated cell sorting. Next, 16S rRNA gene amplicon sequencing and bioinformatic analyses based on ASVs were used to identify the precise bacterial consortium within each participant’s fecal microbiota that contributed to AX fermentation. Initial findings, as published previously by Deehan et al,Citation46 suggest that the fermentation of AX involved numerous members of the fecal bacterial community (i.e., around 69% of observed ASVs), which included multiple Bacteroides spp., Blautia spp., and B. longum as part of the most abundant bacterial ASVs (average relative abundance > 1.0%; Supplementary Table S2). 16S rRNA gene amplicon data are available for download at the NCBI Sequence Read Archive under BioProjects: PRJNA564636 (fecal) and PRJNA630848 (ex vivo).
Statistical analyses
Generalized estimated equation models with Bonferroni post-hoc tests were applied to GI symptom and composite ratings to determine differences between-groups and within-group differences relative to baseline. Differences between AX and MCC for the calculated MAX severity and AUCseverity scores were determined by Mann-Whitney tests. To test for adaption to AX and MCC, Bonferroni corrected Wilcoxon tests were applied to determine differences between the highest rating reported during weeks 1 to 5 and the week 6 rating, as well as the AUC of weeks 1 to 3 ratings and weeks 4 to 6 ratings.
To determine whether compositional and functional features of the fecal microbiota or dietary factors correlated with symptom severity or adaptation, Spearman’s correlations were applied. Significant associations were first identified by correlating flatulence, bloating, stomachache, and composite severity scores with microbiota compositional variables measured in fecal samples during the intervention. As fecal samples were collected in weeks 1 and 6, symptoms during weeks 1 to 3 were hereby correlated with measurements in week 1 fecal samples, and symptoms during weeks 4 to 6 were correlated with measurements in week 6 fecal samples. For these analyses, all bacterial phyla, families, genera, and CARGs with average relative abundances above 0.15% (considering all fecal samples) were systematically assessed, while only OTUs significantly affected by AX (henceforth referred to as ‘significant OTUs’) were considered to reduce the chance of type I error from multiple comparisons (15 OTUs instead of 100; Supplementary Table S2). Significant OTUs and CARGs were evaluated further to determine if their relative abundance at baseline correlated with MAX and AUC severity and adaptation scores. AX-induced shifts (week 6 – baseline) of significant OTUs, CARGs, pH, and SCFAs were correlated with MAX and AUC severity and adaptation scores to assess whether microbial responses to AX relate to symptoms. Finally, to elucidate whether tolerance to AX is linked to bacterial taxa shown to be involved in the fermentation of AX, correlations were assessed between MAX and AUC severity and adaptation scores and the most abundant bacterial ASVs (average relative abundance > 1.0%; 22 ASVs instead of 90; Supplementary Table S2) within the active bacterial consortia as established by BONCAT.
Given the connections between habitual intake of animal- and plant-based diets and gut microbiome compositionCitation73 and that AXs constitute the main non-cellulose fiber in cereal grains,Citation24 we further investigated whether calorie-adjusted intakes – during the month prior to treatment – of meat/meat alternatives (included eggs, legumes, nuts, and seeds), cholesterol (a nutrient found only in animal-based foods), whole grains, and dietary fiber, or the ratio between these food groups or nutrients, correlated with MAX and AUC severity and adaptation scores. All statistical analyses were performed using GraphPad Prism v8.4.3, except from generalized estimated equation models, which were performed using the statistical software R v3.5.3. Statistical significance was considered at p < 0.01 for correlations with microbiota compositional data (to account for multiple comparisons), and at p < 0.05 for the remaining analyses.
Author contributions
Conceptualization: ECD and JW; Methodology: ECD, JC, CMP, and JW; Funding Acquisition: ECD, JC, CMP, and JW; Investigation: ECD and JC; Fecal Microbiota Analysis: NKN and MEPM; ex vivo Microbiota Analysis: AR and DB; Formal Statistical Analysis: ECD, ZZ, NKN, and JW; Visualization: ECD, ZZ, and NKN; Project Administration: ECD; Supervision: CMP and JW; Writing – Original Draft: ECD and JW; All authors commented on and approved the final manuscript.
Availability of data
16S rRNA gene amplicon sequencing data are publicly available in the NCBI Sequence Read Archive and can be accessed through BioProject accession numbers PRJNA564636 (fecal) and PRJNA630848 (ex vivo).
Supplemental Material
Download PDF (3.8 MB)Acknowledgment
ECD acknowledges start-up funding from the University of Nebraska-Lincoln, the Nebraska Food for Health Center, and the Paustian Inflammatory Bowel Disease Center at the University of Nebraska Medical Center.
Disclosure statement
ECD was a previous employee of AgriFiber Solutions LLC (Illinois, USA). JW has received research funding and consulting fees from industry sources involved in the manufacture and marketing of dietary fibers, including AgriFiber Solutions LLC. JW is further a co-owner of Synbiotics Health, a developer of synbiotic products. These interests did not influence his judgement or presentation of study findings. All other authors declare no conflict of interest.
Supplementary material
Supplemental data for this article can be accessed online at https://doi.org/10.1080/19490976.2024.2363021
Additional information
Funding
References
- Reynolds A, Mann J, Cummings J, Winter N, Mete E, Te Morenga L. Carbohydrate quality and human health: a series of systematic reviews and meta-analyses. Lancet. 2019;393(10170):434–18. doi:10.1016/S0140-6736(18)31809-9.
- Gill SK, Rossi M, Bajka B, Whelan K. Dietary fibre in gastrointestinal health and disease. Nat Rev Gastroenterol Hepatol. 2021;18(2):101–116. doi:10.1038/s41575-020-00375-4.
- Makki K, Deehan EC, Walter J, Bäckhed F. The impact of dietary fiber on gut microbiota in host health and disease. Cell Host Microbe. 2018;23(6):705–715. doi:10.1016/j.chom.2018.05.012.
- Jones JM. CODEX-aligned dietary fiber definitions help to bridge the ‘fiber gap’. Nutr J. 2014;13(1):34. doi:10.1186/1475-2891-13-34.
- Clemens R, Kranz S, Mobley AR, Nicklas TA, Raimondi MP, Rodriguez JC, Slavin JL, Warshaw H. Filling America’s fiber intake gap: summary of a roundtable to probe realistic solutions with a focus on grain-based foods. J Nutrit. 2012;142(7):1390S–1401S. doi:10.3945/jn.112.160176.
- Armet AM, Deehan EC, O’Sullivan AF, Mota JF, Field CJ, Prado CM, Lucey AJ, Walter J. Rethinking healthy eating in light of the gut microbiome. Cell Host Microbe. 2022;30(6):764–785. doi:10.1016/j.chom.2022.04.016.
- Miller KB. Review of whole grain and dietary fiber recommendations and intake levels in different countries. Nutr Rev. 2020;78(Supplement_1):29–36. doi:10.1093/nutrit/nuz052.
- Deehan EC, Walter J. The fiber gap and the disappearing gut microbiome: implications for human nutrition. Trends Endocrinol Metab. 2016;27(5):239–242. doi:10.1016/j.tem.2016.03.001.
- O’Grady J, O’Connor EM, Shanahan F. Review article: dietary fibre in the era of microbiome science. Aliment Pharmacol Ther. 2019;49(5):506–515. doi:10.1111/apt.15129.
- Sonnenburg ED, Sonnenburg JL. The ancestral and industrialized gut microbiota and implications for human health. Nat Rev Microbiol. 2019;17(6):383–390. doi:10.1038/s41579-019-0191-8.
- O’Keefe SJ. The association between dietary fibre deficiency and high-income lifestyle-associated diseases: Burkitt’s hypothesis revisited. Lancet Gastroenterol Hepatol. 2019;4(12):984–996. doi:10.1016/S2468-1253(19)30257-2.
- Armet AM, Deehan EC, Thöne JV, Hewko SJ, Walter J. The effect of isolated and synthetic dietary fibers on markers of metabolic diseases in human intervention studies: a systematic review. Adv Nutr. 2020;11(2):420–438. doi:10.1093/advances/nmz074.
- Reynolds AN, Akerman AP, Mann J, Ma RCW. Dietary fibre and whole grains in diabetes management: systematic review and meta-analyses. PLOS Med. 2020;17(3):e1003053. doi:10.1371/journal.pmed.1003053.
- Hamaker BR, Tuncil YE. A perspective on the complexity of dietary fiber structures and their potential effect on the gut microbiota. J Mol Biol. 2014;426(23):3838–3850. doi:10.1016/j.jmb.2014.07.028.
- Kok CR, Rose D, Hutkins R. Predicting personalized responses to dietary fiber interventions: opportunities for modulation of the gut microbiome to improve health. Annu Rev Food Sci Technol. 2023;14(1):157–182. doi:10.1146/annurev-food-060721-015516.
- Fan S, Zhang Z, Zhao Y, Daglia M, Zhang J, Zhu Y, Bai J, Zhu L, Xiao X. Recent advances in targeted manipulation of the gut microbiome by prebiotics: from taxonomic composition to metabolic function. Curr Opin Food Sci. 2023;49:100959. doi:10.1016/j.cofs.2022.100959.
- Deehan EC, Mocanu V, Madsen KL. Effects of dietary fibre on metabolic health and obesity. Nat Rev Gastro Hepat. 2024;21:301–318. doi:10.1038/s41575-023-00891-z.
- Tannock GW, Liu Y. Guided dietary fibre intake as a means of directing short-chain fatty acid production by the gut microbiota. J R Soc N Z. 2020;50(3):434–455. doi:10.1080/03036758.2019.1657471.
- Deehan EC, Yang C, Perez-Muñoz ME, Nguyen NK, Cheng CC, Triador L, Zhang Z, Bakal JA, Walter J. Precision microbiome modulation with discrete dietary fiber structures directs short-chain fatty acid production. Cell Host Microbe. 2020;27(3):389–404.e6. doi:10.1016/j.chom.2020.01.006.
- Thompson SV, Hannon BA, An R, Holscher HD. Effects of isolated soluble fiber supplementation on body weight, glycemia, and insulinemia in adults with overweight and obesity: a systematic review and meta-analysis of randomized controlled trials. Am J Clin Nutr. 2017;106(6):1514–1528. doi:10.3945/ajcn.117.163246.
- Deehan EC, Duar RM, Armet AM, Perez-Muñoz ME, Jin M, Walter J, Britton RA, Cani PD. Modulation of the gastrointestinal microbiome with nondigestible fermentable carbohydrates to improve human health. Microbiol Spectr. 2017;5(5):1–24. doi:10.1128/microbiolspec.BAD-0019-2017.
- Kalantar-Zadeh K, Berean KJ, Burgell RE, Muir JG, Gibson PR. Intestinal gases: influence on gut disorders and the role of dietary manipulations. Nat Rev Gastroenterol Hepatol. 2019;16(12):733–747. doi:10.1038/s41575-019-0193-z.
- Mutuyemungu E, Singh M, Liu S, Rose DJ. Intestinal gas production by the gut microbiota: A review. J Funct Foods. 2023;100:105367. doi:10.1016/j.jff.2022.105367.
- Livesey G. Tolerance of low-digestible carbohydrates: a general view. Br J Nutr. 2001;85(S1):S7–S16. doi:10.1079/BJN2000257.
- Corsetti M, Gevers A-M, Caenepeel P, Tack J. The role of tension receptors in colonic mechanosensitivity in humans. Gut. 2004;53(12):1787–1793. doi:10.1136/gut.2004.038786.
- Mendis M, Leclerc E, Simsek S. Arabinoxylans, gut microbiota and immunity. Carbohyd Polym. 2016;139:159–166. doi:10.1016/j.carbpol.2015.11.068.
- Rumpagaporn P, Reuhs BL, Kaur A, Patterson JA, Keshavarzian A, Hamaker BR. Structural features of soluble cereal arabinoxylan fibers associated with a slow rate of in vitro fermentation by human fecal microbiota. Carbohyd Polym. 2015;130:191–197. doi:10.1016/j.carbpol.2015.04.041.
- Koecher KJ, Noack JA, Timm DA, Klosterbuer AS, Thomas W, Slavin JL. Estimation and interpretation of fermentation in the gut: coupling results from a 24 h batch in vitro system with fecal measurements from a human intervention feeding study using fructo-oligosaccharides, inulin, gum acacia, and pea fiber. J Agric Food Chem. 2014;62(6):1332–1337. doi:10.1021/jf404688n.
- Kaur A, Rose DJ, Rumpagaporn P, Patterson JA, Hamaker BR. In vitro batch fecal fermentation comparison of gas and short-chain fatty acid production using “slowly fermentable” dietary fibers. J Food Sci. 2011;76(5):H137–H42. doi:10.1111/j.1750-3841.2011.02172.x.
- Erickson JM, Carlson JL, Stewart ML, Slavin JL. Fermentability of novel type-4 resistant starches in in vitro system. System Foods. 2018;7(2):E18. doi:10.3390/foods7020018.
- Xu H, Reuhs BL, Cantu-Jungles TM, Tuncil YE, Kaur A, Terekhov A, Martens EC, Hamaker BR. Corn arabinoxylan has a repeating structure of subunits of high branch complexity with slow gut microbiota fermentation. Carbohyd Polym. 2022;289:119435. doi:10.1016/j.carbpol.2022.119435.
- Grabitske HA, Slavin JL. Gastrointestinal effects of low-digestible carbohydrates. Crit Rev Food Sci Nutr. 2009;49(4):327–360. doi:10.1080/10408390802067126.
- Mysonhimer AR, Holscher HD. Gastrointestinal effects and tolerance of nondigestible carbohydrate consumption. Adv Nutr. 2022;13(6):2237–2276. doi:10.1093/advances/nmac094.
- Cherbut C, Michel C, Raison V, Kravtchenko T, Severine M. Acacia gum is a bifidogenic dietary fibre with high digestive tolerance in healthy humans. Microb Ecol Health Dis. 2003;15(1):43–50. doi:10.1080/08910600310014377.
- Vermorel M, Coudray C, Wils D, Sinaud S, Tressol JC, Montaurier C, Vernet J, Brandolini M, Bouteloup-Demange C, Rayssiguier Y, et al. Energy value of a low-digestible carbohydrate, NUTRIOSE? FB, and its impact on magnesium, calcium and zinc apparent absorption and retention in healthy young men. Eur J Nutr. 2004;43(6):344–352. doi:10.1007/s00394-004-0477-z.
- Salden BN, Troost FJ, Wilms E, Truchado P, Vilchez-Vargas R, Pieper DH, Jáuregui R, Marzorati M, van de Wiele T, Possemiers S, et al. Reinforcement of intestinal epithelial barrier by arabinoxylans in overweight and obese subjects: a randomized controlled trial: arabinoxylans in gut barrier. Clin Nutr. 2018;37(2):471–480. doi:10.1016/j.clnu.2017.01.024.
- Mego M, Manichanh C, Accarino A, Campos D, Pozuelo M, Varela E, Vulevic J, Tzortzis G, Gibson G, Guarner F, et al. Metabolic adaptation of colonic microbiota to galactooligosaccharides: a proof-of-concept-study. Aliment Pharmacol Ther. 2017;45(5):670–680. doi:10.1111/apt.13931.
- Babiker R, Merghani TH, Elmusharaf K, Badi RM, Lang F, Saeed AM. Effects of gum Arabic ingestion on body mass index and body fat percentage in healthy adult females: two-arm randomized, placebo controlled, double-blind trial. Nutr J. 2012;11(1):111. doi:10.1186/1475-2891-11-111.
- Okubo T, Ishihara N, Takahashi H, Fujisawa T, Kim M, Yamamoto T, Mitsuoka T. Effects of partially hydrolyzed guar gum intake on human intestinal microflora and its metabolism. Biosci Biotechnol Biochem. 1994;58(8):1364–1369. doi:10.1271/bbb.58.1364.
- Kruse HP, Kleessen B, Blaut M. Effects of inulin on faecal bifidobacteria in human subjects. Br J Nutr. 1999;82(5):375–382. doi:10.1017/S0007114599001622.
- Pasman WJ, Wils D, Saniez M-H, Kardinaal AF. Long-term gastrointestinal tolerance of NUTRIOSE® FB in healthy men. Eur J Clin Nutr. 2006;60(8):1024–1034. doi:10.1038/sj.ejcn.1602418.
- Hess AL, Benitez-Paez A, Blaedel T, Larsen LH, Iglesias JR, Madera C, Sanz Y, Larsen TM. The effect of inulin and resistant maltodextrin on weight loss during energy restriction: a randomised, placebo-controlled, double-blinded intervention. Eur J Nutr. 2020;59(6):2507–2524. doi:10.1007/s00394-019-02099-x.
- Mego M, Accarino A, Tzortzis G, Vulevic J, Gibson GR, Guarner F, Azpiroz F. Colonic gas homeostasis: mechanisms of adaptation following HOST-G904 galactooligosaccharide use in humans. Neurogastroenterol Motil. 2017;29(9):e13080. doi:10.1111/nmo.13080.
- Davis LMG, Martínez I, Walter J, Goin C, Hutkins RW, Tan P. Barcoded pyrosequencing reveals that consumption of galactooligosaccharides results in a highly specific bifidogenic response in humans. PLOS ONE. 2011;6(9):e25200. doi:10.1371/journal.pone.0025200.
- Davis LMG, Martínez I, Walter J, Hutkins RW. A dose dependent impact of prebiotic galactooligosaccharides on the intestinal microbiota of healthy adults. Int J Food Microbiol. 2010;144(2):285–292. doi:10.1016/j.ijfoodmicro.2010.10.007.
- Deehan EC, Zhang Z, Riva A, Armet AM, Perez-Muñoz ME, Nguyen NK, Krysa JA, Seethaler B, Zhao Y-Y, Cole J, et al. Elucidating the role of the gut microbiota in the physiological effects of dietary fiber. Microbiome. 2022;10(1):77. doi:10.1186/s40168-022-01248-5.
- Nguyen NK, Deehan EC, Zhang Z, Jin M, Baskota N, Perez-Muñoz ME, Cole J, Tuncil YE, Seethaler B, Wang T, et al. Gut microbiota modulation with long-chain corn bran arabinoxylan in adults with overweight and obesity is linked to an individualized temporal increase in fecal propionate. Microbiome. 2020;8(1):118. doi:10.1186/s40168-020-00887-w.
- Martínez I, Kim J, Duffy PR, Schlegel VL, Walter J, Heimesaat MM. Resistant starches types 2 and 4 have differential effects on the composition of the fecal microbiota in human subjects. PLOS ONE. 2010;5(11):e15046. doi:10.1371/journal.pone.0015046.
- Healey GR, Murphy R, Brough L, Butts CA, Coad J. Interindividual variability in gut microbiota and host response to dietary interventions. Nutr Rev. 2017;75(12):1059–1080. doi:10.1093/nutrit/nux062.
- Venkataraman A, Sieber JR, Schmidt AW, Waldron C, Theis KR, Schmidt TM. Variable responses of human microbiomes to dietary supplementation with resistant starch. Microbiome. 2016;4(1):33. doi:10.1186/s40168-016-0178-x.
- Lam YY, Zhang C, Zhao L. Causality in dietary interventions—building a case for gut microbiota. Genome Med. 2018;10(1):62. doi:10.1186/s13073-018-0573-y.
- Lee J-H, O’Sullivan DJ. Genomic insights into bifidobacteria. Microbiol Mol Biol Rev. 2010;74(3):378–416. doi:10.1128/MMBR.00004-10.
- Wu GD, Chen J, Hoffmann C, Bittinger K, Chen Y-Y, Keilbaugh SA, Bewtra M, Knights D, Walters WA, Knight R, et al. Linking long-term dietary patterns with gut microbial enterotypes. Science. 2011;334(6052):105–108. doi:10.1126/science.1208344.
- David LA, Maurice CF, Carmody RN, Gootenberg DB, Button JE, Wolfe BE, Ling AV, Devlin AS, Varma Y, Fischbach MA, et al. Diet rapidly and reproducibly alters the human gut microbiome. Nature. 2014;505(7484):559–563. doi:10.1038/nature12820.
- Bolte LA, Vich Vila A, Imhann F, Collij V, Gacesa R, Peters V, Wijmenga C, Kurilshikov A, Campmans-Kuijpers MJE, Fu J, et al. Long-term dietary patterns are associated with pro-inflammatory and anti-inflammatory features of the gut microbiome. Gut. 2021;70(7):1287–1298. doi:10.1136/gutjnl-2020-322670.
- Holscher HD, Doligale JL, Bauer LL, Gourineni V, Pelkman CL, Fahey GC, Swanson KS. Gastrointestinal tolerance and utilization of agave inulin by healthy adults. Food Funct. 2014;5(6):1142–1149. doi:10.1039/c3fo60666j.
- Hernot DC, Boileau TW, Bauer LL, Middelbos IS, Murphy MR, Swanson KS, Fahey GC. In vitro fermentation profiles, gas production rates, and microbiota modulation as affected by certain fructans, galactooligosaccharides, and polydextrose. J Agric Food Chem. 2009;57(4):1354–1361. doi:10.1021/jf802484j.
- Smith NW, Shorten PR, Altermann EH, Roy NC, McNabb WC. Hydrogen cross-feeders of the human gastrointestinal tract. Gut Microbes. 2019;10(3):270–288. doi:10.1080/19490976.2018.1546522.
- Jalanka-Tuovinen J, Salonen A, Nikkila J, Immonen O, Kekkonen R, Lahti L, Palva A, de Vos WM. Intestinal microbiota in healthy adults: temporal analysis reveals individual and common core and relation to intestinal symptoms. PLOS ONE. 2011;6(7):e23035. doi:10.1371/journal.pone.0023035.
- Guyonnet D, Chassany O, Ducrotte P, Picard C, Mouret M, Mercier C-H, Matuchansky C. Effect of a fermented milk containing bifidobacterium animalis DN-173 010 on the health-related quality of life and symptoms in irritable bowel syndrome in adults in primary care: a multicentre, randomized, double-blind, controlled trial. Aliment Pharmacol Ther. 2007;26(3):475–486. doi:10.1111/j.1365-2036.2007.03362.x.
- Whorwell PJ, Altringer L, Morel J, Bond Y, Charbonneau D, O’Mahony L, Kiely B, Shanahan F, Quigley EMM. Efficacy of an encapsulated probiotic bifidobacterium infantis 35624 in women with irritable bowel syndrome. Am J Gastroenterol. 2006;101(7):1581–1590. doi:10.1111/j.1572-0241.2006.00734.x.
- O’Mahony L, McCarthy J, Kelly P, Hurley G, Luo F, Chen K, O’Sullivan GC, Kiely B, Collins JK, Shanahan F, et al. Lactobacillus and bifidobacterium in irritable bowel syndrome: symptom responses and relationship to cytokine profiles. Gastroenterol. 2005;128(3):541–551. doi:10.1053/j.gastro.2004.11.050.
- Perman J, Modler S, Olson A. Role of pH in production of hydrogen from carbohydrates by colonic bacterial flora. Studies in vivo and in vitro. J Clin Invest. 1981;67(3):643–650. doi:10.1172/JCI110079.
- Holmstrøm K, Collins MD, Moller T, Falsen E, Lawson PA. Subdoligranulum variabile gen. nov. sp. nov. from human feces. Anaerobe. 2004;10(3):197–203. doi:10.1016/j.anaerobe.2004.01.004.
- Lomax AE, Pradhananga S, Sessenwein JL, O’Malley D. Bacterial modulation of visceral sensation: mediators and mechanisms. Am J Physiol Gastrointest Liver Physiol. 2019;317(3):G363–G372. doi:10.1152/ajpgi.00052.2019.
- Wu GD, Compher C, Chen EZ, Smith SA, Shah RD, Bittinger K, Chehoud C, Albenberg LG, Nessel L, Gilroy E, et al. Comparative metabolomics in vegans and omnivores reveal constraints on diet-dependent gut microbiota metabolite production. Gut. 2016;65(1):63–72. doi:10.1136/gutjnl-2014-308209.
- Hiel S, Bindels LB, Pachikian BD, Kalala G, Broers V, Zamariola G, Chang BPI, Kambashi B, Rodriguez J, Cani PD, et al. Effects of a diet based on inulin-rich vegetables on gut health and nutritional behavior in healthy humans. Am J Clin Nutr. 2019;109(6):1683–1695. doi:10.1093/ajcn/nqz001.
- Manichanh C, Eck A, Varela E, Roca J, Clemente JC, Gonzalez A, Knights D, Knight R, Estrella S, Hernandez C, et al. Anal gas evacuation and colonic microbiota in patients with flatulence: effect of diet. Gut. 2014;63(3):401–408. doi:10.1136/gutjnl-2012-303013.
- Csizmadi I, Boucher BA, Lo Siou G, Massarelli I, Rondeau I, Garriguet D, Koushik A, Elenko J, Subar AF. Using national dietary intake data to evaluate and adapt the US diet history questionnaire: the stepwise tailoring of an FFQ for Canadian use. Public Health Nutr. 2016;19(18):3247–3255. doi:10.1017/S1368980016001506.
- McInerney M, Csizmadi I, Friedenreich CM, Uribe FA, Nettel-Aguirre A, McLaren L, Potestio M, Sandalack B, McCormack GR. Associations between the neighbourhood food environment, neighbourhood socioeconomic status, and diet quality: an observational study. BMC Public Health. 2016;16(1):984. doi:10.1186/s12889-016-3631-7.
- Willett W, Stampfer MJ. Total energy intake: implications for epidemiologic analyses. Am J Epidemiol. 1986;124(1):17–27. doi:10.1093/oxfordjournals.aje.a114366.
- Riva A, Rasoulimehrabani H, Cruz-Rubio JM, Schnorr SL, von Baeckmann C, Inan D, Nikolov G, Herbold CW, Hausmann B, Pjevac P, et al. Identification of inulin-responsive bacteria in the gut microbiota via multi-modal activity-based sorting. Nat Commun. 2023;14(1):8210. doi:10.1038/s41467-023-43448-z.
- Voreades N, Kozil A, Weir TL. Diet and the development of the human intestinal microbiome. Front Microbiol. 2014;5:494. doi:10.3389/fmicb.2014.00494.