
ABSTRACT
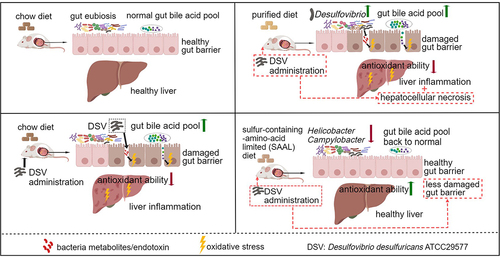
Diet is a key player in gut–liver axis. However, the effect of different dietary patterns on gut microbiota and liver functions remains unclear. Here, we used rodent standard chow and purified diet to mimic two common human dietary patterns: grain and plant-based diet and refined-food-based diet, respectively and explored their impacts on gut microbiota and liver. Gut microbiota experienced a great shift with notable increase in Desulfovibrio, gut bile acid (BA) levels elevated significantly, and liver inflammation was observed in mice fed with the purified diet. Liver inflammation and elevated gut BA levels also occurred in mice fed with the chow diet after receiving Desulfovibrio desulfuricans ATCC 29,577 (DSV). Restriction of sulfur-containing amino acids (SAAs) prevented liver injury mainly through higher hepatic antioxidant and detoxifying ability and reversed the elevated BA levels due to excess Desulfovibrio. Ex vivo fermentation of human fecal microbiota with primary BAs demonstrated that DSV enhanced production of secondary BAs. Higher concentration of both primary and secondary BAs were found in the gut of germ-free mice after receiving DSV. In conclusion, Restriction of SAAs in diet may become an effective dietary intervention to prevent liver injury associated with excess Desulfovibrio in the gut.
GRAPHICAL ABSTRACT
Introduction
The concept of liver–gut axis was firstly proposed by Marshall in 1998 and has been studied for over 20 y. Understanding the crosstalk between the liver and gut helps elucidate many causes behind the liver diseases such as nonalcoholic fatty liver disease (NAFLD), alcoholic liver disease (ALD), liver fibrosis, liver cirrhosis and liver cancer.Citation1,Citation2 The liver is affected by the gut when nutrients, microbial metabolites and microbial surface molecules are transferred from the gut to liver through the portal vein; on the other hand, gut microbial growth and metabolism are closely related to bile acids secreted by the liver.Citation1–5 When gut dysbiosis occurs, impaired gut barrier allows translocation of potentially pathogenic microbes, harmful microbial metabolites and toxins to the liver, which makes the liver overwhelmed by pro-inflammatory molecules and causes liver diseases ultimately if no interventions are involved.Citation6–10
Dietary factors always play an essential role in the gut–liver axis since food is the most active interactor with gut microbes, which pose a direct impact on the structure of gut microbiota and gut metabolism. Many researches have focused on how dietary patterns affect host health through gut–host interaction. Unhealthy diets such as high-fat diet has always been the study focus for metabolic diseases including obesity, diabetes, metabolic liver diseases, cardiovascular diseases and so on while healthy diets such as Mediterranean diet and methionine-restricted diet (MRD) are associated with distinct gut microbiota, healthy gut barrier, improved host metabolism and longevity.Citation1,Citation11–13 MRD, as a type of sulfur-containing-amino-acid-limited (SAAL) diet, has been studied as a dietary strategy for longevity which could extend health span and lifespan in rodents by improving the glucose metabolism, enhancing antioxidant ability to liver cell injury, reducing energy expenditure, reversing the transcriptional alterations in inflammation and DNA-damage response genes, reducing hepatic DNA hypomethylation and improving the lipid and BA profile in aging adult mice or progeria mouse models.Citation13–16
Chow diet and purified diet are widely used in rodent studies, which can mimic two common dietary patterns of humans: healthy grain and plant-based diet with minimal processing and refined-food-based diet made of more refined and over-processed ingredients, respectively. The biggest difference between the chow and purified diet is the degree of refinement of ingredients and the bioavailability of nutritional contents. Chow diet is mainly made of natural ingredients such as whole grains, high protein meals, together with some vitamin and mineral premixes. The nutrients are often in bound forms in chow diet and can be variable from batch to batch. Purified diet is often made of more refined ingredients such as casein, corn starch, maltodextrin, vegetable oil with addition of cellulose and chemically pure inorganic salts and vitamins.Citation17 Since purified diet is more refined and contains limited types of ingredients, the nutrients are more accessible in unbound forms and at the same time lack soluble fiber and some bioactive compounds existing in unprocessed food ingredients, which may pose different health effects on the host.Citation18 Recent studies demonstrate that compared with the chow diet, the purified diet is more disease-inducing, including altered gut microbial structure, increased gut barrier damage, increased hepatic steatosis and inflammation, impaired glucose tolerance, and exacerbation of DSS-induced colitis and inflammatory bowel disease (IBD) even supplemented with commonly recognized beneficial oligosaccharides or fibers .Citation19–25 However, how the purified diet modulates the gut microbiota and thus affects liver pathophysiology is poorly understood.
In this study, we aim to investigate the impacts and underlying mechanism of dietary patterns on gut microbiota and liver health. We confirme the disease-inducing nature of the purified diet, in which gut microbiota and gut metabolic profile experience a great shift and liver inflammation is observed. We then propose and validate that Desulfovibrio, a key microbial biomarker in mice fed with the purified diet, as an important player in the alteration of gut BA profile and liver inflammation. We further extend the health effects of SAAL diet, where it can prevent liver injury and reverse the elevated gut BA levels due to excess Desulfovibrio in mice. Overall, this study provides new insights of how dietary patterns affect liver health by proposing Desulfovibrio as a key microbial player. Restricted intake of SAAs may become an effective dietary intervention to prevent liver injury associated with excess Desulfovibrio in the gut.
Materials and methods
Animals and treatments
Five-week-old male BALB/c mice were purchased from Shanghai Slac Laboratory Animal Ltd. (Shanghai, China). Mice were housed in a specific-pathogen-free (SPF) environment (20–26°C, 40–70% humidity, 12 light/dark cycle) with ad libitum access to distilled water and sterilized food.
1st animal experiment
After one-week acclimation, mice were randomly divided into two groups according to their body weight (n = 10 mice/group). Mice in the CTRL group were fed with the chow diet (M01-F, Shanghai Slac Laboratory Animal Ltd., Shanghai, China) and mice in the PURE group were fed with the purified diet (TP0016S, Trophic Animal Feed High-Tech Co. Ltd., China). This purified diet is an amino-acid defined NRC95 standard diet. NRC95 refers to the fourth revised edition of Nutritional Requirements for Laboratory Animals produced by National Research Council (US) Subcommittee on Laboratory Animal Nutrition in 1995, which raised the content of methionine, vitamin K and vitamin B12.17 Amino acid-defined NRC95 purified diet refers to purified diet made according to the NRC95 standard but individual amino acids instead of casein are added. It is usually used as the control diet for animal studies which involve in changes of contents of amino acids. The experiment’s duration was 28 d.
2nd animal experiment
After one-week acclimation, mice were randomly divided into two groups according to their body weight (n = 5 mice/group). Mice in the CTRL group were fed with the chow diet (M01-F, Shanghai Slac Laboratory Animal Ltd., Shanghai, China) and mice in the CTRL_D group were fed with the same chow diet and administrated with 5 × 10⁷ CFU of DSV by oral gavage every day. DSV were purchased from China General Microbiological Culture Collection Center (CGMCC). The experiment's duration was 28 d.
3rd animal experiment
After one-week acclimation, mice were randomly divided into four groups according to their body weight (n = 6 mice/group). Mice in the PURE group were fed with the purified diet (TP0016S, Trophic Animal Feed High-tech Co. Ltd., Nantong, China). Mice in the SAAL group were fed with the SAAL diet (TP0030, containing 0.15% methionine and 0% cystine, Trophic Animal Feed High-tech Co. Ltd., Nantong, China). Mice in the PURE_D group were fed with the same diet as the PURE group and administrated with 5 × 10⁷ CFU of DSV by oral gavage every day. Mice in the SAAL_D group were fed with the same diet as the SAAL group and administrated with 5 × 10⁷ CFU of DSV by oral gavage every day. The experiment's duration was 28 d.
4th animal experiment
Germ-free 5-week-old BALB/c mice were bred and maintained in special plastic isolators (GemPharmatech, Nanjing, China). All mice were housed under a strict 12-hour light cycle (lights on at 08:00). Animals were supplied with a 50-kGy irradiated sterile pelleted normal chow diet (1010063, Jiangsu Xietong Pharmaceutical Bio-engineering Co., Ltd., Nanjing, China) and autoclaved tap water ab libitum. Bedding was replaced in all experiments every 7 d. All germ-free mice were routinely screened for bacteria, viral, and fungus contamination. After one-week acclimation, mice were randomly divided into two groups according to their body weight (n = 5 mice/group). Mice in the GFC group were fed with the chow diet and mice in the GFDSV group were fed with the chow diet and administrated with 2 × 10⁸ CFU of DSV by oral gavage every day for 14 d.
Study protocols conformed to the Animal research: Reporting of In Vivo Experiments (ARRIVE) guidelines. All procedures were approved by the Institutional Animal Care and Use Committee of Jiangnan University, Wuxi, China (Approval No. 20210530b0800731[137]).
Ex vivo fermentation of human fecal bacteria with bile acids
To investigate if the result obtained from the animal experiments that excess Desulfovibrio changed gut BA profile could be transferred to human gut microbes, feces of two healthy male and two female volunteers were collected. Volunteers were between 23 and 30 y old without any metabolic diseases and did not take any antibiotics during the past 3 months. Written informed consent was obtained from each volunteer after being informed of the purpose of the sample collection and the study protocol conforms to the ethical guidelines of the 1975 Declaration of Helsinki as reflected in a priori approval by the Human Research Committee of Jiangnan University (Ethics approval no. JNU20220310IRB47). The pretreatment of the fecal samples and ex vivo culturing method followed the methods in Javdan et al.’s paper.Citation26 Briefly, 1 gram of each fecal sample was mixed with 15 mL sterile pre-reduced phosphate buffer (containing 0.1% L-cysteine) and 15 mL 40% glycerol. After vigorous vortex, the homogenate was left still for 5 min to allow the insoluble particles to settle to the bottom. Several aliquots of 1 mL of the supernatant were collected and stored at −80°C for later use. The whole process was performed in an anaerobic chamber (90% N2, 5% CO2 and 5% H2).
An aliquot of 200 μL of each glycerol stock was inoculated into 20 mL of pre-reduced BG medium (70% Bryant and Burkey Medium + 30% modified Gifu Anaerobic Medium, both purchased from Shandong Tuopu Biol-engineering Co., LTD.) and incubated for 24 h at 37°C in an anaerobic chamber. A 1.5 mL of the culture was then allocated to each of the 3 wells in a 96-well plate. Each fecal bacterial culture was subject to three different treatments, including B (fecal bacteria with bile salt mixture), DB (fecal bacteria with addition of 107 CFU of DSV/mL and bile salt mixture) and KB (heat-killed fecal bacteria with bile salt mixture). Besides KB as a negative control, an abiotic BG medium (M) with bile salt mixture added in was served as another negative control, which included three replicates. The number of DSV added was determined according to the reported relative abundance of Desulfovibrio species in healthy human beings, which is around 0.0001%−1%.Citation27 One percent was chosen in this experiment to ensure a relatively high number of DSV could be added. The specific CFU number was then determined based on the number of bacteria in a healthy human fecal sample. Briefly, 200 μL of one fecal glycerol stock was inoculated in 200 mL of BG medium and incubated at 37°C for 24 h in an anaerobic chamber. A 1 mL of the culture was taken out and centrifuged at 10,000 rpm for 3 min. Medium was discarded and resuspended in 1 mL of 70% isopropanol for 30 min at room temperature to kill and fix the bacterial cells. Isopropanol was discarded after centrifugation at 10,000 rpm for 3 min and resuspended in 1 mL of 0.85% saline. The sample was diluted 100 times and was divided into halves, one served as the non-stained control and the other one was added with 0.75 μL of 20 mM propidium iodide (PI) to stain the bacterial DNA. Flow cytometry was then performed on the BD Accuri C6 Plus Flow Cytometer (Becton, Dickinson and Company, New Jersey, USA). The count of bacterial cells was around 109 CFU/mL (Fig. S1). Therefore, the number of DSV added was 107 CFU/mL.
Bile salt mixture contained 0.005 mg/mL sodium salt of taurocholic acid (TCA), 0.0018 mg/mL sodium salt of taurochenodeoxycholic acid (TCDCA), 0.0039 mg/mL sodium salt of glycocholic acid (GCA) and 0.0032 mg/mL sodium salt of glycochenodeoxycholic acid (GCDCA), which was one-tenth of the concentrations reported in the research of Huang’s groupCitation28 since the fecal culture only contained around 109 CFU/mL of bacteria after 24 h of incubation, around one-tenth of the number of normal human gut microbes which is around 1010 − 1011 CFU.Citation29 After adding DSV and bile salts, the samples were allowed to incubate for another 24 h. A 1 mL of each sample was collected for 16s rRNA gene sequencing, and the left 500 μL was collected for BA analysis.
Supplementary methods provide additional details on sample collection, physiological parameters, histological examination, 16s rRNA gene sequencing, metagenomic sequencing, metabolomic study, transcriptomic study, gene expressions determined by qRT-PCR, evaluation of hepatic oxidative stress, quantification of BAs by UPLC-MS-MS and detection of amino acids in the chow diet using HPLC.
Statistical analysis
GraphPad Prism (v8.4.2, San Diego, CA) was used for data analysis. Student's t-test was used for data with normal distribution and Mann–Whitney test was used for data not conforming to normal distribution for comparisons between two groups. One-way ANOVA with FDR (Two-stage step-up method of Benjamini, Krieger and Yekutieli) post hoc test was performed for data with normal distribution and Kruskal–Wallis test with FDR (two-stage step-up method of Benjamini, Krieger and Yekutieli) post hoc test was performed for data not conforming to normal distribution for comparisons between three or more groups. For ex vivo experiment of bile acid metabolism of human fecal bacteria, data were analyzed using paired t-test or Wilcoxon matched-pairs signed rank test. Data were represented by mean ± SEM. Biological significance was represented by *p < 0.05 and **p < 0.01.
Results
Purified diet led to significant changes of the structure of gut microbiota and gut metabolic profile
To investigate the impact of two dietary patterns on gut microbial structure and gut metabolic profile, we first fed mice in the CTRL group with chow diet and mice in the PURE group with purified diet for 28 d (; nutrition facts and dietary ingredients can be found in Table S1 and Table S2).
Figure 1. Gut microbiota of mice fed with the chow diet and purified diet determined by 16s rRNA gene sequencing. (a) Experimental design. (b) Indices of alpha diversity including Chao, Ace, Shannon and Simpson indices. (c) Principle Co-ordinates Analysis (PCoA, unweighted Unifrac) of gut microbiota. (d) Cladogram of LEfSe of gut microbiota. (e) Relative abundance of Desulfovibrio. n = 10 mice per group. Data are represented as the mean ± SEM, two-tailed Student t-test or Mann–Whitney test, *p < 0.05, **p < 0.01.
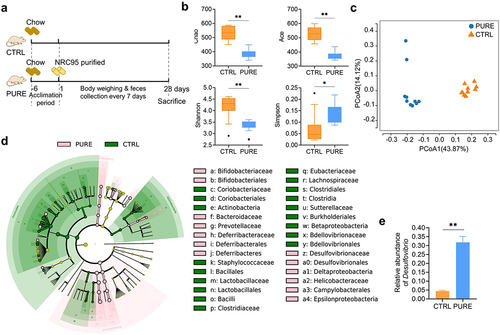
Big difference in gut microbial structure was demonstrated between the two groups. Lower Chao and Ace index reflected lower richness of bacteria while lower Shannon index but higher Simpson index reflected lower diversity of bacteria in the PURE group than CTRL group (). Principle Co-ordinates Analysis (PCoA) demonstrated distinct microbial structure in each group (). A large number of microbial biomarkers were identified in both groups by linear discriminant analysis of effect sizes (LEfSe), in which genus Desulfovibiro and its higher taxonomic classification including family Desulfovibrionaceae, order Desulfovibrionales, class Deltaproteobacteria and phylum Proteobacteria, were top five biomarkers in the PURE group (, Fig. S2). The relative abundance of Desulfovibiro increased significantly in the PURE group ().
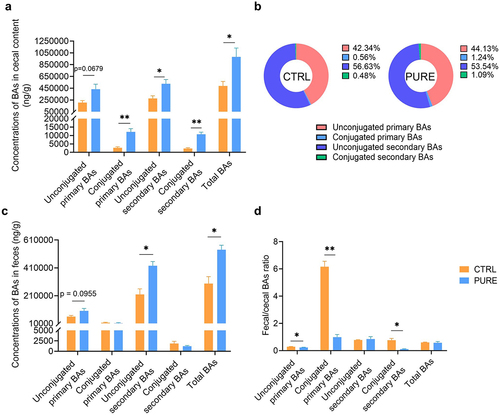
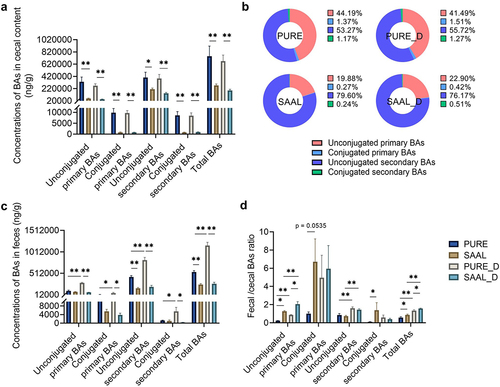
We then performed a targeted metabolomic study of the mouse cecal content to see how the gut metabolic profile changed due to different diets. In total, 650 metabolites were analyzed, and 348 metabolites were detected. The metabolic profiles of the CTRL and PURE group were very different and there were a large number of metabolites with significant difference (Fig. S3). Metabolites with significant difference were mainly consist of three groups: BAs, amino acids and their derivatives and carbohydrates and their derivatives. Difference in BA profiles between two groups was evident. The concentrations of unconjugated primary BAs, conjugated primary BAs, unconjugated secondary BAs, conjugated secondary BAs and total BAs all elevated in the PURE group () while the percentage composition of BAs of the two groups was similar (). Specifically, the content of primary BAs including beta-muricholic acid (β-MCA), cholic acid (CA), taurochenodeoxycholic acid (TCDCA), tauro-α-muricholic acid (α-TMCA) and tauro-β-muricholic acid (β-TMCA) and secondary BAs including 3-dehydrocholic acid (3-DHCA) (a.k.a. 3-oxocholic acid), 7-dehydrocholic acid (7-DHCA), 7-ketolithocholic acid (7-KLCA), deoxycholic acid (DCA), hyocholic acid (HCA), hyodeoxycholic acid (HDCA), lithocholic acid (LCA), omega-muricholic acid (ω-MCA), ursocholic acid (UCA), isodeoxycholic acid (IsoDCA), apocholic acid (APA), taurolithocholic acid (TLCA), tauro-ω-muricholic acid (ω-TMCA) and taurodeoxycholic acid (TDCA) elevated remarkably in the PURE group (Fig. S4). BA content excreted in the feces was also measured. The concentrations of unconjugated primary, unconjugated secondary BAs and total BAs in feces increased in the PURE group (). However, the fecal/cecal ratio of unconjugated primary BAs, conjugated primary BAs and conjugated secondary BAs in the PURE group was significantly lower compared with that in the CTRL group, indicating slower BA excretion rate in the PURE group (). These results together suggest that the gut BA pool was enlarged in the PURE group, which was mainly due to increased conjugated primary BAs reaching to the cecum and allowed more production of unconjugated primary BAs and secondary BAs through microbial modification. In short, purified diet altered the structure of gut microbiota and gut BA profile.
Figure 2. Cecal and fecal BA profile of mice fed with the chow diet and purified diet. (a) Concentrations of unconjugated primary BAs, conjugated primary BAs, unconjugated secondary BAs, conjugated secondary BAs and total BAs in mouse ceca. (b) Percentage composition of BAs in mouse ceca. Mean values of each BA type were used to draw the pie charts. (c) Concentrations of unconjugated primary BAs, conjugated primary BAs, unconjugated secondary BAs, conjugated secondary BAs and total BAs in mouse feces. (d) Fecal/cecal ratios of unconjugated primary BAs, conjugated primary BAs, unconjugated secondary BAs, conjugated secondary BAs and total BAs. n = 3 mice per group. Data are represented as the mean ± SEM, two-tailed Student t-test or Mann–Whitney test, *p < 0.05, **p < 0.01.
Purified diet led to compromised hepatic and gut barrier function
Previous studies have shown that increased abundance of Desulfovibrio in feces is associated with different stages of hepatic carcinoma including steatosis, steatohepatitis, liver fibrosis, and liver cirrhosis in both animal models and human patients.Citation30 In addition, altered gut BA profile has been shown in some intestinal and liver diseases.Citation1,Citation2,Citation5,Citation31 Therefore, liver and colonic functions were assessed to see if they were affected in our study. Basic physiological parameters including daily energy intake, body weight and liver/body weight ratio were compared between the two groups. Though the daily energy intake of mice in the PURE group was lower than that in the CTRL group, the body weight gain was higher in the PURE group, suggesting that purified diet was easier for mice to gain weight than the chow diet (Fig. S5A and C). Liver/body weight ratio decreased significantly in the PURE group, indicating smaller liver in mice fed with the purified diet (Fig. S5B). Serum alanine aminotransferase (ALT), aspartate aminotransferase (AST), and total cholesterol (TC) level did not differ significantly between the two groups (Fig. S5D-F). Hematoxylin and eosin staining (H&E) of liver sections demonstrated inflammatory infiltration in the PURE group (). The clear signals of the F4/80 and Ly6G immunohistochemical (IHC) staining of liver sections in the PURE group indicated accumulation of macrophages and neutrophils, respectively (). Results of transcriptomic study suggested very different gene expression patterns between mice in the two groups (Fig. S6A). A total of 570 up-regulated genes and 399 down-regulated genes were found in the PURE group when comparing with the CTRL group (Fig. S6B). Gene expression levels with absolute value of log2 of fold change larger than 0.58, Q value (adjusted p value) smaller than 0.05 were selected to conduct KEGG pathway enrichment analysis, and 30 pathways were annotated (). Among these pathways, glutathione metabolism and bile secretion were further analyzed. Gene Set Enrichment Analysis (GSEA) demonstrated that glutathione metabolism was down-regulated in the PURE group (). Gene expressions of glutathione S-transferases (GSTs) including family alpha (A), mu (M), pi (P) and theta (T) were significantly lower in the PURE group (). Since glutathione metabolism is highly involved in cytoprotection from oxidative stress, down-regulation of it indicated reduced hepatic cytoprotective ability in the PURE group. Bile secretion was also down-regulated in the PURE group (). Gene expressions of Cytochrome P450 family 7 subfamily A member 1 (Cyp7a1) and Cytochrome P450 family 8 subfamily B member 1 (Cyp8b1) significantly decreased while gene expression of nuclear receptor subfamily 1 group H member 4 (Nr1h4) increased in the PURE group (). Cyp7a1 is the rate-limiting enzyme in the classic pathway of BA synthesis, its down-regulation represents less BA production.Citation31 Nr1h4 encodes Farnesoid X-Activated Receptor (FXR), whose expression inhibits Cyp7a1 transcription.Citation31 The inhibition of BA synthesis could be a negative feedback to the elevated BA levels in the gut.
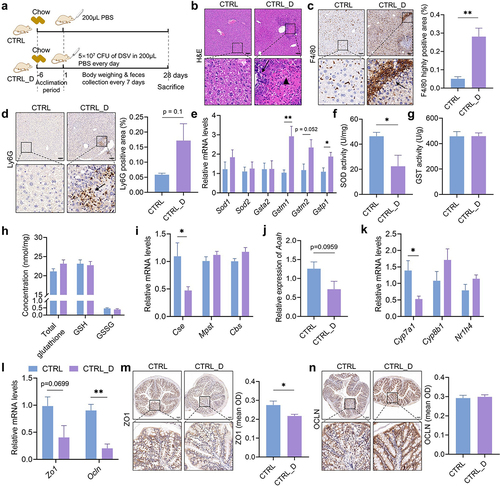
Figure 3. Hepatic and colonic histology and gene expressions in mice fed with the chow diet and purified diet. (a) H&E staining of liver sections. (b) IHC staining of F4/80 and quantification of highly positive areas of liver sections. (c) IHC staining of Ly6G and quantification of positive areas of liver sections. Black arrows point to the accumulation of immune cells. Scale bar: 100 μm. (d) KEGG enrichment analysis. Gene expression levels with absolute value of log2(FC) > 0.58, Qvalue (FDR corrected p value) < 0.05 in DESeq2 analysis were subject to hypergeometric test, pathway Qvalue (FDR corrected p value) < 0.1 were shown in the graph. (e) GSEA plot of glutathione metabolism. The leading edge gene subset (red lines) is on the right of the peak when ES < 0, representing up-regulation of this pathway in the CTRL group. (f) Expression levels of genes encoded Glutathione S-transferase (GST) family alpha (Gsta), mu (Gstm), pi (Gstp) and theta (Gstt). (g) GSEA plot of bile secretion. The leading edge gene subset (red lines) is on the right of the peak when ES < 0, representing up-regulation of this pathway in the CTRL group. (h) Gene expression levels of hepatic Cyp7a1, Cyp8b1 and Nr1h4 determined by RNA-seq. TPM: transcripts per million. (i) Relative mRNA expression of Zo1 and Ocln in the colon determined by qRT-PCR. (j-k) IHC staining of ZO1 and OCLN and quantification of mean optical density (OD) of the signal. Scale bar: 100 μm. n = 3–5 mice per group. Data are represented as mean ± SEM, two-tailed Student t-test or Mann–Whitney test, *p < 0.05, **p < 0.01.
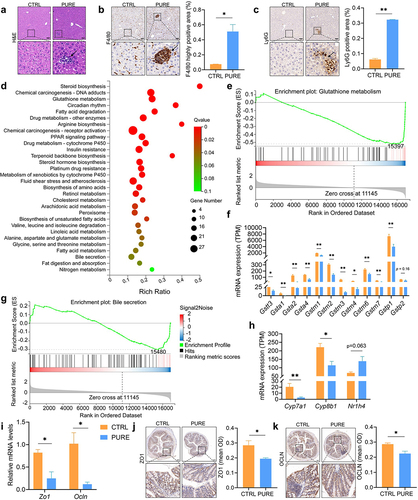
Gene expressions of Zona occludens 1 (Zo1) and Occludin (Ocln) were down-regulated in the mouse colon of the PURE group and the result of IHC staining corresponded to their gene expression levels, indicating compromised gut barrier functions (). Excessive BAs which are naturally toxic () and pro-inflammatory LPS produced by gram-negative Proteobacteria including potentially pathogenic Desulfovibrio and Helicobacter (Fig. S2) could damage the gut barrier, which may allow translocation of the toxic compounds including BAs and LPS themselves to the liver and therefore led to hepatic inflammation.
DSV administration led to damages of liver and gut barrier in mice fed with the chow diet
The previous experiment suggested that purified diet could change the gut BA profile and impact colonic and liver functions. Desulfovibrio was the genus that had the highest LDA score of LEfSe in the PURE group (Fig. S2). Previous studies have reported that the relative abundance of Desulfovibrio and Desulfovibrionales increases during different stages of liver diseases including hepatic steatosis, nonalcoholic steatohepatitis (NASH), hepatic fibrosis, hepatic cirrhosis and hepatic carcinoma.Citation30,Citation32 To assess if Desulfovibrio plays a key role in the alteration of gut BA profile and liver dysfunction, DSV was administrated to mice by oral gavage for 28 d (CTRL_D), and same volume of PBS was administrated to mice in the control group (CTRL) (). Mice in both groups were fed with the chow diet. DSV administration decreased daily energy intake, body weight and liver/body weight ratio (Fig. S8A-C). Serum ALT, AST and TC level did not differ significantly between the two groups (Fig. S8D-F). Inflammatory infiltration and hepatocellular necrosis were observed in H&E staining of the liver sections in the CTRL_D group (). F4/80 and Ly6G IHC staining demonstrated accumulation of macrophages and neutrophils, respectively ().
Figure 4. Hepatic and colonic histology and gene expressions in mice fed with the chow diet with or without DSV administration. (a) Experimental design. (b) H&E staining of liver sections. (c) IHC staining of F4/80 and quantification of highly positive areas of liver sections. (d) IHC staining of Ly6G and quantification of positive areas of liver sections. Scale bar: 100 μm. Black arrows point to the accumulation of immune cells in (b-d). Black triangle indicated hepatocellular necrosis in (b). (e) Relative mRNA levels of hepatic Sod1, Sod2, Gsta2, Gstm1, Gstm2 and Gstp1. (f) Hepatic SOD activity. (g) Hepatic GST activity. (h) Concentrations of hepatic total glutathione, reduced glutathione (GSH) and oxidized glutathione (GSSG). (i) Relative mRNA levels of hepatic Cse, Mpst and Cbs. (j) Relative mRNA levels of hepatic Aoah. (k) Relative mRNA levels of hepatic Cyp7a1, Cyp8b1 and Nr1h4. (l) Relative mRNA levels of colonic Zo1 and Ocln. (m-n) IHC staining of ZO1 and OCLN and quantification of mean OD of the signal. Scale bar: 100 μm. n = 3–5 mice per group. Data are represented as mean ± SEM, two-tailed Student t-test or Mann–Whitney test, *p < 0.05, **p < 0.01.
Expression levels of genes that carry antioxidant and detoxifying functions including Superoxide Dismutase 1 (Sod1), Sod2, Glutathione S-transferase alpha 2 (Gsta2), Glutathione S-transferase Mu1 (Gstm1), Gstm2 and Glutathione S-transferase pi 1 (Gstp1) were determined in the liver. Although the expression levels of Sod1 and Sod2 had no difference between the two groups (), the SOD activity showed a significant reduction in the CTRL_D group (), which indicated compromised antioxidant activity. Interestingly, gene expressions of Gstm1, Gstm2 and Gstp1 enhanced in the CTRL_D group, which could be a positive response to the enhanced oxidative stress due to DSV administration (). However, the total GST activity in the CTRL_D group did not get increased (). The concentration of reduced form of glutathione (GSH) and oxidized form of glutathione (GSSG) in the mouse liver was measured and did not differ between the two groups (). In addition, gene expressions of hydrogen sulfide (H2S) catalyzing enzymes including cystathionine β-synthase (Cbs), cystathionine γ-lyase (Cse) and 3-mercaptopyruvate sulfurtransferase (Mpst) were also determined in both liver and colon tissues since H2S is an important signaling gas, which has been reported for many health effects, including antioxidant and anti-inflammatory effect.Citation33 Because Desulfovibrio is a type of sulfur-reducing bacteria (SRB) which participates the sulfur metabolism in the gut and produces H2S,Citation34 we predict that Desulfovibrio may affect the endogenous H2S production, which is part of methionine metabolism. The results showed no difference in gene expression of these three enzymes in the colon between CTRL and CTRL_D (Fig. S9). However, gene expression of Cse significantly reduced in the mouse liver of the CTRL_D group (), indicating that DSV administration may inhibit the hepatic endogenous production of H2S. Hepatic gene expression of Acyloxyacyl hydrolase (Aoah) was determined to assess hepatic ability to detoxify LPS. AOAH is a host lipase mainly produced by macrophages, neutrophils and NK cells, which can inactivate LPS produced by gram-negative bacteria through deacylating the secondary fatty acyl chains of the lipid A in LPS and prevent further LPS – Toll-like receptor 4 (TLR4) inflammatory responses.Citation35,Citation36 Gene expression of Aoah is lower in the CTRL_D group than that in the CTRL group (p = 0.0959), which suggests reduced LPS-detoxifying ability (). Together, these results demonstrate that Desulfovibrio could induce hepatic injury due to reduced antioxidant and detoxifying capability.
Gut barrier function was also assessed. Gene expression of both Zo1 and Ocln was lower in the CTRL_D group than that in the CTRL group and the IHC staining of ZO1 showed significantly lower signal in the CTRL_D group (), indicating compromised gut barrier function in the CTRL_D group.
DSV administration elevated gut BA levels in mice fed with the chow diet
Metagenomic sequencing of mouse cecal content was performed to analyze the gut microbiota, which is more precise than 16s rRNA gene sequencing since it has higher sequencing depth. Higher Chao and Ace index indicated higher richness of gut microbiota in the CTRL group than CTRL_D group, while the Shannon and Simpson index had no difference between the two groups (). PCoA analysis could not separate the two groups (). LDA score of LEfSe showed that Staphylococcaceae, Staphylococcus, Ruminococcus gnavus and Mediterraneibacter were the biomarkers of the CTRL_D group, while Bacillus subtilis, Lactococcus and Streptococcaceae were the biomarkers of the CTRL group (Fig. S10). DSV administration did not increase the abundance of Desulfovibrio () and did not lead to a big alteration of the structure of gut microbiota, which is probably because DSV could only colonize in the gut transiently but not stably.
Figure 5. Gut microbiota and gut BA profile in mice fed with the chow diet with or without DSV administration. Gut microbiota was determined by shortgun metagenomic sequencing. (a) Alpha diversity. (b) PCoA (Bray-Curtis). (c) Cladogram of LEfSe. (d) Relative abundance of Desulfovibrio. (e) Concentrations of unconjugated primary BAs, conjugated primary BAs, unconjugated secondary BAs, conjugated secondary BAs and total BAs in mouse ceca. (f) Percentage composition of BAs in mouse ceca. Mean values of each BA type were used to draw the pie charts. (g) Concentrations of unconjugated primary BAs, conjugated primary BAs, unconjugated secondary BAs, conjugated secondary BAs and total BAs in mouse feces. (h) Fecal/cecal ratios of unconjugated primary BAs, conjugated primary BAs, unconjugated secondary BAs, conjugated secondary BAs and total BAs. n = 5 mice per group in (a-d); n = 3–5 mice per group in (e-h). Data are represented as the mean ± SEM, two-tailed Student t-test or Mann–Whitney test, *p < 0.05, **p < 0.01.
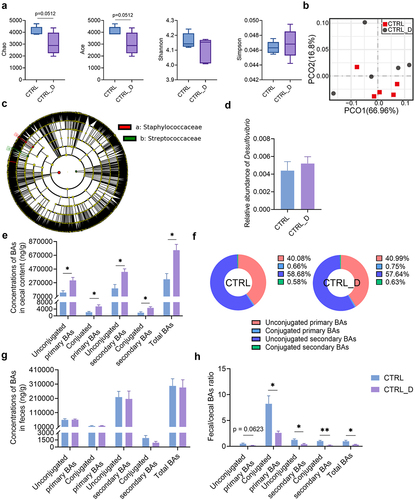
Nevertheless, DSV administration altered the gut BA profile remarkably. The concentration of unconjugated primary BAs, conjugated primary BAs, unconjugated secondary BAs, conjugated secondary BAs and total BAs all significantly increased in the mouse ceca of the CTRL_D group (). Staphylococcus and Ruminococcus gnavus, which were enriched in the CTRL_D group, both own bile salt hydrolases (BSH).Citation37 The expansion of BSH-expressing bacteria can lead to elevated levels of unconjugated primary BAs and the following secondary BAs. Specifically, concentrations of primary BAs including β-MCA, beta-ursodeoxycholic acid (β-UDCA), chenodeoxycholic acid (CDCA), ursodeoxycholic acid (UDCA), α-TMCA, β-TMCA and TCDCA and secondary BAs including 3-DHCA, 7-KLCA, HCA, ω-MCA, β-HDCA, DCA, HDCA, IsoDCA, isoLCA, LCA, ACA, murideoxycholic acid (MoCA), TDCA, TLCA, taurohyodeoxycholic acid (THDCA) and ω-TMCA were higher in the CTRL_D group than in the CTRL group (Fig. S11). Concentrations of BAs in the mouse feces were also determined. The content of four types of BAs and total BAs in the mouse feces of the CTRL and CTRL_D group was similar (). However, the fecal/cecal ratio of four types of BAs and total BAs in the CTRL_D group was much lower than that in the CTRL group (). The slower BA excretion rate corresponded with the enlarged gut BA pool in the CTRL_D group (). Moreover, elevated BA levels in the gut may induce a negative feedback that inhibited BA synthesis in the liver, which was supported by the reduced hepatic gene expression of Cyp7a1 ().
In short, the elevated gut BA levels together with the LPS produced by DSV were the risk factors that may damage the gut barrier and allow translocation of toxic compounds to the liver, and thus induced hepatic inflammation and hepatocellular necrosis.
SAAL diet protected the liver from damages arising from excess Desulfovibrio in the gut
To see if any dietary intervention could ameliorate the hepatic injury caused by excess Desulfovibrio, we compared the content of major nutrients in the chow diet and purified diet. The suggested contents of vitamins and minerals for chow diet are all higher than those in the purified diet, but their bioavailability is unknown since they are usually in the bound forms (Table S1). Therefore, we decided not to look at vitamins and minerals in this study. Though a few nutrients may account for the difference in gut microbiota and liver functions, we decided to focus on the amino acids because individual amino acids were added in the purified diet which made their bioavailability higher and may be easier to have impacts on host health. A major difference we found between the two diets is that the content of SAAs was much higher in the purified diet (Table S1). Therefore, to investigate whether restriction of SAAs may reverse the negative effects brought by purified diet and extra DSV administration, we fed mice with the SAAL diet, which used the same premixed feed as the NRC95 standard purified diet did and was isoenergetic to the purified diet (Table S1). The only difference was the reduced content of methionine (0.15%) and cystine (0%) in the SAAL diet (Table S1). Body weight of mice fed with the SAAL diet was significantly lower than that of mice fed with the purified diet no matter with or without DSV administration; in addition, the body weight of mice fed with the SAAL diet was decreasing during the experiment though the physical and mental condition of the mice looked normal (Fig. S12A). Liver/body weight ratio of mice in the SAAL and SAAL_D group was lower than that of mice in the PURE and PURE_D group, respectively (Fig. S12B). Lower body weight and lower liver/body weight ratio in mice fed with the SAAL diet was possibly due to the leanness-promoting effect of methionine restriction that reduces adiposity.Citation38 Daily energy intake corresponded with the body weight, in which mice fed with the purified diet had higher energy intake than mice fed with the SAAL diet did (Fig. S12C). However, DSV administration led to decreased daily energy intake in mice fed with the purified diet but increased daily energy intake in mice fed with the SAAL diet (Fig. S12C). Serum ALT and AST level did not show significant difference between PURE and SAAL group, between PURE and PURE_D group or between SAAL and SAAL_D group; however, the serum ALT level in the PURE_D group was higher than that in the SAAL_D group (Fig. S12D-E). Serum TC level was significantly higher in the PURE group and PURE_D group than SAAL group and SAAL_D group, respectively (Fig. S12F). H&E staining showed inflammatory infiltration in the PURE group but not in the SAAL group; DSV administration exacerbated the liver damages in the PURE_D group, where not only inflammatory infiltration, but also hepatocellular necrosis was observed (). Strong signals of F4/80 and Ly6G IHC staining were observed in both PURE and PURE_D group, suggesting accumulation of macrophages and neutrophils (). Surprisingly, DSV administration did not lead to any histological abnormalities in the SAAL_D group ().
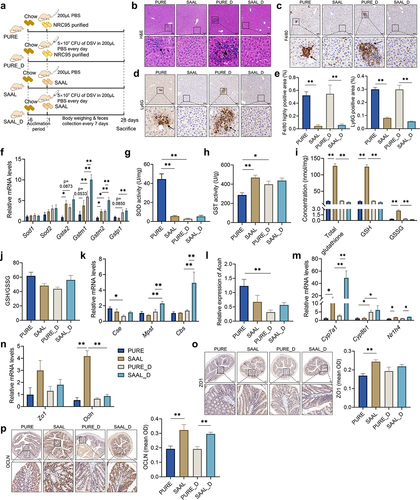
Figure 6. Hepatic and colonic histology and gene expressions in mice fed with the purified diet and SAAL diet with or without DSV administration. (a) Experimental design. (b) H&E staining of liver sections. (c–d) F4/80 and Ly6G IHC staining, respectively. Scale bar: 100 μm. Black arrows point to the accumulation of immune cells in (b–d). Black triangle indicated hepatocellular necrosis in (b). (e) Quantification of highly positive areas in IHC staining of F4/80 and positive areas in IHC staining of Ly6G. (f) Relative mRNA levels of hepatic Sod1, Sod2, Gsta2, Gstm1, Gstm2 and Gstp1. (g) Hepatic SOD activity. (h) Hepatic GST activity. (i) Concentrations of hepatic total glutathione, GSH and GSSG. (j) GSH/GSSG ratio. (k) Relative mRNA levels of hepatic Cse, Mpst and Cbs. (l) Relative mRNA levels of hepatic Aoah. (m) Relative mRNA levels of hepatic Cyp7a1, Cyp8b1 and Nr1h4. (n) Relative mRNA levels of colonic Zo1 and Ocln. (o) IHC staining of ZO1 and quantification of mean OD of the signal. (p) IHC staining of OCLN and quantification of mean OD of the signal. Scale bar: 100 μm. n = 3–5 mice per group. Data are represented as mean ± SEM, one-way ANOVA or Kruskal–Wallis test with FDR post hoc test (Two-stage step-up method of Benjamini, Krieger and Yekutieli), *p < 0.05, **p < 0.01.
SAAL diet protected the mouse liver through better gut barrier and higher hepatic antioxidant capability
The gene expressions of Zo1 and Ocln in the mouse colon were determined and their corresponding IHC stainings were also performed. The gene expression level of Ocln and the signal of ZO1 and OCLN IHC staining was remarkably higher in the SAAL group than that in the PURE group (). DSV administration did not make the already damaged gut barrier worse in the PURE_D group (). However, DSV administration disrupted the gut barrier in the SAAL_D group, in which a great decrease in the gene expression of Ocln was observed though IHC staining of OCLN did not show such significant reduction in the SAAL_D group (). Nevertheless, compared with the PURE_D group, SAAL_D group still possessed a better gut barrier since its IHC staining of OCLN was remarkably higher ().
Antioxidant and detoxifying capability was assessed to see if it was involved in the hepatoprotective effect of the SAAL diet. Though hepatic gene expression levels of Sod1 and Sod2 did not differ among four groups, a tremendous decrease in SOD activity in the PURE_D group compared with the PURE group was observed, suggesting impaired antioxidant ability (). Interestingly, the hepatic SOD activity in the SAAL group was much lower than that in the PURE group, probably due to the originally low oxidative stress in mice fed with the SAAL diet and DSV administration did not impair the SOD activity (). The gene expression levels of Gsta2 and Gstm2 were significantly higher in the SAAL group than those in the PURE group, corresponding to the higher overall GST activity in the SAAL group (). DSV administration activated the mRNA transcription of several GST genes in both PURE_D and SAAL_D group when comparing with that in the PURE and SAAL group, respectively, which could be a positive response to combat the elevated oxidative stress induced by extra DSV (). In addition, the gene expression levels of Gstm1 and Gstm2 in the SAAL_D group were remarkably higher than those in the PURE_D group, indicating even increased transcription of GST genes (). However, hepatic GST activity only enhanced significantly in the PURE_D group compared with that in the PURE group but not in the SAAL_D group compared with that in the SAAL group (). The possible reason could be that the GST activity was high enough to reach the upper limit of the enzyme activity in mice fed with SAAL diet and up-regulation of the gene expressions may not necessarily further enhance the enzyme activity. Concentration of GSH and GSSG and GSH/GSSG ratio were also determined. GSH level was much higher in the SAAL group than that in the PURE group (). However, after DSV administration, it decreased tremendously in the SAAL_D group (). Nevertheless, the GSSG level also decreased in the SAAL_D group, which made the GSH/GSSG ratio similar to that in the SAAL group (). This suggests that a large amount of GSH was not converted into GSSG but very possibly devoted as a substrate for GSTs to possess antioxidant and detoxifying function, which corresponded to the enhanced transcription of GST genes in the SAAL_D group.
Gene expressions of H2S catalyzing enzymes including Cbs, Cse and Mpst were determined in both liver and colon tissues. The gene expressions of the three enzymes in the colon did not differ significantly among the four groups (Fig. S17). The gene expressions of the three enzymes had no difference in the liver between the PURE and SAAL group (). DSV administration led to a decrease in hepatic gene expression of Cse in the PURE_D group compared with that in the PURE group (), indicating reduced hepatic H2S producing ability and may indicate lower antioxidant and anti-inflammatory capability.Citation33 On the contrary, DSV administration enhanced the gene expression of Mpst and Cbs in the SAAL_D group compared with that in the SAAL group (), indicating up-regulation of H2S producing enzymes and may represent higher antioxidant ability. Moreover, these results also implied that the hepatic endogenous H2S-producing metabolism in mice fed with SAAL diet responded very differently to the DSV challenge.
Furthermore, the gene expression of hepatic Aoah greatly decreased in the PURE_D group compared with that of the PURE group, indicating compromised LPS-detoxifying ability (). However, no significant difference was observed for the Aoah level between SAAL and SAAL_D group ().
In short, higher gut barrier integrity and higher hepatic antioxidant and detoxifying activity allowed mice fed with the SAAL diet to escape from liver damages due to excess Desulfovibrio in the gut.
SAAL diet led to distinct gut microbiota that was more resistant to DSV disturbance
Metagenomic sequencing was performed for mouse cecal content. Alpha diversity did not show any significant difference and PCoA analysis was not able to separate the microbial features between the PURE and SAAL group (). However, LEfSe demonstrated specific biomarkers in the PURE and SAAL group (, Fig. S13A). SAAL diet did not reduce the relative abundance of Desulfovibrio () but it led to less LPS-producing Helicobacter and Campylobacter species in the mouse gut, whose relative abundance was much higher in the PURE group (Fig. S13A).
Figure 7. Gut microbiota of mice fed with the purified diet and SAAL diet with or without DSV administration. (a) Alpha diversity. (b) PCoA (Bray-Curtis). (c) Cladogram of LEfSe. (d) Relative abundance of Desulfovibrio. n = 5 mice per group. Data are represented as the mean ± SEM, one-way ANOVA or Kruskal–Wallis test with FDR post hoc test (Two-stage step-up method of Benjamini, Krieger and Yekutieli),*p < 0.05.
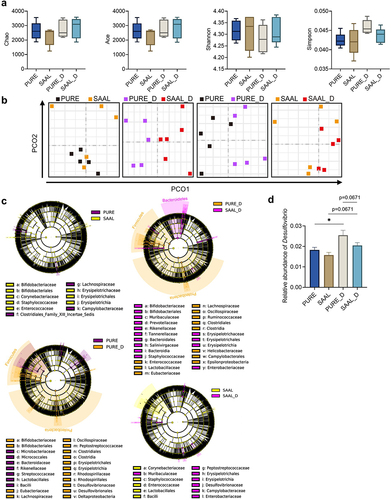
Though alpha diversity of the PURE and PURE_D group had no difference, PCoA analysis demonstrated different microbial features between PURE_D and PURE group with only one outlier in the PURE group (). The composition of the gut microbiota experienced a great shift in the PURE_D group, demonstrated by a large number of differential microbial biomarkers between PURE and PURE_D group (, Fig. S14A). Firmicutes/Bacteroidetes (F/B) ratio, Clostridia/Bacteroidia ratio and Clostridiales/Bacteroidales ratio was much higher in the PURE_D group than that in the PURE group (Fig. S15A-C). Higher F/B ratio has been associated with obesity.Citation39 DSV administration increased the relative abundance of Desulfovibrio in the PURE_D group (Fig. S14A, ) but at the species level, only D. fairfieldensis was the biomarker in the PURE_D group, which suggests that the administration of extra DSV (D. desulfuricans) may promote the growth of other Desulfovibrio species (Fig. S14A). In addition, DSV administration increased the relative abundance of other potentially pathogenic bacteria, including LPS-producing Helicobacter and toxin-producing Clostridioides Difficile, in the PURE_D group when comparing with the PURE group (Fig. S14A).
On the other hand, the impact of DSV administration on the structure of gut microbiota in mice fed with the SAAL diet was smaller. Alpha diversity did not differ between the SAAL_D and SAAL group and PCoA analysis did not separate these two groups (). Much fewer number of differential microbial biomarkers were determined between the SAAL_D and SAAL group when comparing with that between PURE_D and PURE group (Fig. S14). Similar to the case in the PURE_D group, DSV administration led to a significant increase in the relative abundance of other Desulfovibrio species instead of DSV itself, which included D. fairfieldensis and D. sp G11 in the SAAL_D group (Fig. S14B). In addition, DSV administration led to increase in LPS-producing Campylobacter and Helicobacter in the SAAL_D group (Fig. S14B).
PCoA analysis for PURE_D and SAAL_D group demonstrated very different microbial features between these two groups (). The number of differential microbial biomarkers between the PURE_D and SAAL_D group was more than that between the PURE and SAAL group (, Fig. S13). F/B ratio, Clostridia/Bacteroidia ratio and Clostridiales/Bacteroidales ratio was significantly higher in the PURE_D group than that in the SAAL_D group (Fig. S15A-C). The relative abundance of Desulfovibrio was higher in the PURE_D group than that in the SAAL_D group, in which D. fairfieldensis contributed a lot (, Fig. S13B). In addition, the abundance of other LPS-producing bacteria such as Helicobacter increased remarkably in the PURE_D group when comparing with the SAAL_D group (Fig. S13B). In short, gut microbiota of mice fed with the purified diet and SAAL diet responded very differently to the DSV disturbance. Normal purified diet was more supportive for the growth of Desulfovibrio after DSV administration and SAAL diet made the gut more resistant to the DSV disturbance with less alteration of the gut microbiota.
SAAL diet reversed the elevated gut BA levels due to excess Desulfovibrio in the gut
Compared with the PURE group, the concentrations of unconjugated primary BAs, conjugated primary BAs, unconjugated secondary BAs, conjugated secondary BAs and total BAs were all significantly lower in the mouse ceca of the SAAL group, which was similarly low to the cecal BA levels in the CTRL group in our first and second experiment (). Administration of extra DSV to mice fed with the SAAL diet did not elevate the BA levels, which means that the BAs were still maintained at low levels (). DSV administration to mice fed with the purified diet also did not further increase the BA levels (), but disturbed BA homeostasis was already shown in mice fed with the purified diet only in our first experiment. Therefore, the BA levels in the PURE_D group were still significantly elevated compared with those in the SAAL_D group (). Specifically, the concentrations of primary BAs including CDCA, β-MCA, β-UDCA, UDCA, TCDCA, α-TMCA and β-TMCA and secondary BAs including DCA, IsoDCA, IsoLCA, UCA, ω-MCA, β-HDCA, HDCA, LCA, MoCA, TDCA, THDCA, TLCA and ω-TMCA all remarkably decreased in the SAAL and SAAL_D group when comparing with the PURE and PURE_D group, respectively (Fig. S16). Interestingly, the percentage composition of the gut BA profile in mice fed with the SAAL diet was very different from that in mice fed with the purified diet (). The percentage of unconjugated primary BAs was much lower, but the percentage of unconjugated secondary BAs was much higher in the SAAL and SAAL_D group than that in the PURE and PURE_D group, respectively ().
Figure 8. Cecal and fecal BA profile of mice fed with purified diet and SAAL diet with or without DSV administration. (a) Concentrations of unconjugated primary BAs, conjugated primary BAs, unconjugated secondary BAs, conjugated secondary BAs and total BAs in mouse ceca. (b) Percentage composition of BAs in mouse ceca. Mean values of each BA type were used to draw the pie charts. (c) Concentrations of unconjugated primary BAs, conjugated primary BAs, unconjugated secondary BAs, conjugated secondary BAs and total BAs in mouse feces. (d) Fecal/cecal ratios of unconjugated primary BAs, conjugated primary BAs, unconjugated secondary BAs, conjugated secondary BAs and total BAs. n = 3–6 mice per group. Data are represented as the mean ± SEM, one-way ANOVA or Kruskal–Wallis test with FDR post hoc test (Two-stage step-up method of Benjamini, Krieger and Yekutieli), *p < 0.05, **p < 0.01.
BA levels in mouse feces were also measured. The concentration of unconjugated secondary BAs was significantly lower in the SAAL group than that in the PURE group; the concentrations of four types of BAs and total BAs were all remarkably higher in the PURE_D group when comparing with the PURE group (). Compared with the PURE_D group, concentrations of four types of BAs and total BAs in feces were all significantly lower in the SAAL_D group (). When looking at the fecal/cecal ratio, it was much higher for unconjugated primary BAs, conjugated primary BAs, conjugated secondary BAs and total BAs in the SAAL group compared with the PURE group, indicating higher BA excretion rate (). DSV administration led to increased BA excretion rate in both PURE_D and SAAL_D group when comparing with PURE and SAAL group, respectively, indicated by higher fecal/cecal ratio of unconjugated primary BAs, unconjugated secondary BAs and total BAs (). Moreover, the significantly higher fecal/cecal ratio of unconjugated primary BAs and total BAs in the SAAL_D group than that in the PURE_D group suggested even higher BA excretion rate in the SAAL_D group (). The remarkably enhanced BA excretion rate of unconjugated primary BAs in the SAAL and SAAL_D group explained the relative lower percentage of unconjugated primary BAs but relatively higher percentage of unconjugated secondary BAs in the total gut BA pool ().
Hepatic gene expression levels of Cyp7a1, Cyp8b1 and Nr1h4 were assessed to see the effect of SAAL diet on host BA production. The gene expression level of hepatic Cyp7a1 significantly increased in mice fed with the SAAL diet compared with that of mice fed with the purified diet no matter DSV was administrated or not (). Higher Cyp7a1 level indicated more active BA synthesis, which compensated the BA loss due to increased BA excretion rate in the SAAL and SAAL_D group when comparing with the PURE and PURE_D group, respectively (). Though the gene expression of Cyp7a1 did not increase in the PURE_D group compared with that in the PURE group, the expression of the downstream gene Cyp8b1 increased in response to higher BA excretion rate in the PURE_D group (). Higher gene expression of Cyp7a1 was found in the SAAL_D group than that in the SAAL group to compensate the quicker BA loss due to increased BA excretion rate in the SAAL_D group (). Although the expression level of Nr1h4 in SAAL and SAAL_D group was higher than that in the PURE and PURE_D group, respectively (), which should inhibit the expression of Cyp7a1, the expression level of Cyp7a1 was still higher in mice fed with the SAAL diet, which suggested that other regulations may be involved. Higher excretion rate of BAs in feces together with increased hepatic BA synthesis to compensate the loss led to the unchanged BA levels in both PURE_D and SAAL_D group after DSV administration.
Excess Desulfovibrio in human gut microbiota elevated the production of unconjugated secondary BAs
To see whether the excess DSV could also alter the human gut BA profile, fecal samples of four healthy volunteers were collected and fermented with four primary BAs (). 16s rRNA gene sequencing was performed to determine if there was any change in microbial structure after adding extra DSV in the ex vivo bacterial culture. Increased Shannon index and decreased Simpson index indicated increased diversity of bacteria in the DB group (Fig. S18). Increased relative abundance of Desulfovibrio in the DB group was within expectation since extra DSV was added in the samples (). The relative abundance of phylum Firmicutes, class Clostridia and order Clostridiales also increased significantly in the DB group ().
Figure 9. Alterations of microbial composition and BA profile in ex vivo fermentation culture of human fecal bacteria with four conjugated primary BAs. (a) Experimental design. (b) Relative abundance of differential bacterial phyla (p < 0.1). (c) Relative abundance of differential bacterial classes (p < 0.1). (d) Relative abundance of differential bacterial orders (p < 0.1). (e) Relative abundance of differential bacterial families (p < 0.1). (f) Relative abundance of differential bacterial genera (p < 0.1). (g) Log of the concentration of unconjugated primary and unconjugated secondary BAs in the B and DB group. n = 4 human fecal samples per group, one-tailed paired t-test or Wilcoxon matched-pairs signed rank test, *p < 0.05, **p < 0.01. (h) Concentration of unconjugated primary and secondary BAs in the KB and M group (concentration instead of log of concentration was used for the y-axis because zero value was present). Data are represented as the mean ± SEM, two-tailed Student t-test.
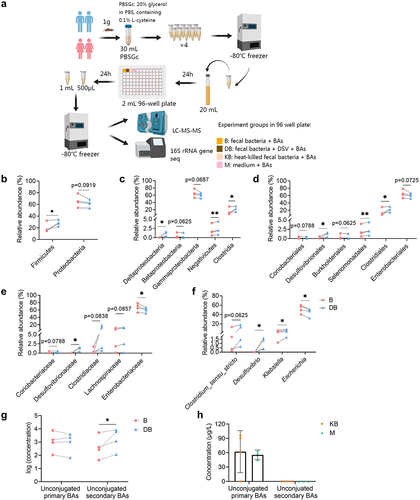
The microbial BA metabolic activity including deconjugation and hydroxylation of primary BAs was determined by quantification of unconjugated primary BAs including CA and CDCA and commonly found unconjugated secondary BAs including LCA, DCA, UDCA and HDCA in the fecal bacterial culture (, Fig. S19). When extra DSV was added in the fecal bacteria, the total concentration of unconjugated secondary BAs increased significantly in the DB group, which indicated more active bacterial BA metabolism (). Studies have suggested that a few bacteria belonging to order Clostridiales have active BA metabolism which own both bai operons possessing activity of 7α-dehydroxylation and hydroxysteroid dehydrogenases (HSDHs) possessing activity of epimerization and oxidation.Citation40,Citation41 The increased relative abundance of Clostridiales in the DB group could partially explained the increased unconjugated secondary BA level. Last but not least, only a small amount of unconjugated primary BAs (CA only) was detected in the two negative controls, probably due to some nonenzymatic breakdown or impurity of the reagents. No unconjugated secondary BAs were detected in the negative controls, indicating that only live bacteria own the enzymatic activity to produce secondary BAs ().
DSV modified gut BA pool and inhibited Cyp7a1 expression in germ-free mice
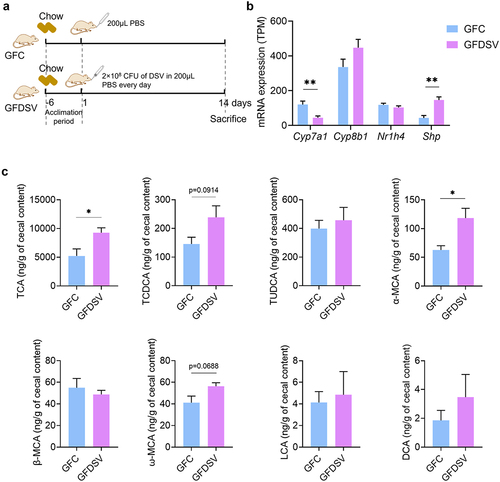
To assess if Desulfovibrio itself could affect host BA metabolism, 2 × 10⁸ CFU of DSV was administrated to germ-free mice for 14 d (). The levels of primary BAs including TCA, TCDCA, TUDCA, GCA, GCDCA, GUDCA, CA, CDCA, α-MCA and β-MCA and secondary BAs including ω-MCA, DCA, LCA and HDCA were determined in the mouse cecal content. Gut BA profile of germ-free mice was quite different compared to that of conventional mice. Conjugated primary BAs including TCA, TCDCA and TUDCA were detected, while GCA, GCDCA and GUDCA were not detectable in the GFC group (). Only minimal concentration of unconjugated primary BAs including α-MCA and β-MCA were detected, while CA, CDCA and UDCA were not detectable (). In addition, the detected concentration of secondary BAs, including LCA and DCA, was negligible and only a minimal concentration of ω-MCA was detected in the GFC group (). These results suggested that deconjugation of conjugated primary BAs and production of secondary BAs was almost impossible in mice without gut microbiota, which corresponds with the results of previous researches.Citation42,Citation43 DSV administration increased the concentration of TCA and TCDCA in the GFDSV group (). The concentration of α-MCA and ω-MCA also increased in the GFDSV group (), suggesting that Desulfovibrio may possess the ability to deconjugate conjugated primary BAs and convert the unconjugated primary BAs to unconjugated secondary BAs (). Gene expression of hepatic Cyp7a1 was reduced in GFDSV group, which could be the negative feedback to the elevated TCA and TCDCA level in the gut (). The gene expression of Nr1h4 did not differ between GFDSV and GFC group but the gene expression of small heterodimer partner (Shp) increased, whose expression is induced by FXR (encoded by Nr1h4) and subsequently inhibits the expression of Cyp7a131. In short, Desulfovibrio itself may own the ability to metabolize BAs and affect the host BA metabolism. Nevertheless, the significantly altered gut BA profile in conventional mice still rely on the interaction between Desulfovibrio and other gut microbes.
Figure 10. Effect of DSV on host BA synthesis and gut BA profile in germ-free mice. (a) mRNA expression of Cyp7a1, Cyp8b1, Nr1h4 and Shp determined by RNA-seq. (b) Concentration of TCA, TCDCA, TUDCA, α-MCA, β-MCA, ω-MCA, LCA and DCA. GCA, GCDCA, GUDCA, CA, CDCA and HDCA were under detection limit in both groups. UDCA was also not shown because it was detected in the GFDSV group but not detected in the GFC group. n = 4 mice per group. Data are represented as the mean ± SEM, two-tailed Student t-test, *p < 0.05, **p < 0.01.
Discussion
Diet has always been the study focus for gut–liver axis since it plays an important role in maintaining homeostasis of gut microbiota and gut metabolism. Dysbiosis and dysregulated gut metabolism affect the gut barrier function and determine the endotoxic and oxidative stress level in the liver through translocation of pathogen-associated molecular patterns (PAMPs) including bacteria and bacterial products.Citation1,Citation2,Citation11 In this study, we first showed that compared with the standard chow diet, the purified diet significantly shifted the structure of gut microbiota, enriched Desulfovibrio, enhanced gut BA concentrations, damaged the gut barrier, led to liver inflammation, and altered liver functions in mice. We then demonstrated that extra DSV administration to mice fed with the chow diet led to hepatic inflammatory infiltration and hepatocellular necrosis, impaired the hepatic antioxidant ability and significantly increased both primary and secondary BAs in the gut. Next, our results showed that SAAL diet protected the liver through enhanced hepatic detoxifying and antioxidant ability, reversed the elevated gut BA levels and reduced the number of LPS-producing bacteria. Even with DSV administration, the protective effect of SAAL diet still existed. Furthermore, we demonstrated that extra Desulfovibrio altered the microbial BA metabolism in human gut through ex vivo fermentation of human fecal bacteria with conjugated primary BAs. Increased production of unconjugated secondary BAs and increased relative abundance of Clostridiales, which contains a number of species with active BA metabolizing activity, were detected in the bacterial culture after adding extra DSV in. Last but not least, we also revealed that Desulfovibrio itself could metabolize BAs and affect the host BA metabolism by inhibiting hepatic Cyp7a1 in germ-free mice fed with the chow diet. Nevertheless, the effect of Desulfovibrio on host and gut BA metabolism was more prominent when gut microbiota was present.
When digging in the reasons for liver injury caused by excess Desulfovibrio due to diet or artificial DSV administration, the shared risk factors are increased number of LPS-producing gram-negative bacteria, elevated level of toxic BAs in the gut and reduced antioxidant ability in the liver. Increased relative abundance of LPS-producing Deltaproteobacteria such as Desulfovibrio and Helicobacter was observed in mice fed with purified diet either with or without DSV administration. Though DSV administration did not lead to a final increase of the relative abundance of Desulfovibrio in mice fed with the chow diet, possibly due to its transient presence, LPS produced by DSV was still able to pose its effects. Studies have shown that LPS activates immune cells such as macrophages and neutrophils and other types of cells such as hepatic stellate cells (HSCs) to secret the proinflammatory cytokines in different liver diseases including NAFLD, NASH, ALD, liver fibrosis, liver cirrhosis and acute liver injury.Citation1,Citation2,Citation44–51 In addition, LPS can induce inflammatory signaling pathways in the gut, which damages the gut barrier and eventually leads to systemic low-grade inflammation.Citation1,Citation11,Citation45,Citation46
BAs, as the other risk factor for liver injury, are naturally toxic and hydrophobicity of BAs decides their toxicity.Citation31 BAs help maintain the healthy gut, regulate host energy metabolism and modulate immune responses when in appropriate physiological concentrations.Citation1,Citation2,Citation5,Citation31,Citation40 However, excessive BAs can bring adverse effects. Unconjugated BAs are usually more hydrophobic than their corresponding conjugated BAs and secondary BAs are often more hydrophobic than their corresponding primary BAs.Citation40 Hydrophobic BAs may pose more noxious effects.Citation40 Increased secondary BAs including DCA and LCA in the gut has been found in colitis and colorectal cancer models, which induce inflammatory signaling pathways, increase the oxidative damages to cellular DNA and mitochondria and activate the apoptotic pathways.Citation52–56 Studies have also demonstrated that excessive BAs, especially the more toxic hydrophobic ones, are detrimental to the liver cells.Citation57 Disrupted BA homeostasis has been shown in many liver diseases including cholestasis, NAFLD, NASH and hepatocellular carcinoma, in which BAs can initiate the inflammatory responses such as recruiting immune cells, inducing secretion of cytokines from Kupffer cells and chemokines from hepatocytes, directly upregulating the transcriptional factor early growth response factor 1 to initiate the inflammatory signaling, promoting transformation of antigen presenting cells from tolerogenic phenotype to immunogenic phenotype, and activating HSCs to produce pro-inflammatory and tumor-promoting mediators.Citation2,Citation31,Citation57–66 In our study, either mice fed with purified diet or mice fed with chow diet and with DSV administration had significantly elevated content of BAs, especially the content of more toxic secondary BAs in the gut. In short, proinflammatory LPS produced by gram-negative bacteria and significantly elevated BA levels disrupted the gut barrier integrity, which may allow translocation of toxic substances including LPS and BAs themselves together with other microbial metabolites to the liver and lead to liver injury.
Either mice fed with purified diet or mice fed with chow diet together with DSV administration or mice fed with purified diet together with DSV administration all had lower hepatic antioxidant and detoxifying ability. Purified diet-fed mice had remarkably lower gene expressions of GSTs while chow diet-fed mice with DSV administration or purified diet-fed mice with DSV administration had significantly lower SOD activity, lower H2S producing ability and lower LPS-detoxifying ability. GSTs play an important role in cell protection against multiple exogenous and endogenous toxic compounds, xenobiotics, products from oxidative metabolism, which prevents cells from oxidative damages through conjugation activity with GSH to reduce the toxic level of the compounds and facilitate their discharge from the cells.Citation67,Citation68 Besides classical GSH conjugation activity, GSTs also possess glutathione peroxidase activity that can reduce the organic hydroperoxides produced by lipid peroxidation and oxidative damages of DNA.Citation67 Endogenous H2S, as an important signaling gas, has been reported for its antioxidant and anti-inflammatory effect.Citation33 The reason that we measured the endogenous H2S producing ability was because of its possible connection with Desulfovibrio. Desulfovibrio can either directly degrades cysteine or reduces sulfides and sulfates generated from oxidation of organosulfur sources including methionine, cysteine, taurine, etc., by sulfur-oxidizing bacteria in the gut and produces H2S as a byproduct.Citation34 Li et al. have shown that DSV administration to tumor-bearing mice increased the serum SAM concentration.Citation69 Since Desulfovibrio could affect methionine metabolism and produces H2S as well, we predict that Desulfovibrio may affect the endogenous H2S production. Therefore, we measured the gene expression levels of three enzymes that catalyze H2S production in transsulfuration pathway.
Restricted intake of SAAs was effective in reducing the BA levels in the gut, protecting the gut barrier and preventing liver damages though it did not reduce the abundance of Desulfovibrio in the gut. Obviously, SAAL diet exerted its effects through certain mechanisms but not through reducing Desulfovibrio abundance in this case. Previous studies have shown that methionine-restriction (MR) is beneficial for metabolic health and extends the lifespan by reducing adiposity, increasing insulin sensitivity, improving lipid metabolism, reducing oxidative stress and inflammation.Citation38 S-adenosylmethionine (SAM) generated from methionine has been shown to activate mTORC1, a subunit of mTOR which regulates the cell growth and metabolic response to nutrition.Citation38 Activation of mTORC1 after feeding increases phosphorylation of ubiquitin-specific peptidase 20 (USP20) which stabilizes HMG-CoA reductase (HMGCR) and therefore promotes cholesterol synthesis.Citation70 MR reduces the SAM formation and therefore inhibits mTORC1, which can de-stabilize HMGCR and reduce cholesterol formation. Since cholesterol is the substrate for BA synthesis, its reduction will lead to less BA production. In our study, serum TC level was significantly lower in the SAAL group compared with the PURE group (Fig. S12F). This also explains the much lower cecal BA levels in the SAAL group than that in the PURE group (). In addition, SAAL diet also led to decreased abundance of LPS-producing bacteria including Helicobacter and Campylobacter. Reduced content of toxic BAs and less LPS-producing bacteria allowed healthier gut barrier and prevented translocation of toxic compounds from gut to the liver. Besides the effect of SAAL diet on lowering the gut BA levels and protecting the gut barrier, which indirectly prevented liver from damages, another important mechanism for SAAL diet to protect the liver is the enhanced hepatic antioxidant and detoxifying capability. Higher hepatic gene expressions and enzyme activity of GSTs and higher GSH storage in the SAAL group helped prevent liver damages even the relative abundance of Desulfovibrio did not decrease in the SAAL group. Moreover, SAAL diet still protected the liver from damages after DSV administration due to orginally high reservoir of GSH which can provide enough substrate for GSTs to exhibit antioxidant and detoxifying function. In addition, DSV administration also led to enhanced gene expression of H2S catalyzing enzymes in the SAAL_D group and may provide higher antioxidant capability.
Nevertheless, there are still limitations in this study. How Desulfovibrio acts in synergy with SAAs to modulate the BA metabolism needs to be further investigated. In addition, the human fecal bacteria used in the ex vivo study may not represent the true microbiota in the human intestine since in fact the microbiota varied along the intestine and is very different from that in the feces.Citation28 However, fecal samples are more convenient to obtain and easier to comply the study ethics; therefore, fecal samples are still commonly used to study the human gut microbiota. In the future, the ingestible devices designed by Shalon et al. that can collect fluid along the intestine can be used to carry out the studies related to human gut microbiota, which can provide more accurate results.Citation28 Last but not least, only D. desulfuricans was used as a representative species of Desulfovibrio in our study because previous research shows that the diversity of Desulfovibrio species decreases and D. desulfuricans becomes the most dominant one in patients with liver cirrhosis.Citation71 Our study also showed that DSV may promote the growth of D. fairfieldensis, which may be an invasive and pathogenic genus and can cause severe bacteremia.Citation72 D. fairfieldensis-derived outer membrane vesicles are found to damage the intestinal epithelial barrier and activate intrinsic inflammation.Citation73 The relationship between D. desulfuricans with other Desulfovibrio species are also worth investigating in the future to evaluate their different impacts on liver health.
Overall, our research suggests that dietary factors play an important role in liver health through gut–liver axis. Desulfovibrio was one of the key microbes that could partially explain the elevated gut BA levels and hepatic injury. Alteration of gut BA profile due to excess Desulfovibrio was partially verified in the ex vivo fermentation of human fecal microbiota with conjugated primary BAs, where extra Desulfovibrio enhanced production of secondary BAs. Although Desulfovibrio itself was shown to affect the BA metabolism in germ-free mice, its effect was magnified when gut microbiota was present in the conventional mice. Restricted intake of SAAs prevented hepatic injury through enhanced detoxifying and antioxidant ability and reversed the altered gut BA profile caused by excess Desulfovibrio. SAAL diet may become an effective dietary intervention in the future for hepatic injury associated with high abundance of Desulfovibrio in the gut.
Author contributions
L. Zhou, Y. Geng and Z. Xu conceived and designed the study.
L. Zhou, G. Lu, Y. Nie and Y. Ren performed the experiments.
L. Zhou performed the data analysis and bioinformatics analysis.
L. Zhou wrote the manuscript. Y. Geng, Z. Xu and J. Shi revised the manuscript.
Y. Geng and Y. Xue supervised the study and acquired the funding for it.
Supplemental Material
Download MS Word (17.6 MB)Disclosure statement
No potential conflict of interest was reported by the author(s).
Data availability statement
All the data are available upon request. The raw data of 16s rRNA gene sequencing generated in the first animal experiment and ex vivo experiment of fermentation of human fecal bacteria with bile acids in this study have been deposited at National Center for Biotechnology Information (BioProject ID: PRJNA1066713 and PRJNA1067359, respectively). The raw data of metagenomic sequencing in the second and third animal experiment have been deposited at National Center for Biotechnology Information (BioProject ID: PRJNA1068753). RNA-seq data of mouse livers in the first and fourth animal experiment have been uploaded to National Center for Biotechnology Information (BioProject ID: PRJNA1067360 and PRJNA600663, respectively).
Supplementary material
Supplemental data for this article can be accessed online at https://doi.org/10.1080/19490976.2024.2370634.
Additional information
Funding
References
- Tilg H, Adolph TE, Trauner M. Gut-liver axis: Pathophysiological concepts and clinical implications. Cell Metab. 2022;34(11):1700–28. doi:10.1016/j.cmet.2022.09.017.
- Tripathi A, Debelius J, Brenner DA, Karin M, Loomba R, Schnabl B, Knight R. The gut–liver axis and the intersection with the microbiome. Nat Rev Gastroenterol Hepatol. 2018;15(7):397–411. doi:10.1038/s41575-018-0011-z.
- Albillos A, de Gottardi A, Rescigno M. The gut-liver axis in liver disease: Pathophysiological basis for therapy. J Hepatol. 2020;72(3):558–577. doi:10.1016/j.jhep.2019.10.003.
- Wahlström A, Sayin S, Marschall I, H -U, Bäckhed F. Intestinal crosstalk between bile acids and microbiota and its impact on host metabolism. Cell Metab. 2016;24(1):41–50. doi:10.1016/j.cmet.2016.05.005.
- Collins SL, Stine JG, Bisanz JE, Okafor CD, Patterson AD. Bile acids and the gut microbiota: metabolic interactions and impacts on disease. Nat Rev Microbiol. 2023;21(4):236–247. doi:10.1038/s41579-022-00805-x.
- Tilg H, Moschen AR, Kaneider NC. Pathways of liver injury in alcoholic liver disease. J Hepatol. 2011;55(5):1159–1161. doi:10.1016/j.jhep.2011.05.015.
- Tilg H, Zmora N, Adolph TE, Elinav E. The intestinal microbiota fuelling metabolic inflammation. Nat Rev Immunol. 2020;20(1):40–54. doi:10.1038/s41577-019-0198-4.
- Trebicka J, Macnaughtan J, Schnabl B, Shawcross DL, Bajaj JS. The microbiota in cirrhosis and its role in hepatic decompensation. J Hepatol. 2021;75(1):S67–S81. doi:10.1016/j.jhep.2020.11.013.
- Carpino G, Del Ben M, Pastori D, Carnevale R, Baratta F, Overi D, Francis H, Cardinale V, Onori P, Safarikia S, et al. Increased Liver Localization of Lipopolysaccharides in Human and Experimental NAFLD. Hepatology. 2020;72(2):470–485. doi:10.1002/hep.31056.
- Hoyles L, Fernández-Real J-M, Federici M, Serino M, Abbott J, Charpentier J, Heymes C, Luque JL, Anthony E, Barton RH, et al. Molecular phenomics and metagenomics of hepatic steatosis in non-diabetic obese women. Nat Med. 2018;24(7):1070–1080. doi:10.1038/s41591-018-0061-3.
- Fan Y, Pedersen O. Gut microbiota in human metabolic health and disease. Nat Rev Microbiol. 2021;19(1):55–71. doi:10.1038/s41579-020-0433-9.
- Cani PD, Van Hul M. Mediterranean diet, gut microbiota and health: when age and calories do not add up! Gut. 2020;69(7):1167–1168. doi:10.1136/gutjnl-2020-320781.
- Bárcena C, Quirós PM, Durand S, Mayoral P, Rodríguez F, Caravia XM, Mariño G, Garabaya C, Fernández-García MT, Kroemer G, et al. Methionine Restriction Extends Lifespan in Progeroid Mice and Alters Lipid and Bile Acid Metabolism. Cell Rep. 2018;24(9):2392–2403. doi:10.1016/j.celrep.2018.07.089.
- Green CL, Lamming DW, Fontana L. Molecular mechanisms of dietary restriction promoting health and longevity. Nat Rev Mol Cell Biol. 2022;23(1):56–73. doi:10.1038/s41580-021-00411-4.
- Miller RA, Buehner G, Chang Y, Harper JM, Sigler R, Smith‐Wheelock M. Methionine-deficient diet extends mouse lifespan, slows immune and lens aging, alters glucose, T4, IGF-I and insulin levels, and increases hepatocyte MIF levels and stress resistance. Aging Cell. 2005;4(3):119–125. doi:10.1111/j.1474-9726.2005.00152.x.
- Ren B, Wang L, Mulati A, Liu Y, Liu Z, Liu X. Methionine Restriction Improves Gut Barrier Function by Reshaping Diurnal Rhythms of Inflammation-Related Microbes in Aged Mice. Front Nutr. 2021;8:746592. doi:10.3389/fnut.2021.746592.
- National Research Council (US) Subcommittee on Laboratory Animal Nutrition. Nutrient requirements of laboratory animals. Fourth Revised ed. Washington (DC): National Academies Press (US); 1995. doi:10.17226/4758.
- Pellizzon MA, Ricci MR. The common use of improper control diets in diet-induced metabolic disease research confounds data interpretation: the fiber factor. Nutr Metab (Lond). 2018;15(3). doi:10.1186/s12986-018-0243-5.
- Daniel N, Rossi Perazza L, Varin TV, Trottier J, Marcotte B, St-Pierre P, Barbier O, Chassaing B, Marette A. Dietary fat and low fiber in purified diets differently impact the gut-liver axis to promote obesity-linked metabolic impairments. Am J Physiol Gastrointest Liver Physiol. 2021;320(6):G1014–G1033. doi:10.1152/ajpgi.00028.2021.
- Hou Y, Wei W, Guan X, Liu Y, Bian G, He D, Fan Q, Cai X, Zhang Y, Wang G, et al. A diet-microbial metabolism feedforward loop modulates intestinal stem cell renewal in the stressed gut. Nat Commun. 2021;12(1):271. doi:10.1038/s41467-020-20673-4.
- Goto H, Takemura N, Ogasawara T, Sasajima N, Watanabe J, Ito H, Morita T, Sonoyama K. Effects of Fructo-Oligosaccharide on DSS-Induced colitis differ in mice fed nonpurified and purified diets. The Journal Of Nutrition. 2010;140(12):2121–2127. doi:10.3945/jn.110.125948.
- Boussenna A, Goncalves-Mendes N, Joubert-Zakeyh J, Pereira B, Fraisse D, Vasson M-P, Texier O, Felgines C. Impact of basal diet on dextran sodium sulphate (DSS)-induced colitis in rats. Eur J Nutr. 2015;54(8):1217–1227. doi:10.1007/s00394-014-0800-2.
- Koleva P, Ketabi A, Valcheva R, Ganzle MG, Dieleman LA. Chemically defined diet alters the protective properties of fructo-oligosaccharides and isomalto-oligosaccharides in HLA-B27 transgenic rats. PLoS One. 2014;9(11):e111717. doi:10.1371/journal.pone.0111717.
- Miles JP, Zou J, Kumar M-V, Pellizzon M, Ulman E, Ricci M, Gewirtz AT, Chassaing B. Supplementation of low- and high-fat diets with fermentable fiber exacerbates severity of DSS-induced acute colitis. Inflamm Bowel Dis. 2017;23(7):1133–1143. doi:10.1097/MIB.0000000000001155.
- Gonzalez-Blazquez R, Alcalá M, Fernández-Alfonso MS, Villa-Valverde P, Viana M, Gil-Ortega M, Somoza B. Relevance of control diet choice in metabolic studies: impact in glucose homeostasis and vascular function. Sci Rep. 2020;10(1):2902. doi:10.1038/s41598-020-59674-0.
- Javdan B, Lopez JG, Chankhamjon P, Lee YCJ, Hull R, Wu Q, Wang X, Chatterjee S, Donia MS. Personalized mapping of drug metabolism by the human gut microbiome. Cell. 2020;181(7):1661–1679 e1622. doi:10.1016/j.cell.2020.05.001.
- Xiao L, Feng Q, Liang S, Sonne SB, Xia Z, Qiu X, Li X, Long H, Zhang J, Zhang D, et al. A catalog of the mouse gut metagenome. Nat Biotechnol. 2015;33(10):1103–1108. doi:10.1038/nbt.3353.
- Shalon D, Culver RN, Grembi JA, Folz J, Treit PV, Shi H, Rosenberger FA, Dethlefsen L, Meng X, Yaffe E, et al. Profiling the human intestinal environment under physiological conditions. Nature. 2023;617(7961):581–591. doi:10.1038/s41586-023-05989-7.
- Kastl AJ Jr., Terry NA, Wu GD, Albenberg LG. The structure and function of the human small intestinal microbiota: current understanding and future directions. Cell Mol Gastroenterol Hepatol. 2020;9(1):33–45. doi:10.1016/j.jcmgh.2019.07.006.
- Xie G, Wang X, Liu P, Wei R, Chen W, Rajani C, Hernandez BY, Alegado R, Dong B, Li D, et al. Distinctly altered gut microbiota in the progression of liver disease. Oncotarget. 2016;7(15):19355–19366. doi:10.18632/oncotarget.8466.
- Fuchs CD, Trauner M. Role of bile acids and their receptors in gastrointestinal and hepatic pathophysiology. Nat Rev Gastro Hepat. 2022;19(7):432–450. doi:10.1038/s41575-021-00566-7.
- Zhang X, Coker OO, Chu ES, Fu K, Lau HCH, Wang Y-X, Chan AWH, Wei H, Yang X, Sung JJY, et al. Dietary cholesterol drives fatty liver-associated liver cancer by modulating gut microbiota and metabolites. Gut. 2021;70(4):761–774. doi:10.1136/gutjnl-2019-319664.
- Munteanu C, Turnea MA, Rotariu M. Hydrogen Sulfide: An emerging regulator of oxidative stress and cellular homeostasis—a comprehensive one-year review. Antioxid (Basel). 2023;12(9):1737. doi:10.3390/antiox12091737.
- Wu B, Liu F, Fang W, Yang T, Chen G-H, He Z, Wang S. Microbial sulfur metabolism and environmental implications. Sci Total Environ. 2021;778:146085. doi:10.1016/j.scitotenv.2021.146085.
- Feng J, Jiang W, Cheng X, Zou B, Varley AW, Liu T, Qian G, Zeng W, Tang J, Zhao Q, et al. A host lipase prevents lipopolysaccharide-induced foam cell formation. iScience. 2021;24(9):103004. doi:10.1016/j.isci.2021.103004.
- Han YH, Onufer EJ, Huang L-H, Sprung RW, Davidson WS, Czepielewski RS, Wohltmann M, Sorci-Thomas MG, Warner BW, Randolph GJ, et al. Enterically derived high-density lipoprotein restrains liver injury through the portal vein. Science. 2021;373(6553). doi:10.1126/science.abe6729.
- Song Z, Cai Y, Lao X, Wang X, Lin X, Cui Y, Kalavagunta PK, Liao J, Jin L, Shang J, et al. Taxonomic profiling and populational patterns of bacterial bile salt hydrolase (BSH) genes based on worldwide human gut microbiome. Microbiome. 2019;7(1). doi:10.1186/s40168-019-0628-3.
- Kitada M, Ogura Y, Monno I, Koya D. The impact of dietary protein intake on longevity and metabolic health. EBioMedicine. 2019;43:632–640. doi:10.1016/j.ebiom.2019.04.005.
- Turnbaugh PJ, Ley RE, Mahowald MA, Magrini V, Mardis ER, Gordon JI. An obesity-associated gut microbiome with increased capacity for energy harvest. Nature. 2006;444(7122):1027–1031. doi:10.1038/nature05414.
- Cai J, Sun L, Gonzalez FJ. Gut microbiota-derived bile acids in intestinal immunity, inflammation, and tumorigenesis. Cell Host Microbe. 2022;30(3):289–300. doi:10.1016/j.chom.2022.02.004.
- Kim KH, Park D, Jia B, Baek JH, Hahn Y, Jeon CO. Identification and characterization of major bile Acid 7α-Dehydroxylating bacteria in the human gut. mSystems. 2022;7(4):e0045522. doi:10.1128/msystems.00455-22.
- Claus SP, Tsang TM, Wang Y, Cloarec O, Skordi E, Martin F-P, Rezzi S, Ross A, Kochhar S, Holmes E, et al. Systemic multicompartmental effects of the gut microbiome on mouse metabolic phenotypes. Mol Syst Biol. 2008;4(1):219. doi:10.1038/msb.2008.56.
- Swann JR, Want EJ, Geier FM, Spagou K, Wilson ID, Sidaway JE, Nicholson JK, Holmes E. Systemic gut microbial modulation of bile acid metabolism in host tissue compartments. Proc Natl Acad Sci U S A. 2011;108 Suppl 1(supplement_1):4523–4530. doi:10.1073/pnas.1006734107.
- Chen SN, Tan Y, Xiao X-C, Li Q, Wu Q, Peng Y-Y, Ren J, Dong M-L. Deletion of TLR4 attenuates lipopolysaccharide-induced acute liver injury by inhibiting inflammation and apoptosis. Acta Pharmacol Sin. 2021;42(10):1610–1619. doi:10.1038/s41401-020-00597-x.
- Cani PD, Amar J, Iglesias MA, Poggi M, Knauf C, Bastelica D, Neyrinck AM, Fava F, Tuohy KM, Chabo C, et al. Metabolic endotoxemia initiates obesity and insulin resistance. Diabetes. 2007;56(7):1761–1772. doi:10.2337/db06-1491.
- Cani PD, Bibiloni R, Knauf C, Waget A, Neyrinck AM, Delzenne NM, Burcelin R. Changes in gut microbiota control metabolic endotoxemia-induced inflammation in High-Fat Diet–Induced obesity and diabetes in mice. Diabetes. 2008;57(6):1470–1481. doi:10.2337/db07-1403.
- Sookoian S, Salatino A, Castaño GO, Landa MS, Fijalkowky C, Garaycoechea M, Pirola CJ. Intrahepatic bacterial metataxonomic signature in non-alcoholic fatty liver disease. Gut. 2020;69(8):1483–1491. doi:10.1136/gutjnl-2019-318811.
- Fukui H, Brauner B, Bode JC, Bode C. Plasma endotoxin concentrations in patients with alcoholic and non-alcoholic liver disease: reevaluation with an improved chromogenic assay. J Hepatol. 1991;12(2):162–169. doi:10.1016/0168-8278(91)90933-3.
- Munoz L, Borrero M-J, Úbeda M, Conde E, Del Campo R, Rodríguez‐Serrano M, Lario M, Sánchez‐Díaz A-M, Pastor O, Díaz D, et al. Intestinal Immune Dysregulation Driven by Dysbiosis Promotes Barrier Disruption and Bacterial Translocation in Rats with Cirrhosis. Hepatology. 2019;70(3):925–938. doi:10.1002/hep.30349.
- Sorribas M, Jakob MO, Yilmaz B, Li H, Stutz D, Noser Y, de Gottardi A, Moghadamrad S, Hassan M, Albillos A, et al. FXR modulates the gut-vascular barrier by regulating the entry sites for bacterial translocation in experimental cirrhosis. J Hepatol. 2019;71(6):1126–1140. doi:10.1016/j.jhep.2019.06.017.
- Gandhi CR. Pro- and Anti-fibrogenic Functions of Gram-Negative Bacterial lipopolysaccharide in the liver. Front Med (Lausanne). 2020;7:130. doi:10.3389/fmed.2020.00130.
- Xu MQ, Cen M, Shen Y, Zhu Y, Cheng F, Tang L, Hu W, Dai N. Deoxycholic Acid-Induced gut dysbiosis disrupts bile acid enterohepatic circulation and promotes intestinal Inflammation. Dig Dis Sci. 2021;66(2):568–576. doi:10.1007/s10620-020-06208-3.
- Liu L, Dong W, Wang S, Zhang Y, Liu T, Xie R, Wang B, Cao H. Deoxycholic acid disrupts the intestinal mucosal barrier and promotes intestinal tumorigenesis. Food Funct. 2018;9(11):5588–5597. doi:10.1039/C8FO01143E.
- Jia W, Xie G, Jia W. Bile acid–microbiota crosstalk in gastrointestinal inflammation and carcinogenesis. Nat Rev Gastroenterol Hepatol. 2018;15(2):111–128. doi:10.1038/nrgastro.2017.119.
- Gadaleta RM, Garcia-Irigoyen O, Moschetta A. Bile acids and colon cancer: Is FXR the solution of the conundrum? Mol Aspects Med. 2017;56:66–74. doi:10.1016/j.mam.2017.04.002.
- Payne CM, Bernstein C, Dvorak K, Bernstein H. Hydrophobic bile acids, genomic instability, Darwinian selection, and colon carcinogenesis. Clin Exp Gastroenterol. 2008;1:19–47. doi:10.2147/CEG.S4343.
- Woolbright BL, McGill MR, Yan H, Jaeschke H. Bile Acid-Induced Toxicity in Heparg cells recapitulates the response in primary human hepatocytes. Basic Clin Pharmacol Toxicol. 2016;118(2):160–167. doi:10.1111/bcpt.12449.
- Woolbright BL, Dorko K, Antoine DJ, Clarke JI, Gholami P, Li F, Kumer SC, Schmitt TM, Forster J, Fan F, et al. Bile acid-induced necrosis in primary human hepatocytes and in patients with obstructive cholestasis. Toxicol Appl Pharmacol. 2015;283(3):168–177. doi:10.1016/j.taap.2015.01.015.
- Song P, Zhang Y, Klaassen CD. Dose-response of five bile acids on serum and liver bile Acid concentrations and hepatotoxicity in mice. Toxicol Sci. 2011;123(2):359–367. doi:10.1093/toxsci/kfr177.
- Miyake JH, Wang SL, Davis RA. Bile acid induction of cytokine expression by macrophages correlates with repression of hepatic cholesterol 7α-hydroxylase. J Biol Chem. 2000;275(29):21805–21808. doi:10.1074/jbc.C000275200.
- Sato K, Hall C, Glaser S, Francis H, Meng F, Alpini G. Pathogenesis of Kupffer Cells in Cholestatic Liver Injury. Am J Pathol. 2016;186(9):2238–2247. doi:10.1016/j.ajpath.2016.06.003.
- Allen K, Jaeschke H, Copple BL. Bile acids induce inflammatory genes in hepatocytes: a novel mechanism of inflammation during obstructive cholestasis. Am J Pathol. 2011;178(1):175–186. doi:10.1016/j.ajpath.2010.11.026.
- Rahman AH, Aloman C. Dendritic cells and liver fibrosis. Biochim Biophys Acta. 2013;1832(7):998–1004. doi:10.1016/j.bbadis.2013.01.005.
- Carambia A, Freund B, Schwinge D, Heine M, Laschtowitz A, Huber S, Wraith DC, Korn T, Schramm C, Lohse AW, et al. TGF-β-dependent induction of CD4+CD25+Foxp3+ Tregs by liver sinusoidal endothelial cells. J Hepatol. 2014;61(3):594–599. doi:10.1016/j.jhep.2014.04.027.
- Yoshimoto S, Loo TM, Atarashi K, Kanda H, Sato S, Oyadomari S, Iwakura Y, Oshima K, Morita H, Hattori M, et al. Obesity-induced gut microbial metabolite promotes liver cancer through senescence secretome. Nature. 2013;499(7456):97–101. doi:10.1038/nature12347.
- Friedman SL. Hepatic stellate cells: protean, multifunctional, and enigmatic cells of the liver. Physiol Rev. 2008;88(1):125–172. doi:10.1152/physrev.00013.2007.
- Allocati N, Masulli M, Di Ilio C, Federici L. Glutathione transferases: substrates, inhibitors and pro-drugs in cancer and neurodegenerative diseases. Oncogenesis. 2018;7(8). doi:10.1038/s41389-017-0025-3.
- Dasari S, Ganjayi MS, Yellanurkonda P, Basha S, Meriga B. Role of glutathione S-transferases in detoxification of a polycyclic aromatic hydrocarbon, methylcholanthrene. Chem Biol Interact. 2018;294:81–90. doi:10.1016/j.cbi.2018.08.023.
- Li G, Liu H, Yu Y, Wang Q, Yang C, Yan Y, Wang F, Mao Y. Desulfovibrio desulfuricans and its derived metabolites confer resistance to FOLFOX through METTL3. eBiomedicine. 2024;102:105041. doi:10.1016/j.ebiom.2024.105041.
- Lu XY, Shi X-J, Hu A, Wang J-Q, Ding Y, Jiang W, Sun M, Zhao X, Luo J, Qi W, et al. Feeding induces cholesterol biosynthesis via the mTORC1–USP20–HMGCR axis. Nature. 2020;588(7838):479–484. doi:10.1038/s41586-020-2928-y.
- Lu G, Zhang Y, Ren Y, Shi J-S, Xu Z-H, Geng Y. Diversity and comparison of intestinal desulfovibrio in patients with liver cirrhosis and healthy people. Microorganisms. 2023;11(2):276. doi:10.3390/microorganisms11020276.
- Pimentel Jason D, Chan Raymond C. Desulfovibrio fairfieldensis bacteremia associated with choledocholithiasis and endoscopic retrograde cholangiopancreatography. J Clin Microbiol. 2007;45(8):2747–2750. doi:10.1128/JCM.00969-07.
- Nie Y, Xie X-Q, Zhou L, Guan Q, Ren Y, Mao Y, Shi J-S, Xu Z-H, Geng Y. Desulfovibrio fairfieldensis-derived outer membrane vesicles damage epithelial barrier and induce inflammation and pyroptosis in macrophages. Cells. 2022;12(1):89. doi:10.3390/cells12010089.