
 ?Mathematical formulae have been encoded as MathML and are displayed in this HTML version using MathJax in order to improve their display. Uncheck the box to turn MathJax off. This feature requires Javascript. Click on a formula to zoom.
Abstract
Environmental concerns and the rise in energy costs have heightened the focus on reducing CO2 emissions within the built environment. By concentrating on the office market in the UK, where a significant portion of a service-based economy operates, progress towards achieving emission reduction goals could be accelerated. Nevertheless, the speed at which this sector can enhance its environmental impact and whether individuals are willing to invest in energy-efficient measures and new energy-efficient buildings has remained uncertain. This paper investigates the influence of varying Energy Performance Certificate (EPC) ratings on the rental rates of office buildings in the UK, drawing on an extensive dataset spanning the years of 2011–2021. Our research seeks to determine whether there exists a willingness to pay for more energy-efficient office spaces by assessing whether there is a rental premium associated with office building with higher EPC ratings. Furthermore, we examine whether buildings failing to meet minimum energy efficiency standard (defined as EPC ratings of F and G) experience rental discounts. Our findings, which take into account heteroscedasticity and various disaggregations within the office market, consistently reveal a willingness to pay for energy-efficient office spaces.
Introduction
Understanding the energy efficiency of commercial buildings has gained increasing significance due to the environmental impact of energy consumption as well as its financial implications. Given that real estate assets are heterogeneous and information asymmetry exits between landlord, their agents, and prospective tenants, a selection problem may arise where landlords may offer poor quality products to the market (similar to Akerlof, Citation1970). To address the potential problem both market driven measures and policy interventions have developed to improve the transparency of evaluating a building’s energy efficiency. In the UK, the policy intervention takes the form of energy performance certificates (EPC), which provide a specific rating category. The EPC rating serves as an informative market signal of building quality, presented in an easily comprehensible format for prospective purchasers of the property or tenants. The European Parliament introduced the Energy Performance of Buildings Directive (EPBD) in 2002. This directive provided a standardized methodology for assessing a building’s energy performance. Member countries within the European Union (EU) were mandated to ensure that all newly constructed or transacted buildings possessed an energy performance certificate (EPC), thereby signalling their level or category of energy efficiency. The directive’s provisions were subsequently integrated into the legislation of the United Kingdom (England and Wales) in 2007.
In the context of a non-domestic building in the UK, “an EPC rating serves as an indicator of the calculated annual CO2 emissions associated with space heating, water heating, ventilation, air-conditioning, and lighting under normal circumstances” (Parkinson et al., Citation2013, p. 1494). Once calculated, this asset rating must be displayed in the form of an easy to read EPC rating label of A+ (indicating the highest level of energy efficiency) to G (signifying the lowest level of energy efficiency). According to a report from the UK government, non-domestic buildings are responsible for emitting 12% of the country’s CO2 emission due to powering and heating of the buildings. It is projected that appropriately 60% of the existing commercial buildings will remain in use in 2050 (Business, Energy & Industrial Strategy Committee [BEIS], 2019). The “Energy Act, 2011” was introduced in the UK with the aim to meet the government target of net zero carbon emissions by 2050.
The new legislation mandates that all investment buildings (domestic and non-domestic buildings) in England and Wales must meet a Minimum Energy Efficiency Standard (MEES). The minimum standard required is an EPC rating of E. The buildings with an EPC rating of F or G on the EPC scale must undergo improvements to achieve a rating of E or higher, otherwise they will not be eligible for new leases. Furthermore, starting on 1st April 2023, the same rule would be extended to all existing leases. The aim of the new legislation is to improve the energy efficiency of buildings. However, the degree to which this legislation will achieve its goals remains uncertain. Despite the implementation of MEES, data availability issues have made it difficult to evaluate its potential impact and effectiveness.
Property owners may find a strong financial incentive to enhance their Energy Performance Certificate (EPC) rating through refurbishment or renovation, as this can potentially lead to increased rental and capital values. Consequently, they are more likely to comply with MEES. Over time, this could result in a greater supply of buildings with higher EPC ratings, though the marginal financial benefits may start to diminish. Concurrently, the demand for properties with higher EPC ratings is also rising. This increase in demand is driven by factors such as increasing awareness of climate change, escalating energy costs, market pressures on companies to disclose their carbon emissions, and growing expectations from both shareholders and tenants for a commitment to achieving net-zero carbon emissions. Empirical studies have further reinforced the importance of buildings with high energy efficiency, often indicated by a superior EPC rating. For example, research conducted by Clayton et al. in 2021, as well as Eichholtz et al. (Citation2019), demonstrates that such buildings can significantly reduce energy consumption.
Research on the influence of EPC ratings on the value of commercial real estate in the UK has developed over the past 20 years. Early studies spanning the period from 2000 to 2010 (e.g., Chegut et al., Citation2014; Fuerst & McAllister, Citation2011a, Citation2011b; Fuerst et al., Citation2013), were constrained by small sample sizes, possibly reflecting the more recent introduction of legislation during those years. While providing a theoretical framework that has influenced subsequent debates, these studies produced a range of different findings, possibly reflecting the data sources used. Relatedly, these investigations typically encompass buildings with EPC ratings constituting less than 10% of the total sample size. Most of these studies treat EPC as a single variable and do not assess the impact of varying EPC ratings on rental and property values, which again may reflect data availability. Consequently, the implications for property investors and policymakers may be limited. Therefore, the results of these tests should be interpreted with some caution.
Over the past decade, driven by new legislation, mounting concerns about climate change, and the growing compliance risk faced by both property owners and tenants, there has been a surge in demand for energy-efficient buildings, accompanied by an increase in the supply of such properties. Nevertheless, it remains uncertain whether the rent premiums or discounts observed in earlier studies continue to hold true and whether there are still discernible advantages to investing in energy-efficient buildings. Furthermore, it remains unclear whether properties that conform to the legislative standard possess higher rental values compared to those with EPC ratings that fall below the MEES. Therefore this paper aims to investigate whether higher energy efficiency as reflected in EPC ratings can command rent premiums.
We investigate whether rental differentials exist across various EPC ratings. Specifically, we will examine whether there is a premium associated with more energy efficient buildings and a corresponding discount for less efficient buildings including those falling below the MEES. We have utilized a large dataset comprising office buildings situated across England and Wales. The data pertaining to these office buildings, encompassing their physical attributes and rental information, has been sourced from CoStar. For our analysis, we have collected EPC ratings information from the Department for Levelling Up, Housing, and Communities, where EPC assessment and rating reports are officially registered.
Notably, compared to earlier research, the proportion of buildings within our dataset that possess EPCs increased substantially, now constituting more than 50% of the total sample. Specifically, our study encompasses 12,514 investment office buildings with complete data as of the end of 2021. Among these properties, 55% have valid EPC ratings, underscoring the need for further efforts and actions to ensure compliance with regulatory requirements. The 55% of properties with valid EPC ratings give us a sample of just under 7,000 observations upon which to test for rental premiums or discounts depending on the EPC ratings.
Although previous studies have shed light on rent and value premiums linked to green buildings, often represented by certifications such as BREEAM, LEED, EPC, or Energy Star ratings, there is still a notable absence of comprehensive evidence regarding the returns on investment in energy efficiency enhancements. This knowledge gap is perceived as an obstacle to incentivizing investments in energy efficiency, as illustrated by Kok and Jennen (Citation2012). This hindrance exists because, under lease agreements where energy costs may be bundled together within service charges and averaged across tenants in multi-tenant buildings, tenants gain from reduced energy consumption, and if they could directly perceive the advantages of energy savings in energy-efficient buildings, they would likely be more willing to pay higher rents.
This is the first study to examine the association of varying ratings of EPC and rent premiums/discounts for office buildings in the UK using a large sample. The findings contribute to post-implementation evidence into the effectiveness of the MEES regulation. In this research, we employ a hedonic modelling approach to estimate the implicit price relationships among various attributes of office buildings, including their EPC ratings. To ensure the robustness of our findings, we assess and address heteroscedasticity using Breusch Pagan, and White’s tests, subsequently providing heteroscedasticity consistent estimates.
Our study further distinguishes results by region, office submarket and local authority level. Additionally, we explore key regional office market clusters and London office submarkets given the spatial concentration of offices in London and the global importance of this office market. The empirical findings suggest the significance of accounting for heteroscedasticity in the modelling approach, that are rental premiums for EPC ratings of A, and B rated offices, while there are discounts for less energy efficient offices. However, EPC ratings of E and F rated office buildings do not command any rental premium over the least efficient properties with EPC rating of G. The results could suggest that the market is responding to the MEES, signalling its influence on commercial real estate sector.
The paper is organized as follows: Section “Literature Review” presents the literature review, followed by an explanation of the data and methodology in Section “Data and methodology.” Following that, the paper discusses the test results in Section “Empirical Test Results” before presenting the conclusions in Section “Conclusions and Policy Implications.”
Literature Review
The majority of existing studies examining the influence of energy performance certificates, such as Green Star in Australia, Energy Star in the U. S, and EPCs in the UK, on the value of commercial real estate, were conducted with the data between 2000 and 2010, that is in the initial phase of the introduction of green certifications. While these studies have yielded varying results, contingent on factors such as the study duration, sample size, and data source, they contribute to our comprehension of the enhanced asset value of sustainable buildings and the financial incentives deemed crucial for the promotion of green building technologies (Darko et al., Citation2017; Zhang et al., Citation2018). Here, we discuss specific findings regarding the impact of energy efficiency labelling and varying energy ratings on the rental value of office buildings.
Research on the U.S. commercial real estate markets has identified the existence of Energy Star premiums. These studies have utilized data from CoStar and have a focus on the 2000–2009 timeframe. These studies often had relatively small sample sizes, with the proportion of Energy Star-labelled buildings in the sample accounting for less than 10% of the overall dataset (e.g., Eichholtz et al., Citation2010; Fuerst & McAllister, Citation2011a, Citation2011b; Robinson et al., Citation2017). For example, Eichholtz et al. (Citation2010) examined a sample comprising approximately 10,000 office buildings, encompassing both labelled and non-labelled structures. Their findings indicate that buildings with Energy Star certification commanded a 3.3% rental premium relative to their non-labelled counterparts. In another similar study, Fuerst and McAllister (Citation2011a) investigated the U.S. commercial real estate market using CoStar data. In their sample of 15,000 commercial properties, the buildings with energy performance certificates constituted merely 6% of the total sample, yet they discovered that these Energy Star-certified buildings commanded a 4% rental premium. While, these studies did not differentiate the impact of different energy efficiency ratings, possibly reflecting the constraints of data availability, they are among the first to provide evidence on the impact of energy efficiency on the commercial real estate market.
Reichardt et al. (Citation2012) conducted a study encompassing 7,140 buildings in the U.S., among them 25% holding energy performance certifications. Their research found significant rent premiums for buildings with an Energy Star rating. However, the magnitude of the premiums exhibited variations and are not consistent through the study period from 2000 to 2010.
Robinson et al. (Citation2017) studied the impact of green certifications of LEED (Leadership in Energy and Environmental Design) and Energy Star on office building rents in the U.S. market. Their study involved 2,246 lease-level observations in 197 buildings in 20 major U.S. markets and the data for this analysis were provided by CBRE, a real estate consultancy firm. In addition to investigating the effects of LEED and Energy Star certification, they extended their analysis by incorporating the green variables identified in previous research by Simons et al. (Citation2014) in their analysis. Their findings revealed the existence of Energy Star premiums, but these premiums tended to diminish when the model incorporated other sustainable factors of the buildings. These sustainable factors included access to natural light, HVAC system (Heating, Ventilation, and Air Conditioning), water conservation, public transit, an electric car charging station and more.
In their most recent study, Holtermans and Kok (Citation2019) examined the U.S. office buildings from 2004 to 2013, tracking the rental growth of 26,212 office buildings. They found that office buildings with the Energy Star certificate commanded a 1.5% rent premium compared with the ones without the certificate and the premiums increase with the level of rating.
The decision by investors to invest in a building’s energy efficiency can be attributed to the expected returns on retrofitting and energy savings, even though the energy cost savings benefit the tenants. The amount of energy consumed by a building is influenced by both the building’s energy efficiency and the tenant’s behaviour. Recent studies shed some light on this argument. For instance, Eichholtz et al. (Citation2019) found that office buildings with LEED certification consumed 40% less energy. Additionally, Clayton et al. (Citation2021) examined the connection between energy efficiency certificates (such as LEED) in the U.S. and Building Owners and Managers Association, (BOMA) in Canada and energy consumption of office buildings in Canadian and U.S. markets. They documented reduced energy consumption in certified buildings, though their sample size was small, consisting of 159 buildings.
The existing literature on EPC ratings and their impact on commercial real estate in the UK is relatively limited. These few studies available covered the period from 2000 to 2010, employed different data sources and yielded varying findings. For instance, Fuerst and McAllister (Citation2011b) were the first to study the impact of EPC labels on rental and capital values of UK commercial real estate using data from the Investment Property Databank (IPD). Their analysis included 708 properties across retail, office, and industrial sectors throughout various regions. They found no evidence of a significant relationship between EPC ratings and rental values.
In contrast, subsequent studies by Fuerst et al. (Citation2013) and Chegut et al. (Citation2014) found different results. Fuerst, van de Wetering, and Wyatt (Citation2013) examined the EPC impact on office property rent in the UK using CoStar data. Their sample comprised 817 office buildings with various EPC rating levels over the period from 2008 to 2010. They found that office space with EPC ratings falling within the A to C range commanded significantly higher rents compared to buildings with average EPC ratings at level D or below. The premium seems to be driven more by the age of these buildings, with older buildings bearing EPC ratings of A to C or E to G experiencing rent discounts. These variations in findings underscore the complexity of assessing the impact of EPC ratings on commercial real estate and highlight the potential influence of factors like building age in shaping rental dynamics.
Unlike the literature mentioned above, which predominantly employs the hedonic technique to examine the impact of EPC on office building’s rents and prices. Parkinson et al. (Citation2013) pursued a different approach. They evaluate the relationship between valid EPC, occupant satisfaction, and commercial office rental values through a survey. They found that EPC is significantly related to occupants’ satisfaction with their workplaces, but not to the rental value of the office buildings. Fuerst and McAllister (Citation2011a) suggested that energy certified buildings might improve worker productivity, potentially linked to the provision of a more comfortable and higher-quality work environment.
In other real estate markets, there have been differing findings regarding the impact of energy efficiency on office space rents. Gabe and Rehm (Citation2013) found no significant impact of energy efficiency on office space rent in Sydney. Their analysis encompassed 673 lease transactions in 102 unique buildings in the Sydney central business district from January 2007 to September 2011. The source of the data was from the New South Wales Department of Land and Property Information.
Newell et al. (Citation2014) investigated the Australian market and found that there exists an energy rating premium or discount for 200 green office buildings in the country. The magnitude of these premiums or discounts was determined by the level of energy ratings, with the top ratings commanding premiums and a lower energy rating resulting in discounts. Kok and Jennen (Citation2012) explored the relationship between EPC ratings and commercial real estate rental values in the Netherlands from 2005 to 2010 period and found that inefficient buildings with an EPC rating of D or below experienced a rent discount of 6.5%. These diverse findings illustrate that the impact of energy efficiency on office space rents can vary significantly across different markets and regions, influenced by various factors including local market conditions, data sources, and the specific criteria used to assess energy efficiency.
The Effect of the Minimum Energy Efficiency Standard (MEES)
Government regulations are widely acknowledged as the key driver for the adoption of green buildings (Darko et al., Citation2017). The introduction of the EPC has helped stimulate awareness of energy efficiency mandates and serves as an environmental benchmark in the property industry.
Under the Energy Act (2011), the UK Government introduced the Minimum Energy Efficiency Standard (MEES) in England and Wales. The standard established the legally mandated minimum EPC benchmarks for both domestic and non-domestic buildings (RICS, 2018). From 1st April 2018, a minimum performance standard was required to be met at the time of letting. In compliance with associated regulations, non-domestic landlords were obligated to have at least an E rating on the EPC of all rented buildings. As of the 1st April 2023, a lease to new or existing leaseholders may not be granted if their commercial property has an EPC rating within band F or G unless an exemption applies. It is anticipated that the government will review the standards and likely raise them to cover all properties with an EPC rating of D by 2025 and EPC rating of B by 2030 (BEIS 2019).
McAllister and Nase (Citation2019) examined the effectiveness of MEES focusing on London office buildings from 2011 to 2017, the period after the introduction of the policy and before the policy implementation. Their findings indicate that a mere 0.65% of the properties falling below MEES underwent modifications, indicating that commercial real estate was progressing at a slower pace than legislators had anticipated.
Data and Methodology
Data
The data on office buildings were collected from CoStar. The CoStar dataset comprises a range of information, encompassing the building’s address, physical characteristics including size, number of floors, year of construction, renovation history, and a variety of amenities such as food service, restaurant, convenience shop, and bicycle storage, car charging station, courtyard, and more. Though the CoStar dataset contains information on the EPC ratings of the building, this information is incomplete. To address this limitation, we use EPC data from the Department for Levelling Up, Housing and Communities from 1st January 2008 to December 2021.
EPC assessment on non-domestic building can be conducted for either the entire building or individual unit within a building. The EPC rating could vary from one unit to another within the same building. Some units in a building have EPC ratings, while others do not. Additionally, EPC rating is valid for a period of 10 years. Some buildings or units underwent reassessment during the period from 2008 to 2021, while others have had EPC ratings assessed a decade ago, with these ratings expiring by the end of 2021.
The filtering process for EPC data involves the following steps: (1). When there are multiple EPC rating entries for the same building or unit within the same month, we retain the entry with the superior EPC rating and discard the others. (2). For buildings that have been reassessed since 2008, we retain the most recent EPC ratings. (3). If less than 30% of the entire building has been assessed with an EPC rating, we classify the building as non-certified. (4). In cases where the building is assessed unit by unit, we calculate the EPC rating for the entire building as the average score of the EPC ratings of all the individual units. In addition, the physical features of the building and amenity characteristics are defined in .
Table 1. The definition of study variables.
There are 12,514 office buildings occupied by tenants across ten regions in England and Wales with complete information. Owner-occupier buildings have been excluded from our study as we have no rental data for these buildings.
reports the information of EPC rating across regions in England and Wales.
Table 2. EPC certification and rating for offices across regions in England and Wales (%).
The data show a London bias, with 31% of office buildings located in London. Of the total office buildings, 55% of the office buildings have a valid ECP rating.Footnote1 2% of buildings carry EPC ratings of F and G, below the legislation required. Taking these findings into account, 47% of the office buildings currently in use are either non-compliant or lack an EPC rating altogether. It is expected that, as the legislation introduced in 2011, most properties with EPC ratings of F and G will be taken off the market after 2025, when compliance with MEES becomes mandatory. There is no significant regional discrepancy across the regions as shown in . The data in show that there is still a long way to go for the policy to be effectively implemented.
reports the descriptive statistics of the key variables for buildings with and without EPCs. Certified buildings tend to command higher rent and have smaller size, although with large standard deviations. The average age of certified buildings is 53.09 years, slightly lower than the average age of non-certified buildings at 53.24 years. 17% of the certified buildings have undergone renovation since 2000, in contrast to non-certified buildings (14%). Certified buildings are somewhat more likely to be located in town (74%) compared to non-certified buildings (69%).
Table 3. The descriptive statistics summary of key variables.
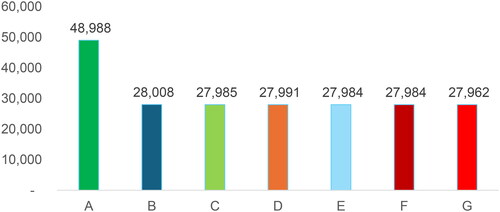
shows the relation between EPC and the size of the buildings. The building with EPC rating of A is the largest, followed by the buildings with EPC rating of B. The average size of EPC rating of C to G is similar.
Figure 1. EPC rating vs size of building (square feet).
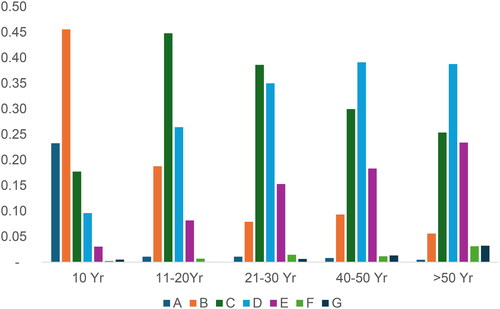
shows the relationship between EPC ratings and the age of the building. 58% of the buildings with EPC are 1–50 years old and 42% of them are over 50 years old. Obviously, the building ages influence the energy efficiency proxied by EPC ratings as shown in . For example, 68% of the buildings built during 2011–2021 have EPC ratings A and B. They fall to 20% and 9% for the buildings aged between 11 and 20 years old and 21–30 years old respectively. The building’s ratings fall as the building age grows. 2% of the building aged 21–50 years old are ranked F and G, below MEES. This ratio increased to 6% for the buildings aged over 50 years old, indicating that age is one of the hurdles to improving office buildings’ energy efficiency and meet the requirement of the legislation.
Figure 2. EPC and building age (measurement on vertical axis needs to be stated).
Methodology
The rent paid for office occupation is the outcome of a bargaining process between tenant and landlord (or their agent) and will reflect market conditions as well as a range of other influences including the environmental aspects of an office block. Fuerst and McAllister (Citation2011a) suggest that tenants can benefit from energy efficient buildings through reduced operating costs, higher productivity due to a better working environment that reduced sickness and other reasons for absence, and improved competitiveness due to enhanced image and possible promotional advantages of “greening.” Therefore, we expect, a priori, that there will be a positive rental premium for more energy efficient buildings, i.e., those with EPC ratings of A or B, as demand rises relative to supply in the short run. A discount might also be expected for offices with EPC ratings of F or G, as demand falls relative to supply. This discount is more likely too if the market is beginning to revalue offices given the impact of MEES regulations.
Offices can be considered as providing a vector of characteristics that are bundled together in a leasing contract to a tenant. Following Rosen (Citation1974) and adapting to a hedonic model for office rents we have:
(1)
(1)
where the dependent variable (rent per square foot) is regressed on a vector, X, of office characteristics. These can be subdivided into office amenities, location, and energy performance characteristics. The stochastic disturbance term, ε, is assumed to follow the standard assumptions of zero mean and constant variance. The model in (1) is estimated in log-linear form as:
(2)
(2)
Where the log rent is regressed on characteristics including the availability of conference facilities, air conditioning, bicycle storage, whether the building has an atrium, shower facilities, a restaurant, car charging point, convenience store, roof terrace, and different architectural features. We further include the EPC ratings A to G with G (or F plus G) being set as the excluded category. In line with a priori expectations, we expect a positive value on more energy efficient buildings to represent a rent premium that tenants are prepared to pay to lease such space. Also, we include a range of locations to control from spatial differences in rent paid. Separate regressions are run for regions, London office submarkets, and the main regional office market centres. This also reflects the fact that investment in the office stock is highly geographically concentrated in key urban centres with very little investable stock in much of the country (see Byrne & Lee, Citation2006). Finally, the disturbance term is assumed to have zero mean and be homoscedastic. However, given that our data are cross-sectional, and that the office market is highly heterogeneous it is likely that the error term does not meet these assumptions. Therefore, we test for heteroscedasticity using Breusch-Pagan and White’s tests. Breusch and Pagan (Citation1979) is an example of a Lagrange multiplier test and checks for a linear form of heteroscedasticity. The White test (see White, Citation1980) is a more generic test. It replaces the unknown error variance with estimated residuals variance. We report results with heteroscedasticity-consistent standard errors (i.e., robust standard errors) in the estimated models below.
Empirical Test Results
The first hedonic regression based upon Equation (2) is applied to standard regions. presents the regression results.
Table 4. Regional rent model.a
The results reported in for the regional rent model have an adjusted R-squared of just over 68%. The variables of interest have the expected signs a priori. There is evidence of rental premiums for more energy efficient office buildings. An EPC rating of A has a rental premium of almost 15%, EPC rating of B, a premium of over 10%, and EPC rating of C a smaller premium of 4% over the excluded category of the EPC rating of G. Combining F and G excluded categories did not significantly change these results, this also held true for other sample disaggregations. EPC ratings of E and F are not statistically significantly different from the EPC rating of G. This may suggest that the market is beginning to react to MEES regulations.
Of the property characteristics, having an atrium has the largest positive impact on rent followed by air conditioning and the provision of shower. Having a convenience store had a negative effect. Building age often had significant rental effects, with older buildings reducing rent and the newest buildings, built in the last ten years, having a positive rental impact.
For regional location, the North East of England (NE) is the excluded category. Most regions have rental premiums over the North East except for the East Midlands (EM). Unsurprisingly London has the largest rental premium followed by the South East (SE). Taller buildings also command higher rents as do renovated buildings with lower rents for out of town locations.
reports heteroscedasticity tests for the regional rent model presented in . The White test cannot reject the null hypothesis of heteroscedasticity while the Breusch-Pagan test rejects the null of heteroscedasticity. As White’s test is more generic, this still supports adopting robust standard errors in the model estimates presented in .
Table 5. Tests for heteroscedasticity in the regional rent model.
As London is the most important office market in the UK and a major global office centre, we run the model for the London office market and provide estimates for London office submarkets in .
Table 6. Rent model for London office submarkets.a
The results for London in show an adjusted R-square of 48%. Again, there is evidence of a rental premium for more energy efficient buildings. EPC rating of A has a premium of over 15% and EPC rating of B, a premium of 11.4%.
The location submarkets show mostly highly significant effects on rent with the West End having the largest effect followed by the Midtown and City of London office markets. These location effects mostly dominate the EPC effects suggesting the importance of proximity and agglomeration economies. These submarkets, however, have also seen a concentration of newer, taller, and more energy efficient and “green” buildings. Office building amenities have similar effects as with regional and disaggregated models above. Taller buildings have higher rents as do renovated office blocks. Building age variables are always significant, the newest buildings having rent premiums and the older buildings rent discounts ().
Table 7. Heteroscedasticity tests for the London rent model.
The heteroscedasticity tests for the London rent model have conflicting results. White’s test does not find heteroscedasticity test whereas the Breusch-Pagan test suggests the presence of heteroscedasticity. In this case, we again run robust standard errors to take this into consideration. Finally, we model rents for the key regional office markets. The results are presented in .
Table 8. Key regional centres rent model.a
Regional office centres included are Bristol, Birmingham, Leeds, and Manchester, these being the largest centres in England outside of London. The explanatory power is lower for this model than the other models presented which suggest some caution should be taken with result interpretation. However, we find a rental premium for EPC rating of B of just over 12%. EPC rating of A is not statistically significant. This may reflect fewer EPC A rated properties located in these cities and may also reflect a sample size effect.
In relation to building amenities, having an atrium, air conditioning and bicycle storage have positive effects on rent as does being located in more modern and taller buildings.
The results for heteroscedasticity tests are again conflicting with the Breusch-Pagan test indicating the presence of unequal variance, while White’s test suggests homoscedastic variance of the residuals. Given the lower power of the rent model, the smaller sample in this particular model, and the relationship between this, possible missing explanatory variables and heterogeneity we run heteroscedastic consistent estimates in .
Table 9. Heteroscedasticity tests for the regional centres rent model.
The different sample disaggregations reveal a statistically significant willingness to pay higher rents for office properties that are more energy efficient. All sample disaggregations indicate a rental premium for EPC B rated properties. EPC A rated properties concentrate in London, and this impacts the results for the overall regional model as well as the London office submarkets model. Compared with other UK studies that separate various EPC ratings, these results show quite strong effects but with some similar magnitudes as compared with, for example, Fuerst et al. (Citation2013). The effects were stronger than those found for offices in Australia and the Netherlands.
Conclusions and Policy Implications
This paper has attempted to address the issue of energy efficiency and whether there is a rental premium that occupiers are willing to pay for buildings that are more energy efficient as captured by the EPC ratings in the UK commercial real estate market. Building upon Rosen’s (Citation1974) hedonic modelling approach, we estimate hedonic rent models for different data disaggregations and examine the effect of EPC ratings on office rents.
Interestingly when examining various spatial disaggregations and configurations, the results are highly consistent. They show that there is substantial and consistent evidence of rental premiums for more energy efficient buildings. EPC rating of A and B command statistically significant rental premiums ranging from 10% to 15%. Even in the case of the regional centres there is evidence of EPC B properties’ tenants being willing to pay 12% more to occupy these properties. In the disaggregated, regional, and London models, the EPC rating of A consistently commands a rent premium of around 15%. Furthermore, the results suggest that EPC ratings of E and F have no premium over the lowest EPC rating of G. As noted by McAllister and Nase (Citation2019), MEES can be viewed as a policy response to address perceived market failure to remove energy inefficient properties from the rental/investment market. Post implementation evidence that is presented here suggests that the market may have begun to take the MEES regulations into the pricing of office properties into consideration. Nevertheless, this change seems to be slow, and the outworking of the policy may also be reflected in vacancy rates and the supply of stock to the market, where the least energy efficient stock is not renovated but simply removed from the office rental market. In fact, recent government policy change allows large offices to be converted into residential accommodation within permitted development rights rather than requiring full planning permission. Although this approach has been critiqued by Callway et al. (Citation2024), it can be seen to address the MEES requirement whilst also addressing concerns regarding housing affordability even if some remediation would still be required.
A notable consideration in analysis of hedonic rent models using a single cross-section of data, albeit with a large dataset, is the issue of heteroscedasticity. We have explicitly tested for heteroscedasticity in each model estimated and run heteroscedasticity consistent estimators and presented these in the results. In this paper, heteroscedasticity relates to the wider issue of heterogeneity in the office market. There may still be missing variables that if they existed would help to reduce this issue. Despite we have a long list of amenities, many of which have been statistically significant, there may still be more variation in office stock across locations that remain hard to capture. Nevertheless, the estimated models find consistent evidence of rent premiums for more energy efficient offices.
Disclosure Statement
No potential conflict of interest was reported by the author(s).
Notes
1 Valid ECP rating is defined as one where more than 60% of the building space has been assessed since 2011.
References
- Akerlof, G. A. (1970). The market for ‘lemons’: Quality uncertainty and the market mechanism. Quarterly Journal of Economics, 84(3), 488–500.
- Business, Energy and Industrial Strategy Committee. (2019). New target will require the UK to bring all greenhouse gas emissions to net zero by 2050. https://www.gov.uk/government/news/uk-becomes-first-major-economy-to-pass-net-zero-emissions-law.
- Breusch, T. S., & Pagan, A. R. (1979). A simple test for heteroscedasticity and random coefficient variation. Econometrica, 47, 1287–1294. https://doi.org/10.2307/1911963
- Byrne, P., & Lee, S. (2006). Geographical concentration in the institutional market for office property in England and Wales. Working Papers in Real Estate and Planning 07/06. University of Reading.
- Callway, R., Roscoe, S. L., Thrift, J., Ellis, H., & Clifford, B. (2024). Permitted development, housing and health: A review of national policy and regulations. Town and Country Planning Association.
- Chegut, A., Eichholtz, P., & Kok, N. (2014). Supply, demand and the value of green buildings. Urban Studies, 51(1), 22–43. https://doi.org/10.1177/0042098013484526
- Clayton, J., Devine, A., & Holtermans, R. (2021). Beyond building certification: The impact of environmental interventions on commercial real estate operations. Energy Economics, 93, 1–14. https://doi.org/10.1016/j.eneco.2020.105039
- Darko, A., Zhang, C., & Chan, A. P. C. (2017). Drivers for green building: A review of empirical studies. Habitat International, 60, 37–49. https://doi.org/10.1016/j.habitatint.2016.12.007
- Eichholtz, P., Kok, N., & Quigley, J. (2010). Doing well by doing good? Green office buildings. American Economic Review, 100, 2492–2509. https://doi.org/10.1257/aer.100.5.2492
- Eichholtz, P., Holtermans, R., & Kok, N. (2019). Environmental performance of commercial real estate: New insights into energy efficiency improvements. The Journal of Portfolio Management, 45(7), 113–129. https://doi.org/10.3905/jpm.2019.1.099
- Fuerst, F., & McAllister, P. (2011a). Green noise or green value? Measuring the effects of environmental certification on office values. Real Estate Economics, 39(1), 45–69. https://doi.org/10.1111/j.1540-6229.2010.00286.x
- Fuerst, F., & McAllister, P. (2011b). The impact of energy performance certificates on the rental and capital values of commercial property assets. Energy Policy, 39, 6608–6614. https://doi.org/10.1016/j.enpol.2011.08.005
- Fuerst, F., van de Wetering, J., & Wyatt, P. (2013). Is intrinsic energy efficiency reflected in the pricing of office leases? Building Research & Information, 41(4), 373–383. https://doi.org/10.1080/09613218.2013.780229
- Gabe, J., & Rehm, M. (2013). Do tenants pay energy efficiency rent premiums? Journal of Property Investment & Finance, 32(4), 333–351. https://doi.org/10.1108/JPIF-09-2013-0058
- Holtermans, R., & Kok, N. (2019). On the value of environmental certification in the commercial real estate market. Real Estate Economics, 47(3), 685–722. https://doi.org/10.1111/1540-6229.12223
- Kok, N., & Jennen, M. (2012). The impact of energy labels and accessibility on office rents. Energy Policy, 46, 489–497. https://doi.org/10.1016/j.enpol.2012.04.015
- McAllister, P., & Nase, I. (2019). The impact of minimum energy efficiency standards: Some evidence from the London office market. Energy Policy, 132, 714–722. https://doi.org/10.1016/j.enpol.2019.05.060
- Newell, G., MacFarlane, J., & Walker, R. (2014). Assessing energy rating premiums in the performance of green office buildings in Australia. Journal of Property Investment & Finance, 32(4), 352–370. https://doi.org/10.1108/JPIF-10-2013-0061
- Parkinson, A., De Jong, R., Cooke, A., & Guthrie, P. (2013). Energy performance certification as a signal of workplace quality. Energy Policy, 63, 1493–1505. https://doi.org/10.1016/j.enpol.2013.07.043
- Reichardt, A., Fuerst, F., Rottke, B., & Ziet, J. (2012). Sustainable building certification and the rent premium: A panel data approach. Journal of Real Estate Research, 34(1), 99–126. https://doi.org/10.1080/10835547.2012.12091325
- Robinson, S., Simons, R., & Lee, L. (2017). Which green office building features do tenants pay for? A stud of observed rental effects. Journal of Real Estate Research, 39(4), 467–492. https://doi.org/10.1080/10835547.2017.12091483
- Rosen, S. (1974). Hedonic prices and implicit markets: Product differentiation in pure competition. Journal of Political Economy, 82(1), 34–55. https://doi.org/10.1086/260169
- Simons, R. A., Robinson, S., & Lee, E. (2014). Green office buildings: A qualitative exploration of green office building attributes. Journal of Sustainable Real Estate, 6(2), 211–232. https://doi.org/10.1080/10835547.2014.12091866
- White, H. (1980). A heteroskedasticity consistent covariance matrix estimator and a direct test for heteroskedasticity. Econometrica, 48, 817–838. https://doi.org/10.2307/1912934
- Zhang, L., Wu, J., & Liu, H. (2018). Turning green into gold: A review on the economics of green buildings. Journal of Cleaner Production, 172, 2234–2245. https://doi.org/10.1016/j.jclepro.2017.11.188