
ABSTRACT
Fatty acids regulate food intake, although the exact mechanism remains unknown. Emerging evidence suggests that intracellular free fatty acids generated by starvation-induced autophagy regulate food intake. Starvation for 6 h elevated fatty acids such as palmitate, oleate, arachidonate, eicosatrienoate, and docosahexaenoate in the mouse serum. Among them, palmitate induced lipophagy, an autophagic degradation of cellular lipid droplets, in agouti-related peptide (Agrp)-expressing hypothalamic cells. Palmitate-induced lipophagy increased both Agrp expression and the contents of monounsaturated fatty acids such as palmitoleate, oleate, and (E)-9-octadecanoate, whereas these effects were blunted by autophagy deficiency. These findings support the role of free fatty acids in hypothalamic autophagy that regulates the appetite by changing the expression of orexigenic neuropeptides.
Introduction
Accumulating evidence suggests that hypothalamic lipid metabolism regulates food intake and energy balance in the etiology of metabolic diseases (Lam et al. Citation2005; Lopez et al. Citation2005). Hypothalamic sensing of free fatty acids (FFAs) has been studied for years. Excess FFAs result in hypothalamic inflammation and dysfunction of the insulin and leptin signalling pathways, leading to impaired hypothalamic neuropeptide modulation and thereby increasing food intake (Benoit et al. Citation2009; Fick et al. Citation2011). Starvation increases the levels of FFAs in blood (Dole Citation1956; Sprangers et al. Citation2001; Rosen and Spiegelman Citation2006). Circulating FFAs are a primary fuel source in most tissues during starvation and they are also transported through the blood–brain barrier (Spector Citation1988), which may play a role in the appetite regulation. Fasting-induced circulating FFAs are rapidly taken up by a variety of cells including hypothalamic neurons and esterified to triglycerides within lipid droplets (LDs). Neuronal availability of FFAs has been proposed to regulate food intake in the hypothalamus (Lam et al. Citation2005; Andrews et al. Citation2008). Nevertheless, direct evidence to explain the regulatory mechanism of appetite by FFAs is insufficient. Administration of FFAs via intracerebroventricular (i.c.v.) injection directly regulates food intake. I.c.v. infusion of oleate decreases food intake as a result of a reduction in neuropeptide Y (Npy) mRNA and an increase in proopiomelanocortin (Pomc) neuron excitability (Obici et al. Citation2002; Jo et al. Citation2009; Schwinkendorf et al. Citation2011). In contrast, others have reported that i.c.v. infusion of palmitate shows orexigenic effects (Benoit et al. Citation2009; Milanski et al. Citation2009). These results imply distinct regulation of food intake depending on the type of FFA.
Autophagy can provide energetically essential components such as free fatty acids by breaking down intracellular organelles. Lipophagy is a type of selective autophagy that degrades cellular LDs and liberates FFAs, and serves as an important pathway for lipid metabolism (Singh et al. Citation2009; Singh and Cuervo Citation2012; Wang Citation2016; Schulze et al. Citation2017; Kim et al. Citation2019). Endogenous FFAs generated by starvation-induced hypothalamic lipophagy promote the expression of agouti-related peptide (Agrp), an orexigenic neuropeptide that stimulates food intake (Kaushik et al. Citation2011; Singh Citation2011; Liu and Czaja Citation2013). However, the link between intracellular FFAs liberated by lipophagy and Agrp expression is still unclear. In this study, we identified the types of FFAs that induce lipophagy and performed metabolomics analysis of FFAs generated by lipophagy that upregulates Agrp expression.
Materials and methods
Cell culture
The embryonic mouse hypothalamic mHypoE-N41 (N41; Cellutions Biosystems Inc., CLU121) cells were maintained in DMEM (Sigma) with 10% fetal bovine serum (Hyclone Laboratories Inc.) and 1% penicillin/streptomycin (Hyclone Laboratories Inc.) at 37°C.
Animals
Male C57BL/6 mice were purchased from Koatech and housed (one per cage) in individually ventilated cages under a 12-h light/dark cycle (lights on from 6:00–18:00) in a temperature- and humidity-controlled room with ad libitum access to water and normal diet (LabDiet, Inc.). To measure blood glucose and fatty acids, the mice were fasted for 3, 6, and 12 h before the beginning of the dark period.
Antibodies and chemical reagents
Target proteins were probed with the following antibodies: ATG5 and GAPDH (Cell Signaling Technology), LC3 (Sigma). For autophagy inhibition, cells were treated with E64d (Calbiochem) and pepstatin A (Calbiochem). Rapamycin (Sigma) was used to induce autophagy. E64d, pepstatin A, and rapamycin were dissolved in dimethyl sulfoxide (Sigma).
Lipid droplet staining by boron-dipyrromethene
Intracellular LDs were stained using boron-dipyrromethene (BODIPY) 493/503 (Thermo Scientific). Cells were fixed with 4% formaldehyde in PBS, rinsed with PBS, and incubated with a 1:1000 dilution of a BODIPY stock (1 mg/ml in ethanol) in PBS for 15 min; nuclei were visualized by Hoechst 33342.
siRNA transfection
N41 cells were seeded in 6-well plates and transfected with ON-TARGETplus mouse siRNA composed of 4 different siRNAs. Scrambled siRNAs (100 nM; Dharmacon) or Atg5 siRNAs (100 nM; Dharmacon) were transfected using Lipofectamine 3000 (Invitrogen) for 48 h.
Generation of CRISPR/Cas9-mediated Atg5 knockout cells
The guide RNA for the Atg5 gene inactivation (CACGTTTCCCACTTGCCTAGTGG; reverse frame) was designed by and purchased from ToolGen. N41 cells were transfected with Cas9 and gRNA plasmids (1:5 ratio) using TurboFect (Thermo Scientific). Homogenous Atg5 knockout was achieved by selection using 1 mg/ml hygromycin (InvivoGen, ant-hg-1) at 24 h after transfection, followed by subculture in fresh DMEM.
Fatty acid treatment
Sodium palmitate (Sigma), sodium oleate (Sigma), and arachidonate (Sigma) were dissolved in deionized water with heating. A mixture of the dissolved FAs (1 part) and DMEM (9 part) with 5% bovine serum albumin (Sigma) was added to culture media in a desired concentration.
Fractionation of the nucleus and cytosol
Fractionation of the nucleus and cytosol was performed using nuclear and cytoplasmic extraction reagents (Thermo Scientific) following the manufacturer’s instructions. The nuclear pellet was used for GC-MS/MS analysis.
Immunoblot analysis
Cells were lysed in lysis buffer (Lee et al. Citation2016). Lysates were resolved on SDS-polyacrylamide gels and blotted onto PVDF membranes (Millipore) for 35 min at 20 V in transfer buffer (25 mM Tris base, 192 mM glycine, 10% methanol, adjust to pH 7.4). The membranes were blocked with 5% skim milk for 1 h and incubated with appropriate primary antibodies for 1 h at room temperature or at 4°C overnight. After 3 washes with TBST buffer (20 mM Tris, 125 mM NaCl, 0.1% Tween 20), the membrane was incubated with appropriate HRP-linked secondary antibody (anti-mouse: CST; anti-rabbit: Thermo Scientific) and visualized by using ECL solutions (Thermo Scientific) according to the manufacturer’s instructions. Band intensities were measured and quantified using ImageJ software.
Quantitative real-time PCR
Total RNA from cells or brain tissues was isolated using Trizol reagent (Invitrogen). The RNA pellet was dissolved in nuclease-free water (Promega), and total RNA concentration was determined using a NanoDrop spectrophotometer (Thermo Scientific). Total RNA, reaction buffer, and GoScript Reverse Transcriptase (Promega) were mixed in a total volume of 20 μl, and reverse transcription was carried out in a thermal cycler (Bio-Rad) at 25°C for 5 min, 42°C for 60 min, and 70°C for 15 min. Real-time PCR was performed with a SYBR Green PCR kit (TaKaRa Biotechnology) in a qPCR machine (Bio-Rad) for 40 cycles (95°C for 10 s, 60°C for 30 s). Relative mRNA level of Agrp (forward, 5′-CTGCAGACCGAGCAGAAGA-3′; reverse, 5′-TGCGACTACAGAGGTTCGTG-3′) was determined by the delta-delta Ct method and normalized to that of Gapdh (forward, 5′-ATCACTGCCACCCAGAAGAC-3′; reverse, 5′-ACACTTGGGGGTAGGAACA-3).
Free fatty acid analysis
Serum (50 μl) and cells (5.0 × 10⁵) were sonicated with cold methanol:chloroform:water, 2:1:1 (v/v/v) containing an internal standard (20 nM D2-oleate). Samples were centrifuged at 4°C for 10 min at 12,000 × g. Organic phases were dried in a TurboVap evaporator (Biotage). Samples were reconstituted in hexane with 0.5 M KOH-MeOH and incubated at 25°C for 10 min. BCl3-MeOH (12% w/w) was then added. The samples were heated at 70°C for 10 min, cooled on ice for 5 min, and then hexane:water, 2:1 (v/v) were added. Samples were vortexed. The supernatants were transferred into autosampler vials. Fatty acid methyl esters (FAMEs) were analysed using a gas chromatograph – triple quadrupole tandem mass spectrometer (GC-QQQ-MS/MS; an Agilent 7890A series GC system coupled with an Agilent 7000C QQQ MS/MS). An Ultra HP-5 ms capillary column (30 m × 0.25 μm, i.d. 0.25 μm film thickness, Agilent J&W Scientific) was used. The instrument temperature was set as follows: inlet, 250°C; transfer line, 290°C; ion source, 230°C; quadrupoles, 150°C. The capillary voltage was set at 70 eV. The gradient was run at a flow rate of 1.2 ml He/min, 4°C/min with 50°C up to 240°C. Detected FAMEs were quantified using MassHunter software (Agilent Technologies).
Statistical analysis
All data are shown as mean ± SEM. Statistical significance was determined by Student t test using built-in software in GraphPad Prism 7. p values of <0.05 were considered statistically significant.
Results
Acute starvation alters serum free fatty acid profiles in mice
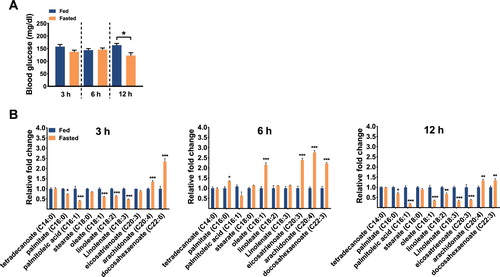
To identify specific FFAs that have a potential to generate a hunger signal in response to acute starvation, mice were fed or fasted for 3, 6, and 12 h from the beginning of the dark period. In accordance with previous reports showing lower glucose levels in plasma (Maeda et al. Citation2004; Andrikopoulos et al. Citation2008) and serum (Geisler et al. Citation2016) of fasted mice, blood glucose level was significantly lower in mice fasted for 12 h, but not at earlier time points (A). However, serum FFA profiles fluctuated among the 3 time points. Arachidonate and docosahexaenoate showed higher levels in the fasted groups at all 3 time points compared to the fed groups. At 6 h, palmitate, oleate, eicosatrenoate, arachidonate, and docosahexaenoate were increased in the fasted groups. These FFAs were reduced after 12–h fasting (B). These results suggest that some FFAs released by starvation may act as a hunger signal during acute fasting.
Figure 1. Changes in blood glucose level and serum free fatty acid profiles by acute starvation in mice. (A) Changes in blood glucose levels and (B) serum free fatty acid levels were measured in mice fasted for 3, 6, or 12 h. Data are mean ± SEM. *p < 0.05, **p < 0.01, and ***p < 0.001.
SFA but not MUFA or PUFA induce autophagy in hypothalamic cells
To identify whether autophagy is induced by saturated fatty acids (SFA), monounsaturated fatty acids (MUFA), or polyunsaturated fatty acids (PUFA) in hypothalamic cells, orexigenic neuropeptide – expressing N41 cells were treated with these FFAs. Palmitate, a type of SFA, elevated the levels of LC3-II in a dose-dependent manner (A). Co-treatment with palmitate and lysosomal inhibitors (EP: E64d and pepstatin A) further increased the levels of LC3-II, indicating that the increases in LC3-II induced by palmitate reflect an increased autophagy flux (B). In contrast, oleate (a MUFA) and arachidonate (a PUFA) did not alter LC3-II levels in N41 cells (C–F). Inhibition of lysosomal activity with oleate and arachidonic acid treatment led to no further changes in LC3-II levels, confirming that oleate and arachidonate do not induce autophagy in N41 cells (D and F).
Figure 2. Palmitate but not oleate or arachidonate induces autophagy. (A) N41 cells were treated with palmitate (Pal) for 4 h at the indicated concentrations. The levels of LC3-II and GAPDH were determined by immunoblotting. (B) Treatment of palmitate-treated N41 cells with lysosomal protease inhibitors (EP), E64d (10 μg/ml) and pepstatin A (PepA: 10 μg/ml), for 4 h confirmed the increase in autophagy flux induced by palmitate. (C) Cells were treated with oleate (OL) under the same conditions and (D) autophagy flux was confirmed by EP treatment. (E) Cells were treated with arachidonate (AA) under the same conditions and (F) autophagy flux was confirmed by using EP. (G) Lipid droplets were stained with the fluorescent dye BODIPY in N41 cells treated with palmitate (Pal: 0.06 mM) or oleate (OL: 0.06 mM) with or without EP or rapamycin (Rapa), respectively, for 4 h. Nuclei were visualized by Hoechst. Scale bar: 10 μm. Data are mean ± SEM. *p < 0.05, **p < 0.01, and ***p < 0.001.
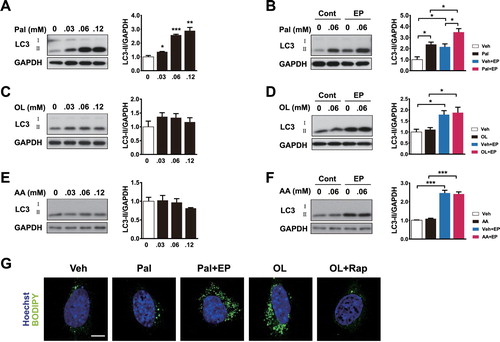
Palmitate induces lipophagy by degrading LDs in hypothalamic cells
To trace the changes in LDs induced by treatment with FFAs, we analysed the LDs by BODIPY staining in hypothalamic cells treated with palmitate or oleate in the presence of pharmacological reagents for regulating autophagy. EP, an autophagy inhibitor, was treated to hypothalamic cells with palmitate and rapamycin, an autophagy activator, was treated with oleate. Palmitate did not considerably affect LD staining, but in the presence of EP, LDs were accumulated because of autophagy inhibition (G). In contrast, oleate-induced accumulation of LDs was reduced by rapamycin (G). Taken together, these results suggest that palmitate but not MUFAs induces lipophagy by degrading LDs in the hypothalamic cells.
Lipophagy regulation leads to changes in Agrp expression in the presence of FFAs
Orexigenic neuropeptide expression was assessed in hypothalamic cells treated with palmitate and EP or oleate and rapamycin. LC3 immunoblots showed accumulation of LC3-II in N41 cells treated either with palmitate and EP, or with oleate and rapamycin, suggesting autophagy inhibition and induction was successful, respectively (A). Under the same conditions, palmitate increased Agrp expression (B). Notably, palmitate-induced Agrp expression was dramatically decreased by autophagy inhibition. In contrast, oleate failed to induce Agrp expression, but its expression was significantly increased when autophagy was induced by rapamycin (B). To corroborate the effects of pharmacological modulation of autophagy, we genetically inhibited the autophagy-related gene 5 (Atg5) by small interfering RNAs (siRNAs; knockdown) or by the clustered regularly interspaced short palindromic repeat-cas system (CRISPR-Cas9; knockout). Palmitate failed to induce autophagy and Agrp expression under Atg5-knockdown or Atg5-knockout conditions (C–F). Taken together, these results suggest that palmitate-induce lipophagy increases Agrp expression.
Figure 3. Autophagy regulation in the presence of palmitate leads to changes in Agrp expression. (A) LC3-II levels were analysed in N41 cells treated with palmitate (Pal: 0.06 mM) or oleate (OL: 0.06 mM) with or without lysosomal protease inhibitors (EP: E64d [10 μg/ml] and pepstatin A [PepA: 10 μg/ml]) and rapamycin (Rapa), respectively, for 4 h. (B) Agrp mRNA levels were analysed under the same conditions. (C) Atg5 was knocked down using siRNAs and ATG5, LC3, and GAPDH were detected by immunoblotting in N41 cells treated with or without palmitate. (D) Agrp mRNA levels were analysed under the same conditions. (E) Atg5 knockout (Atg5 KO) was conducted in N41 cells by the CRISPR/Cas9 system, and Atg5 and GAPDH were detected by immunoblotting. (F) The levels of Agrp mRNA in Atg5 KO N41 cells with or without palmitate were measured by quantitative real-time PCR. Data are mean ± SEM. *p < 0.05, **p < 0.01.
![Figure 3. Autophagy regulation in the presence of palmitate leads to changes in Agrp expression. (A) LC3-II levels were analysed in N41 cells treated with palmitate (Pal: 0.06 mM) or oleate (OL: 0.06 mM) with or without lysosomal protease inhibitors (EP: E64d [10 μg/ml] and pepstatin A [PepA: 10 μg/ml]) and rapamycin (Rapa), respectively, for 4 h. (B) Agrp mRNA levels were analysed under the same conditions. (C) Atg5 was knocked down using siRNAs and ATG5, LC3, and GAPDH were detected by immunoblotting in N41 cells treated with or without palmitate. (D) Agrp mRNA levels were analysed under the same conditions. (E) Atg5 knockout (Atg5 KO) was conducted in N41 cells by the CRISPR/Cas9 system, and Atg5 and GAPDH were detected by immunoblotting. (F) The levels of Agrp mRNA in Atg5 KO N41 cells with or without palmitate were measured by quantitative real-time PCR. Data are mean ± SEM. *p < 0.05, **p < 0.01.](/cms/asset/bdbf8152-0668-4a1b-8a20-aceb8e1a53de/tacs_a_1696407_f0003_oc.jpg)
Increases in MUFAs by palmitate are blunted in Atg5 knockout
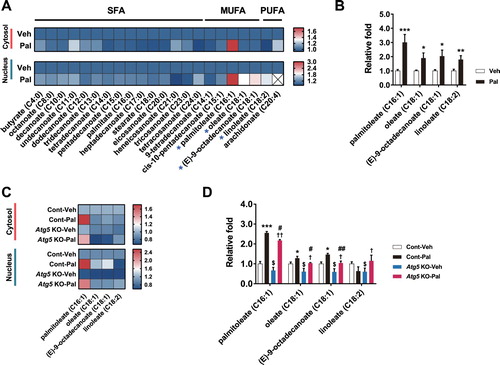
To identify FFAs generated by palmitate-induced lipophagy, we analysed the FFA profiles by gas chromatography–triple-quadrupole tandem mass spectrometry (GC-QQQ-MS/MS) in Atg5-knockout cells treated with palmitate. Palmitoleate levels were significantly increased by palmitate in the cytosol of hypothalamic cells (A and B). In addition, the levels of palmitoleate, oleate, (E)-9-octadecanoate, and linoleate were significantly increased in the nucleus. Interestingly, the increases in MUFAs (palmitoleate, oleate and (E)-9-octadecanoate) by palmitate were significantly blunted in Atg5-knockout cells (C and D).
Figure 4. Lipophagy regulates contents of fatty acids in the cytosol and nucleus. (A) Heatmap of cytosolic/nuclear free fatty acids analysed by targeted GC-MS/MS metabolomics of normal hypothalamic cells treated with palmitate. (B) Palmitate elevates MUFAs (palmitoleate, oleate, (E)-9-octadecanoate) and PUFA (linoleate) in the nucleus. (C) Heatmap of cytosolic and nuclear MUFAs and PUFA analysed by targeted GC-MS/MS metabolomics of Atg5 KO N41 cells treated with palmitate. (D) Increases in MUFAs induced by palmitate are blunted in Atg5 KO cells. Data are mean ± SEM. Cont, control (no Atg5 KO); Pal, palmitate; Veh, vehicle. *p < 0.05, **p < 0.01, ***p < 0.001 for Cont-Veh vs. Cont-Pal; $p < 0.05 for Cont-Veh vs. ATG5 KO-Veh; †p < 0.05; ††p < 0.01 for Atg5 KO-Veh vs. Atg5 KO-Pal; #p < 0.05, ##p < 0.01 for Cont-Pal vs. Atg5 KO-Pal.
Discussion
In the present study, we demonstrated that lipophagy induced in hypothalamic cells by palmitate, a specific type of SFAs, degrades cytosolic LDs into intracellular FFAs and increases Agrp expression in hypothalamic cells. The metabolomics analysis indicated an increase in MUFAs liberated from LDs by lipophagy. Atg5 deficiency study confirmed that these changes are autophagy-dependent.
Intracellular FFAs generated by autophagy may have multiple functions. In general, FFAs are metabolized by catabolic processes, such as mitochondrial β-oxidation, and anabolic processes, which produce biologically important molecules such as phospholipids, second messengers, and local hormones (Wakil and Abu-Elheiga Citation2009; Wrighton Citation2015). On the other hand, autophagy may provide a source of signalling molecules by degrading LDs under low-nutrient conditions to drive appetite. In hypothalamic GT1-7 cells, an increase in fatty acid content by starvation-induced autophagy regulates lipid metabolism and Agrp expression (Kaushik et al. Citation2011). Interestingly, FFAs liberated by lipophagy in hypothalamic tanycytes increase ATP production and reduce the expression of orexigenic neuropeptides in mice with high fat diet – induced obesity (Kim et al. Citation2019). Our results show that inhibition of autophagy leads to accumulation of intracellular LDs accompanied by attenuation of a palmitate-induced increase in Agrp gene expression. In this regard, derivatives of intracellular FFAs may play a role in the transcriptional regulation of neuropeptides responsible for appetite control, and autophagy could play a critical role in this regulation by providing signalling molecules.
Palmitate reportedly has orexigenic effects, and these effects were blunted by autophagy inhibition (Benoit et al. Citation2009; Milanski et al. Citation2009; Kaushik et al. Citation2011). However, these orexigenic effects are controversial; one study reported that i.c.v. infusion of palmitate had no effect on 24-h food intake compared to control (Schwinkendorf et al. Citation2011), whereas another study reported no acute effect on food intake in fasted mice but blunted anorexigenic action of leptin (Kleinridders et al. Citation2009). Food intake is inhibited by central administration of MUFAs (Obici et al. Citation2002; Jo et al. Citation2009; Schwinkendorf et al. Citation2011) and by intravenous infusion of oleate (Oh et al. Citation2016). Ingestion of palmitoleate reduces appetite by activating the CCK signalling pathway (Nunes and Rafacho Citation2017), but the role and mechanism of appetite regulation by these FFAs in the hypothalamus have not been determined. It seems that diverse physiological environments determine the roles of different types of FFAs in food intake.
Our results suggest that increases in MUFAs by palmitate-induced lipophagy in the hypothalamic nucleus may be involved in transcriptional regulation of Agrp expression. Unsaturated fatty acids play a role in the interaction with transcription factors. Oleate and PUFAs including ω-3, ω-6 bind to the ligand of peroxisome proliferator activated receptors (PPARs) and activate gene transcription in the liver (Varga et al. Citation2011; Jump et al. Citation2013). In the brain, docosahexaenoate binding to retinoid X receptor (RXR) regulates lipid metabolism and cholesterol transport (de Urquiza et al. Citation2000). Therefore, further studies would be of interest to investigate whether MUFAs in the nucleus interact with transcriptional factors to regulate Agrp transcription.
Disclosure statement
No potential conflict of interest was reported by the authors.
Additional information
Funding
References
- Andrews ZB, Liu ZW, Walllingford N, Erion DM, Borok E, Friedman JM, Tschop MH, Shanabrough M, Cline G, Shulman GI, et al. 2008. UCP2 mediates ghrelin's action on NPY/AgRP neurons by lowering free radicals. Nature. 454(7206):846–851. doi: 10.1038/nature07181
- Andrikopoulos S, Blair AR, Deluca N, Fam BC, Proietto J. 2008. Evaluating the glucose tolerance test in mice. Am J Physiol Endocrinol Metab. 295(6):E1323–E1332. doi: 10.1152/ajpendo.90617.2008
- Benoit SC, Kemp CJ, Elias CF, Abplanalp W, Herman JP, Migrenne S, Lefevre AL, Cruciani-Guglielmacci C, Magnan C, Yu F, et al. 2009. Palmitic acid mediates hypothalamic insulin resistance by altering PKC-theta subcellular localization in rodents. J Clin Invest. 119(9):2577–2589. doi: 10.1172/JCI36714
- de Urquiza AM, Liu S, Sjoberg M, Zetterstrom RH, Griffiths W, Sjovall J, Perlmann T. 2000. Docosahexaenoic acid, a ligand for the retinoid X receptor in mouse brain. Science. 290(5499):2140–2144. doi: 10.1126/science.290.5499.2140
- Dole VP. 1956. A relation between non-esterified fatty acids in plasma and the metabolism of glucose. J Clin Invest. 35(2):150–154. doi: 10.1172/JCI103259
- Fick LJ, Fick GH, Belsham DD. 2011. Palmitate alters the rhythmic expression of molecular clock genes and orexigenic neuropeptide Y mRNA levels within immortalized, hypothalamic neurons. Biochem Biophys Res Commun. 413(3):414–419. doi: 10.1016/j.bbrc.2011.08.103
- Geisler CE, Hepler C, Higgins MR, Renquist BJ. 2016. Hepatic adaptations to maintain metabolic homeostasis in response to fasting and refeeding in mice. Nutr Metab (Lond). 13:62. doi: 10.1186/s12986-016-0122-x
- Jo YH, Su Y, Gutierrez-Juarez R, Chua S Jr. 2009. Oleic acid directly regulates POMC neuron excitability in the hypothalamus. J Neurophysiol. 101(5):2305–2316. doi: 10.1152/jn.91294.2008
- Jump DB, Tripathy S, Depner CM. 2013. Fatty acid-regulated transcription factors in the liver. Annu Rev Nutr. 33:249–269. doi: 10.1146/annurev-nutr-071812-161139
- Kaushik S, Rodriguez-Navarro JA, Arias E, Kiffin R, Sahu S, Schwartz GJ, Cuervo AM, Singh R. 2011. Autophagy in hypothalamic AgRP neurons regulates food intake and energy balance. Cell Metab. 14(2):173–183. doi: 10.1016/j.cmet.2011.06.008
- Kim S, Kim N, Park S, Jeon Y, Lee J, Yoo SJ, Lee JW, Moon C, Yu SW, Kim EK. 2019. Tanycytic TSPO inhibition induces lipophagy to regulate lipid metabolism and improve energy balance. Autophagy. 1–21. doi:10.1080/15548627.2019.1659616.
- Kleinridders A, Schenten D, Konner AC, Belgardt BF, Mauer J, Okamura T, Wunderlich FT, Medzhitov R, Bruning JC. 2009. Myd88 signaling in the CNS is required for development of fatty acid-induced leptin resistance and diet-induced obesity. Cell Metab. 10(4):249–259. doi: 10.1016/j.cmet.2009.08.013
- Lam TK, Schwartz GJ, Rossetti L. 2005. Hypothalamic sensing of fatty acids. Nat Neurosci. 8(5):579–584. doi: 10.1038/nn1456
- Lee J, Kim K, Yu SW, Kim EK. 2016. Wnt3a upregulates brain-derived insulin by increasing NeuroD1 via Wnt/beta-catenin signaling in the hypothalamus. Mol Brain. 9(1):24. doi: 10.1186/s13041-016-0207-5
- Liu K, Czaja MJ. 2013. Regulation of lipid stores and metabolism by lipophagy. Cell Death Differ. 20(1):3–11. doi: 10.1038/cdd.2012.63
- Lopez M, Tovar S, Vazquez MJ, Nogueiras R, Senaris R, Dieguez C. 2005. Sensing the fat: fatty acid metabolism in the hypothalamus and the melanocortin system. Peptides. 26(10):1753–1758. doi: 10.1016/j.peptides.2004.11.025
- Maeda N, Funahashi T, Hibuse T, Nagasawa A, Kishida K, Kuriyama H, Nakamura T, Kihara S, Shimomura I, Matsuzawa Y. 2004. Adaptation to fasting by glycerol transport through aquaporin 7 in adipose tissue. Proc Natl Acad Sci U S A. 101(51):17801–17806. doi: 10.1073/pnas.0406230101
- Milanski M, Degasperi G, Coope A, Morari J, Denis R, Cintra DE, Tsukumo DM, Anhe G, Amaral ME, Takahashi HK, et al. 2009. Saturated fatty acids produce an inflammatory response predominantly through the activation of TLR4 signaling in hypothalamus: implications for the pathogenesis of obesity. The J Neurosci Off J Soc Neurosci. 29(2):359–370. doi: 10.1523/JNEUROSCI.2760-08.2009
- Nunes EA, Rafacho A. 2017. Implications of palmitoleic acid (palmitoleate) on glucose homeostasis, insulin resistance and diabetes. Curr Drug Targets. 18(6):619–628. doi: 10.2174/1389450117666151209120345
- Obici S, Feng Z, Morgan K, Stein D, Karkanias G, Rossetti L. 2002. Central administration of oleic acid inhibits glucose production and food intake. Diabetes. 51(2):271–275. doi: 10.2337/diabetes.51.2.271
- Oh YT, Oh HH, Nguyen AK, Choi CS, Youn JH. 2016. Circulating free fatty acids inhibit food intake in an oleate-specific manner in rats. Physiol Behav. 167:194–201. doi: 10.1016/j.physbeh.2016.09.015
- Rosen ED, Spiegelman BM. 2006. Adipocytes as regulators of energy balance and glucose homeostasis. Nature. 444(7121):847–853. doi: 10.1038/nature05483
- Schulze RJ, Sathyanarayan A, Mashek DG. 2017. Breaking fat: The regulation and mechanisms of lipophagy. Biochim Biophys Acta Mol Cell Biol Lipids. 1862(10 Pt B):1178–1187. doi: 10.1016/j.bbalip.2017.06.008
- Schwinkendorf DR, Tsatsos NG, Gosnell BA, Mashek DG. 2011. Effects of central administration of distinct fatty acids on hypothalamic neuropeptide expression and energy metabolism. Int J Obes. 35(3):336–344. doi: 10.1038/ijo.2010.159
- Singh R. 2011. Hypothalamic lipophagy and energetic balance. Aging (Albany NY). 3(10):934–942. doi: 10.18632/aging.100393
- Singh R, Cuervo AM. 2012. Lipophagy: connecting autophagy and lipid metabolism. Int J Cell Biol. 2012:282041. doi: 10.1155/2012/282041
- Singh R, Kaushik S, Wang Y, Xiang Y, Novak I, Komatsu M, Tanaka K, Cuervo AM, Czaja MJ. 2009. Autophagy regulates lipid metabolism. Nature. 458(7242):1131–1135. doi: 10.1038/nature07976
- Spector R. 1988. Fatty acid transport through the blood-brain barrier. J Neurochem. 50(2):639–643. doi: 10.1111/j.1471-4159.1988.tb02958.x
- Sprangers F, Romijn JA, Endert E, Ackermans MT, Sauerwein HP. 2001. The role of free fatty acids (FFA) in the regulation of intrahepatic fluxes of glucose and glycogen metabolism during short-term starvation in healthy volunteers. Clin Nutr. 20(2):177–179. doi: 10.1054/clnu.2000.0372
- Varga T, Czimmerer Z, Nagy L. 2011. PPARs are a unique set of fatty acid regulated transcription factors controlling both lipid metabolism and inflammation. Biochim Biophys Acta. 1812(8):1007–1022. doi: 10.1016/j.bbadis.2011.02.014
- Wakil SJ, Abu-Elheiga LA. 2009. Fatty acid metabolism: target for metabolic syndrome. J Lipid Res. 50(Suppl S):138–S143. doi: 10.1194/jlr.R800079-JLR200
- Wang CW. 2016. Lipid droplets, lipophagy, and beyond. Biochim Biophys Acta. 1861(8 Pt B):793–805. doi: 10.1016/j.bbalip.2015.12.010
- Wrighton KH. 2015. Lipid metabolism: fatty acids on the move. Nat Rev Mol Cell Biol. 16(4):205. doi: 10.1038/nrm3972