
ABSTRACT
Three-dimensional numerical simulations are performed to analyze the effect of the aspect ratio Ar and axial magnetic field on thermocapillary convection in liquid bridges with deformable free-surface under microgravity, in which the volume of fluid (VOF) method is adopted to track the free-surface movement. The simulation results elucidate that the oscillation wave number m and frequency of temperature fluctuation decrease with increasing Ar, while the amplitude of temperature fluctuation increases with increasing Ar. The deformation ratio ξ of the free-surface increases as Ar increases. The numerical results also reveal that the axial magnetic field causes a concentration of convection vortexes near the free-surface and effectively suppresses the flow in both the radial and axial directions. Moreover, the axial magnetic field effectively damps free-surface deformation, so that the deformation ratio ξ decreases as the Hartmann number Ha increases. The temperature displays a uniform and linear distribution along the free-surface and the axis of molten zone when Ba = 0.3 T.
Nomenclature
| Ar | = | aspect ratio, Ar = L/r1 |
| A | = | average oscillation amplitude, |
| b | = | induced magnetic field vector (T) |
| B | = | magnetic field vector (T) |
| Ba | = | intensity of the applied axial magmatic fields (T) |
| Ca | = | Capillary number, |
| d | = | distance of the cell center apart from the midline EF |
| fl | = | Lorentz force (N·m−3) |
| f | = | frequency at monitoring point N |
| g | = | gravitational acceleration (m2·s−1) |
| Ha | = | Hartmann number, |
| J | = | induced current (A·m−2) |
| k | = | unit tangential vector |
| L | = | length of the liquid bridge (cm) |
| Ma | = | Marangoni number, |
| m | = | hydrothermal wave number |
| n | = | unit normal vector |
| N | = | monitoring point |
| P | = | pressure (Pa) |
| Pr | = | Prandtl number, |
| Prm | = | magnetic Prandtl number, |
| Q | = | convergence criteria |
| r | = | radius of the liquid bridge (cm) |
| rmax | = | maximum radius of the free-surface (cm) |
| rmin | = | minimum radius of the free-surface (cm) |
| Re | = | Reynolds number, |
| Rem | = | magnetic Reynolds number, |
| t | = | time (s) |
| T | = | temperature (K) |
| Tc | = | temperature of cold disk (K) |
| Th | = | temperature of hot disk (K) |
| Tav | = | average temperature of half-zone (K) |
| TNav | = | average temperature at the monitoring point N (K) |
| ΔT | = | temperature difference, ΔT = Th−Tc (K) |
Greek Symbols
| μ | = | dynamic viscosity (kg·m−1·s−1) |
| υ | = | kinematic viscosity (m2·s−1) |
| χ | = | thermal diffusivity (K−1) |
| ρ | = | density (kg·m−3) |
| Cp | = | specific heat (J·kg−1·K−1) |
| λ | = | thermal conductivity (W·m−1·K−1) |
| δ | = | thickness of the air layer |
| σ | = | surface tension (N·m−1) |
| ξ | = | deformation ratio, |
| = | temperature coefficient of surface tension (N·m−1·K−1) | |
| = | electric conductivity | |
| u, v, w | = | the velocity components in the r, z and θ directions (cm·s−1) |
| r, θ, z | = | radial, azimuthal and axial coordinates |
Subscripts
| a | = | axial magmatic field |
| av | = | average |
| c | = | cold wall |
| h | = | hot wall |
| max | = | maximum |
| min | = | minimum |
| 1 | = | inner melt fluid |
| 2 | = | outer air fluid |
1. Introduction
Single crystal silicon is an important semiconductor material that is in high demand in electronics, information technologies and optoelectronic devices, etc. due to its high performance and low cost (Lappa & Savino, Citation2002; Takagi, Okano, & Dost, Citation2012). Therefore, the compositional uniformity of and absence of defects in the grown crystals is extremely important. The floating zone (FZ) method for growing higher-quality single crystals is considered very promising under microgravity. However, the effect of thermocapillary convection induced by the surface tension gradient on the crystal quality is an issue. Furthermore, the instability of thermocapillary convection is the major cause of macroscopic defects during the FZ crystal growth process (Sankar, Venkatachalappa, & Do, Citation2011). In order to produce homogeneous bulk silicon crystals under microgravity, the oscillatory flow must be theoretically analyzed and its instability must be well controlled.
Schwabe and Frank (Citation1999) found that oscillatory thermocapillary convection was one of the sources of crystal growth striations. Since the above-mentioned discovery, many studies have been conducted on thermocapillary flow in liquid bridges with a non-deformed free-surface. Lappa, Savino, and Monti (Citation2001) found that the azimuthal wave number is a monotonically decreasing function of the geometrical aspect ratio. Yano, Nishino, Kawamura, Ueno, and Matsumoto (Citation2015) experimentally investigated the instability and associated roll structures of Marangoni convection in liquid bridges on the International Space Station. The roll structures traveled in the same direction as the surface flow (co-flow direction) for 1.00 ≤ AR ≤ 1.25 (where AR = height/diameter), while they traveled in the opposite direction (counter-flow direction) for AR ≥ 1.50. Melnikov, Shevtsova, Yano, and Nishino (Citation2015) investigated the Marangoni convection in liquid bridges for a wide range of aspect ratios by experiment and simulation. Their results illustrated that the heat loss has a destabilizing effect on aspect ratios (ratio of radius to height) below 2.4.
Up to now, the oscillatory thermocapillary flow in liquid bridges with a deformable free-surface has only been reported on by a few researchers. Sim, Kim, and Zebib (Citation2004a, Citation2004b) investigated the dynamic free-surface deformations in a two-dimensional (2D) axisymmetric liquid bridge. The free-surfaces were convex near the cold wall, while near the hot wall they changed from concave to convex with an increasing Reynolds number (Re). A static deformation free-surface was analyzed by Lappa (Citation2005), in which the free-surface was assumed to be a convex or concave shape. The simulation results demonstrated that the stability of the flow field was very sensitive to the geometrical aspect ratio AF (length/diameter) and free-surface shape (convex or concave). Zhou and Huai (Citation2015a, Citation2015b) investigated the thermo-solutocapillary convection in an open rectangular cavity and a liquid bridge with a dynamic free-surface. The free-surface bulged out at the two ends of the zone and bulged in at the central zone when the thermal Marangoni number was identical to the solutal Marangoni number. Yang, Liang, Yan, Gao, and Feng (Citation2015) investigated thermocapillary convection and surface fluctuation in a liquid bridge under lateral vibrations which inhibited the surface flow.
Due to the high conductivity of silicon-melt, the application of a magnetic field is the most appropriate method for controlling and damping the deleterious flow during the crystal growth process. Many kinds of magnetic fields, such as the axial magnetic field, transverse magnetic field, rotating magnetic field and non-uniform magnetic field, have been performed. Substantial theoretical and numerical works have been dedicated to the magnetic damping of thermocapillary convection (Yao, Zeng, Chen, & Li, Citation2012; Yao, Zeng, & Li, Citation2011; Zhou & Huang, Citation2010). For the axial magnetic field, Liang, Yang, and Li (Citation2014) found that the Lorentz force strongly damped the fluid flow not only in the radial direction inside the liquid bridge but also in the circumference direction near free-surface. The influence of a static axial magnetic field was also performed by Jaber, Saghir, and Viviani (Citation2009), and they found that the convective flow was efficiently damped by the axial magnetic field. However, most simulations neglected the effect of free-surface deformation.
Although few works have been performed which have considered free-surface deformation, most of the studies have focused on a 2D axisymmetric liquid bridge or static deformable surface. The flow and free-surface deformation behaviors in 3D liquid bridges and the impact of the axial magnetic field on free-surface deformation are not clearly illustrated. The very existence of these issues result in an intellectual curiosity that needs to be satisfied. Thus, the purpose of present works is to investigate and actively control the transport behaviors (flow field, temperature field and free-surface deformation) which occur during the crystal growth process. Both the effect of Ar and the applied axial magnetic field are analyzed with regard to the instability of thermocapillary convection.
2. Physical and mathematical models
The physical configuration of the present study consists of two concentric columns (inner and outer) of immiscible fluids, as shown in (a). The inner column fluid, the characteristic length of which is L and the radius of which is r1, limiting the aspect ratio of Ar = L/r1, is suspended between two coaxial disks at a temperature difference of ΔT = Th−Tc, and the fluid material is silicon-melt. The lower disk (hot wall) is maintained at a constant temperature Th, while the upper disk (cold wall) is at a lower temperature Tc. The outer column fluid of height H and thickness δ = r2−r1 has air as its fluid material. A cylindrical coordinate system (r, θ, z) is adopted, with the z-axis along the vertical centerline of the cylindrical liquid bridge and the origin located at the center of lower disk. The magnetic lines of the external axial magnetic field are assumed to permeate the whole molten zone without change, as shown in (b).
Figure 1. Sketch of the liquid bridge and magnetic lines of the axial magnetic field: (a) coordinate system, and (b) magnetic lines.
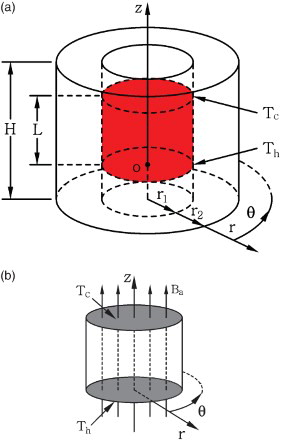
The following assumptions are introduced in our models: (1) the two kinds of fluids are incompressible Newtonian fluids; (2) the flow is laminar; (3) the system is under microgravity (set at 0g in the present investigation, where g denotes gravitational acceleration); and (4) the interface of the melt and the air is deformable. The surface tension of the interface is assumed a linear function of temperature
(1)
where σ0 is the surface tension for T = T0, T0 indicates the reference temperature of the initial surface tension (which is equal to the melting point temperature; Lappa, Citation2005; Zeng et al., Citation2001), and
is the negative rate of change of the surface tension with temperature.
2.1. Governing equations
With the above assumptions, the non-dimensional governing equations are obtained respectively from the overall continuity, momentum, energy (i = 1, 2; where 1 denotes the inner fluid and 2 denotes the outer fluid):
(2)
(3)
(4)
where the variables are non-dimensionalized as
,
,
,
,
,
,
,
,
. And
,
,
, and
are the dimensionless dynamic viscosity, thermal conductivity, density and specific heat, respectively.
The induced magnetic field b can be derived from Maxwell's equations and Ohm's law as follows:
(5)
where B* is the magnetic field intensity, which includes both the applied
and the induced magnetic field b* component. The induced current density is
and the Lorentz force is expressed as fl = J × B.
The dimensionless parameters Reynolds, magnetic Reynolds, Prandtl, magnetic Prandtl, Marangoni, capillary and Hartmann numbers are given by:
2.2. Free-surface deformation
presents the sketch of the free-surface and boundary conditions in the vertical section. The position of the interface is described by a function F(z), where F(0) = F(L) = r1 = R0, and the initial shape of the interface is assumed to be a cylindrical surface. The stress balance between the silicon-melt and the air on the free-surface, R = F(z), is controlled by
(6)
where Sik, Ri (i = 1, 2) are the tensor of viscous stress and normal radii of curvature, P and P0 are the pressure of the inner and outer fluid, and k and n are the unit tangential vector and outward unit normal vector, respectively. The mean curvature is defined as
(7)
where the subscript z denotes the derivative Fz = dF/dz. The normal and tangential projections of Equation (7) are given by
(8)
(9)
Figure 2. Sketch of the free-surface and boundary conditions in the vertical section.
The location of the interface is determined by the normal projection Equation (8). The tangential projection Equation (9) defines the driving thermocapillary force. Since the liquid is assumed to be incompressible, its total volume must remain constant:
(10)
2.3. Boundary and initial conditions
The boundary conditions are written as follows:
(11a)
(11b)
(11c)
(11d)
The initial condition is expressed as
(12)
In the present works, the thermophysical properties of the two kinds of fluids used are readily available in , the properties of which are in accordance with Dold, Cröll, Lichtensteiger, Kaiser, and Benz (Citation2001).
Table 1. Thermophysical properties of the two kinds of fluids.
3. Numerical method
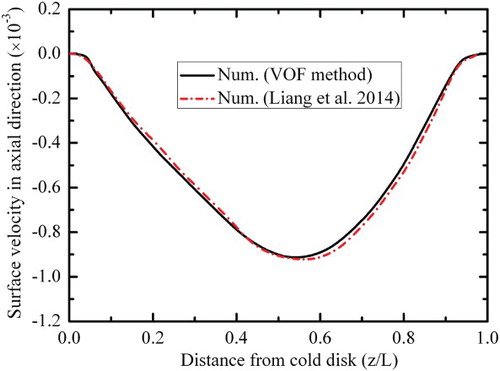
The volume of fluid (VOF) method is widely adopted to track the free-surface movement (Chokri, Zouhaier, Mohamed, & Khlifa, Citation2010; Zhou, Liu, & Ou, Citation2011), and it is also applied in the present numerical strategy. The governing equations are discretized by the finite volume method. The central difference approximation is applied to the diffusion terms. The first-order upwind scheme for the convection term is used, and the flow field is solved using the SIMPLE algorithm. The surface axial velocity distributions at Ba = 0.5 T obtained from present work (using the same physical properties and parameters as Liang et al., Citation2014) are compared with the work of Liang et al. (Citation2014), and an expectantly close agreement is observed for this case, as shown in .
Figure 3. Surface axial velocity distribution at Ba = 0.5 T, Ar = 1 and Pr = 61.
The grid system employed in the present computations is an axisymmetric and non-uniform grid. A finer mesh gradation is utilized in the regions where strong velocity and temperature gradients are anticipated, which includes the regions near the upper and lower disks, as well as the interface. In order to check the grid independence, simulations with four sets of different meshes, as shown in , are performed at Ma = 1.64 × 10⁴, Ba = 0.5 T, Ar = 1.5. The last two sets of grid (M3 and M4) show almost the same average axial velocity and temperature at the monitoring point N(r/r1 = 0.5, θ = 0°, z/L = 0.5). The choice of grid 80r × 120θ × 80z (M3) corresponds to a reasonable compromise between the minimum dependence of the threshold of the instability upon the mesh size and the computational time. For each time step (which has been validated using the adapted calculation time step), the quotient is calculated for all dependent variables in all grid points. If Q ≤ 10−5 is valid for all variables in all grid points, the solution is interpreted as converged. All calculations were performed using six CPUs on the local Beowulf-Linux cluster.
Table 2. Main characteristics of the different meshes for Ma = 1.64 × 10⁴, Ba = 0.5 T, and Ar = 1.5.
4. Results and discussion
4.1. The effect of the aspect ratio on the oscillatory flow
In order to explore the spatio-temporal details of the flow pattern and free-surface deformation of a liquid bridge, and also understand the impact of Ar on the oscillatory thermocapillary flow, numerical simulations were conducted based on liquid bridge models with values of Ar in the range of 1 to 2. Here, the radius (r1) of the two disks is 1 cm and the height (L) of the molten zone is from 1 cm to 2 cm. Other parameters adopted are as follows: ΔT = 45 K, Ma = 1.64 × 10⁴, and Ca = 0.026.
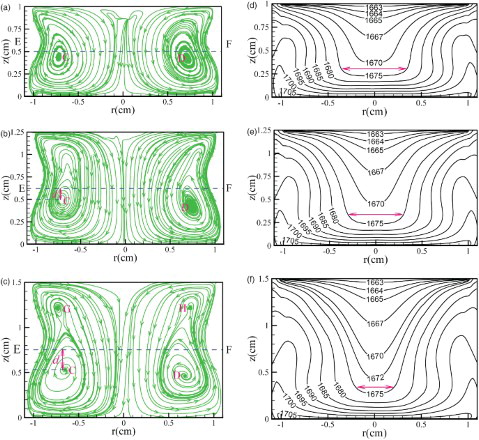
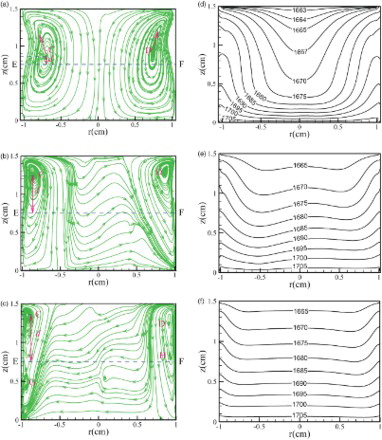
Any temperature difference (ΔT > 0) may produce a surface tension gradient at the free-surface, which is called the Marangoni phenomenon. The thermocapillary induced by the Marangoni effect flows from the hot wall towards the cold wall along the interface and returns back to the center (see ). As can be seen from the streamlines in (a, b, and c), the whole molten zone appears to be almost entirely occupied by two larger convection vortexes with a clockwise circulation in the left half of the domain and a counterclockwise circulation in the right half of the domain. The streamlines all show a narrow ‘neck-shaped’ structure strongly concentrated near the interface. However, the differences in flow pattern are also detectable for different values of Ar. At Ar = 1 (see (a)), two vortexes (C and D) form in the molten zone. Due to the small deformation of the free-surface, the vortexes C and D are located close to the midline of EF; with Ar increasing to 1.25 (see (b)), the two vortexes stretch along the axial direction. Owing to the increase of free-surface deformation, the distance d of the vortexes (C and D) away from the midline of EF increases; when increasing the value of Ar further to 1.5 (see (c)), the distance d also increases and the main vortexes break up into two pairs of vortexes. The vortexes of G and H at the upper region are the newly emerged vortexes. Near the interface and in the center of the liquid bridge, the isotherms all perform a non-uniform and distortion distribution (see (d, e, f)). This is because the surface flow is strong near the interface and the return flow is also strong at the center of molten zone, which makes an obvious distortion of the isotherms. Near the hot and cold walls, the isotherms perform in a relatively flat and uniform manner because the convection heat transfer is weak and the heat conductivity is predominant. Comparing the isotherms of the three cases, they also exhibit similar structures. Nevertheless, with the increasing values of Ar, the narrow low temperature area becomes sharper at the center (indicated by the arrow zone in (d, e, f)) and the extent of the bulge decreases at the free-surface. In addition, the extent of the contraction of the isotherms increases with increasing values of Ar, because the degree of inward shrinking of free-surface increases with increasing values of Ar.
Figure 4. Streamlines (a, b, c) and isotherms (d, e, f) on the θ = 0° plane for (a, d) Ar = 1, (b, e) Ar = 1.25, and (c, f) Ar = 1.5.
For a better understanding of the effect which Ar has on the instability melt flow, the radial velocity distributions for different values of Ar on the z/L = 0.5 plane are shown in . It was found that the radial velocity distribution presents a ‘petal shape’ on the middle plane of the liquid bridge. At Ar = 1, the ‘petal’ number is 12, indicating that the oscillation wave number m is 12. But some ‘petals’ are pretty blurry in the region from θ = 90° to θ = 150° (see (a)) because of the oscillatory and deformable free-surface. At Ar = 1.25, the oscillation wave number m decreases to 8 (see (b)) and as Ar increases to 1.5, the oscillation wave number m decreases to 6 (see (c)). Thus, at Ma = 1.64 × 10⁴ and Ca = 0.026, hydrothermal wave instability of the thermocapillary convection occurs in the whole liquid bridge and is weakened as Ar increases, i.e., the wave number m decreases from 12 to 6 as Ar increased from 1 to 1.5 (see ), demonstrating that the wave number decreases as Ar increases. Moreover, there is a negative velocity zone at the interface because the free-surface shrinks inward in the middle section of the molten zone.
Figure 5. Radial velocity distributions on the z/L = 0.5 plane for (a) Ar = 1, (b) Ar = 1.25, and (c) Ar = 1.5.
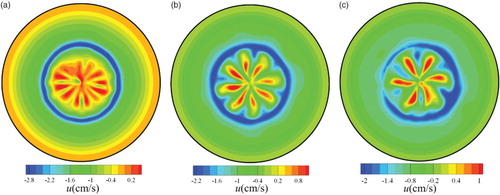
Figure 6. Oscillatory wave number m varying with Ar.
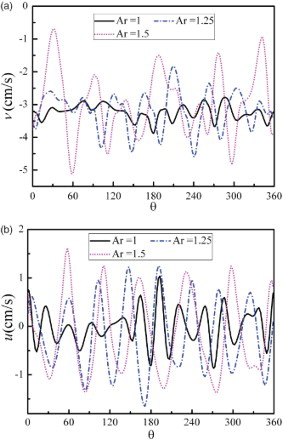
In order to provide more insight into the above observations, the axial and radial velocity distribution along the circumferential direction at r/r1 = 0.5 on the z/L = 0.5 plane for different values of Ar are exhibited in . From examining the axial velocity in (a), obvious oscillation behaviors are found on the three axial velocity oscillatory curves. The axial velocity of the three curves is negative, indicating that the flow direction is from the upper disk towards the lower disk. At Ar = 1, the velocity oscillation is disorder, ad hoc in the region from θ = 40° to θ = 150°. As Ar increases, the amplitude of the axial velocity increases and the peak number decreases. Strong oscillation behaviors are also found on the radial velocity oscillatory curves of (b). At Ar = 1, the peak number is 12 and the amplitude of the radial velocity is small, but the wave crests are pretty blurry in the region from θ = 90° to θ = 150°. As Ar increases, the amplitude of radial velocity increases and the peak number decreases from 12 to 6 because, for small values of Ar, the surface tension gradient is higher, inducing stronger instability in the thermocapillary convection in the liquid bridge. It is worth mentioning that the peak number of the radial velocity of (b) is consistent with the oscillation wave number m of . For example, the peak number of radial velocity is 8 at Ar = 1.25 (see (b)), and the oscillation wave number m is also equal to 8 (see (b)).
Figure 7. Velocity distribution along the circumferential direction at r/r1 = 0.5 on the z/L = 0.5 plane for different values of Ar for (a) the axial velocity, and (b) the radial velocity.
presents the transient temperature at the monitoring point N(r/r1 = 0.5, θ = 0°, z/L = 0.5), varying with time for different values of Ar. Strong oscillatory behaviors emerge on the temperature fluctuation curves. At Ar = 1 (see (a)), the frequency of temperature fluctuation is highest while the period average amplitude of the transient temperature is lowest in that of the three values of Ar. The period average amplitude of transient temperature obviously changes in different periods, indicating that a second transition of thermocapillary flow occurs. When Ar is 1.25 (see (b)), the frequency of temperature fluctuation decreases to 1.367 Hz while the period average amplitude of the transient temperature increases to 1.2 K; when Ar increases to 1.5 (see (c)), the frequency of temperature fluctuation further decreases to 1.2 Hz and the period average amplitude of the transient temperature further increases to 1.5 K, indicating that the instability of thermocapillary convection decreases. The period average temperature and frequency at the monitoring point N varying with different values of Ar are shown in . As Ar increases from 1 to 1.5, the frequency of the monitoring point N decreases from 1.67 Hz to 1 Hz, while the average temperature of the monitoring point N increases from 1679.1 K to 1682.73 K.
Figure 8. Temperature fluctuations at monitoring point N for (a) Ar = 1, (b) Ar = 1.25, and (c) Ar = 1.5.
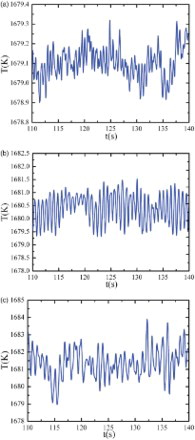
Figure 9. Average temperature and frequency at monitoring point N varying with Ar.
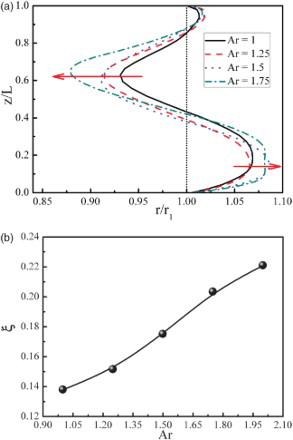
illustrates variations of the free-surface deformation F(z) ((a)) and deformation ratio ξ ((b)) varying with values of Ar (the deformation ratio ξ is defined as ξ = (rmax−rmin)/r1, where rmax is the maximum radius of the free-surface and rmin is the minimum radius of the free-surface). As can be seen in (a), the free-surfaces all bulge outward at the two ends of the half-zone and shrink inward in the middle section of the molten zone. In other words, it is convex near the two ends of the half-zone and concave in the middle region of the liquid bridge. As a result, the free-surface presents a typical narrow ‘neck-shaped’ structure, which shows the same behavior as the streamlines in (a, b, c). All four lines keep the same tendency, the maximum bulge points whose axial positions are z/L = 0.15 and z/L = 0.95 and the maximum contraction point whose axial positions is z/L = 0.63, while the extent of the maximum bulge and constriction points increases as Ar increases in the radial position. For instance, at Ar = 1, the radial position of the maximum convex point is rmax/r1 = 1.058 and the maximum concave point is rmin/r1 = 0.93. However, at Ar = 1.75, the radial position of the maximum convex point shifts outward to rmax/r1 = 1.08 and the maximum concave point shrinks inward to rmin/r1 = 0.878. This shows that the extent of the free-surface deformation increases as Ar increases, which can also clearly be seen in deformation ratio ξ from (b). The deformation ratio ξ increases from 0.14 to 0.22 as Ar increases from 1 to 2. Moreover, the volume of convex at two ends of the zone is equal to that of the concave in the central region for different values of Ar, which makes the total volume of deformed liquid bridge equal to that of the initial cylindrical one (see (a)). That is to say, the volume is conserved. Similarly, at θ = 90°, the free-surface shows the same behavior as that when θ = 0°.
Figure 10. (a) Free-surface deformation F(z) and (b) deformation ratio ξ varying with Ar on the θ = 0° plane.
4.2. The effect of the axial magnetic field on the oscillatory flow
Since the thermocapillary convection and its instability are the major causes of some macroscopic defects in the crystal produced, it is desirable to suppress this deleterious flow. One of the effective methods of controlling convection flow is magnetic damping, in which the applied magnetic field generates a Lorentz force to inhibit the unstable flow. In order to investigate the effect of the axial magnetic field on the melt convection and temperature fields as well as the instability of the thermocapillary flow in a liquid bridge with a deformable free-surface, the liquid bridge models are kept with the constants of Ar = 1.5, Ma = 1.64 × 10⁴, ΔT = 45 K, and Ca = 0.026. The intensity of the applied axial magnetic field Ba varies from 0 to 0.3 T, and the corresponding Hartmann number Ha is 0 to 171.8.
presents the streamlines and isotherms on the θ = 0° plane at different intensities of the magnetic field Ba. Since the damping effect of Lorentz forces of axial magnetic fields reduces the volume transport of the thermocapillary vortex along the radial direction, and the damping effect increases with increasing Ba, the thermocapillary vortexes are confined near the vicinity of the free-surface – that is, the axial magnetic field causes a concentration of convection cells in the vicinity of the free-surface. Comparing (a, b, c) to (c), in the absence of a magnetic field, the main vortexes occur in the lower region and the newly formed vortexes occur in the upper region of the molten zone. At Ba = 0.1 T, the vortexes C and D move gradually towards the upper region and the broken-off vortexes G and H merge together with C and D (see (a)). At Ba = 0.2 T, the distance d between the vortexes (C and D) and the midline of EF increases. The vortexes further concentrate towards the interface (see (b)). When Ba = 0.3 T, the distance d further increases and the main vortexes C and D are broken into two pairs of new vortexes again by further compression of the axial magnetic field. The vortexes are maintained at the interface and the narrow ‘neck-shaped’ structure gradually disappears (see (c)). Similarly, an obvious distortion of isotherms is found near the free-surface and also at the center of molten zone in the case when Ba = 0.1 T (see (d)), which is similar to that without axial magnetic field ((f)). However, the distortion of the isotherms diminishes gradually as Ba increases (see (e, f)). Because the flow structure and heat transport are dominated by Lorentz force, the thermocapillary convection is also weakened. Thus, the isotherms in the liquid bridge tend to be flatter and become a uniform and regular distribution.
Figure 11. Streamlines (a, b, c) and isotherms (d, e, f) on the θ = 0° plane for (a, d) Ba = 0.1 T, (b, e) Ba = 0.2 T, and (c, f) Ba = 0.3T.
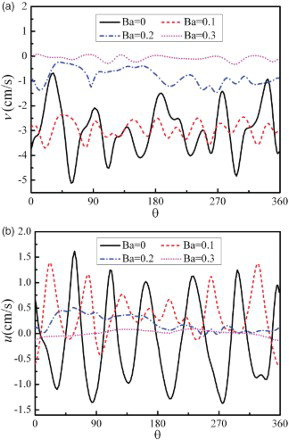
illustrates the axial and radial velocity distribution along the circumferential direction at r/r1 = 0.5 on the z/L = 0.5 plane for different values of Ba. From (a) showing the axial velocity oscillatory curves, a strong oscillation of axial velocity is found and the peak number is 7 in the case without the axial magnetic field. However, the amplitude of axial velocity decreases as Ba increases. When the intensity of the magnetic field is at 0.3 T, the axial velocity is fully damped, the wavelike state does not appear, and the velocity is almost 0. The radial velocity distribution of (b) shows similar behavior to the axial velocity distribution of (a). The radial velocity is also efficiently damped when the axial magnetic field is applied. The physical mechanism occurring here is that of the Lorentz force strongly damping thermocapillary convection under the effect of the axial magnetic field. Therefore, the oscillatory thermocapillary convection is effectively suppressed along both the radial and axial directions.
Figure 12. Velocity distribution along the circumferential direction at r/r1 = 0.5 on the z/L = 0.5 plane with different values of Ba for (a) the axial velocity, and (b) the radial velocity.
The velocity vector of thermocapillary convection along the axial direction does not produce a velocity component along the radial direction when the flow is axisymmetric. When the flow is oscillation and non-axisymmetric, thermocapillary flow produces the velocity component along the radial direction and the radial velocity u produces inhomogeneity along the circumference. The average oscillation amplitude A along the circumference is calculated as (Chen & Li, Citation2008):
where N is the number of control volumes along the circumference direction. gives the values of A along the circumference at r/r1 = 0.5 on the z/L = 0.5 plane under different values of Ba. It can be seen that the value of A decreases linearly with as Ha increases. The critical magnetic field strength Ba can be determined using a linear regressive extrapolation method and the point of A = 0 is the steady state of thermocapillary convection. Therefore, the critical magnetic field strength is Ha = 172.5, and the corresponding Ba is 0.301 T.
Figure 13. Average amplitude of the radial velocity varying with Ha at r/r1 = 0.5 on the z/L = 0.5 plane.
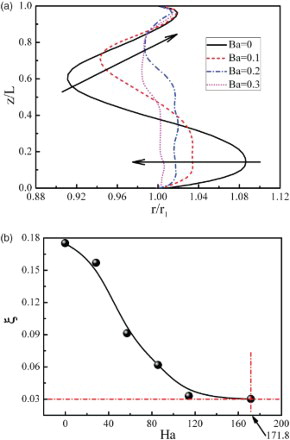
In order to investigate the effect of the intensity of magnetic field on free-surface deformation, the free-surface deformation F(z) and deformation ratio ξ varying with Ha are shown in . In the case without the axial magnetic field, the axial positions of the maximum convex and maximum concave points are z/L = 0.13 and z/L = 0.6, respectively. When the axial magnetic field is applied, the extent of both the bulge and the contraction becomes smaller, and the convex region moves inward while the concave region moves towards cold wall, as shown in (a). The extent of the free-surface deformation decreases as Ba increases and the free-surface tends to be a straight line, which can be confirmed by the deformation ratio ξ in (b). When Ha increases from 0 to 114.5, the deformation ratio ξ decreases rapidly, and as Ha increases from 114.5 to 171.8, the deformation ratio ξ increases slowly. As Ha = 171.8 (Ba = 0.3 T), the slope of the deformation ratio curve is almost 0 and the deformation ratio ξ is 0.03, as shown in (b). Therefore, the critical magnetic field strength Ba is approximately 0.3 T, which is almost consistent with the critical magnetic field strength in .
Figure 14. (a) Free-surface deformation F(z) and (b) deformation ratio ξ varying with Ha on the θ = 0° plane.
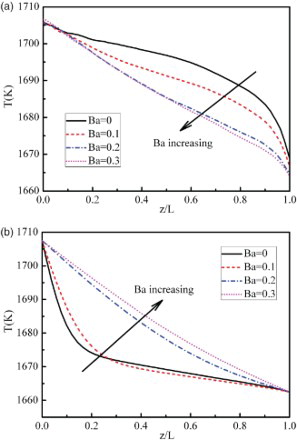
The influence of the axial magnetic field on the temperature distributions along the free-surface and axis of half-zone is also investigated. elucidates the free-surface and axis temperature distributions under a magnetic field strength Ba from 0 to 0.3 T. In the absence of the magnetic field, both the free-surface and axis temperature present ‘bow-shaped’ distributions. The ‘bow’ shape of temperature distribution on the free-surface bends upward (see (a)), while that along the axis bends downward (see (b)). With increasing values of Ba, the ‘bow’ shape gradually disappears. As Ba = 0.3 T, the temperature displays a uniform and linear distribution along the free-surface and axis of molten zone, indicating that the thermocapillary flow is efficiently damped by the axial magnetic field.
Figure 15. Temperature distributions along (a) the free-surface of the liquid bridge and (b) the axis of the liquid bridge for different values of Ba.
5. Conclusion
In the present paper, 3D numerical simulations are carried out to analyze the effect of the aspect ratio Ar and the axial magnetic field Ba on oscillatory thermocapillary convection and free-surface deformation during the single crystal process, in which the VOF method was employed to track the free-surface movement. From the results, the following conclusions can be drawn:
The effect of Ar plays an important role with the flow and temperature fields. There are strong oscillations in both the axial and radial velocities in the whole molten region, and the oscillation wave number of the radial velocity m decreases from 12 to 6 as Ar increases from 1 to 1.5. Moreover, as Ar increases, the frequency of temperature fluctuation decreases and the amplitude increases.
The free-surface is convex near the two ends of the liquid bridge and concave in the middle section, and the deformation ratio ξ increases as Ar increases.
The axial magnetic field causes a concentration of convection cells near the free-surface and effectively suppresses the occurrence of oscillatory convection. It also damps the convection flow along both the radial and axial directions.
The axial magnetic field is helpful for damping free-surface deformation. The deformation ratio ξ decreases as Ha increases, and the critical magnetic field strength is Ba = 0.301 T in this case. In addition, the temperature displays a uniform and linear distribution along the free-surface and axis of molten zone when Ba = 0.3 T.
Our present works are limited to the investigations, and related experimental work will be considered in the future. In addition, the effect of Marangoni number, rotating magnetic field and non-uniform magnetic field on thermocapillary convection in deformable liquid bridges will also be investigated in our future works. We will aim to determine the critical Marangoni number of the critical temperature difference.
Acknowledgements
This work was supported by the National Nature Science Foundation of China [grant number 51276089].
Disclosure statement
No potential conflict of interest was reported by the authors.
References
- Chen, S. X., & Li, M. W. (2008). Flow instability of buoyant-Marangoni convection in the LEC GaAs melt. Science in China Series E: Technological Sciences, 51, 397–406. doi:10.1007/s11431-008-0042-8
- Chokri, M., Zouhaier, H., Mohamed, O., & Khlifa, M. (2010). A moving grid model for simulation of free surface behavior induced by horizontal cylinders exit and entry. Engineering Applications of Computational Fluid Mechanics, 4, 260–275. doi:10.1080/19942060.2010.11015315
- Dold, P., Cröll, A., Lichtensteiger, M., Kaiser, T., & Benz, K. W. (2001). Floating zone growth of silicon in magnetic fields. IV. rotating magnetic fields. Journal of Crystal Growth, 231(1), 95–106. doi:10.1016/S0022-0248(01)01491-9
- Jaber, T. J., Saghir, M. Z., & Viviani, A. (2009). Three-dimensional modelling of GeSi growth in presence of axial and rotating magnetic fields. European Journal of Mechanics B/Fluids, 28, 214–223. 10.1016/j.euromechflu.2008.07.001 doi: 10.1016/j.euromechflu.2008.07.001
- Lappa, M. (2005). Analysis of flow instabilities in convex and concave floating zones heated by an equatorial ring under microgravity conditions. Computers & Fluids, 34, 743–770. doi:10.1016/j.compfluid.2004.01.003
- Lappa, M., & Savino, R. (2002). 3D analysis of crystal/melt interface shape and Marangoni flow instability in solidifying liquid bridges. Journal of Computational Physics, 180, 751–774. doi:10.1006/jcph.2002.7131
- Lappa, M., Savino, R., & Monti, R. (2001). Three-dimensional numerical simulation of Marangoni instabilities in non-cylindrical liquid bridges in microgravity. International Journal of Heat and Mass Transfer, 44, 1983–2003. 10.1016/S0017-9310(00)00243-X doi: 10.1016/S0017-9310(00)00243-X
- Liang, R. Q., Yang, S., & Li, J. Z. (2014). Thermocapillary convection in floating zone with axial magnetic fields. Microgravity Science and Technology, 25, 285–293. doi:10.1007/s12217-013-9353-x
- Melnikov, D. E., Shevtsova, V., Yano, T., & Nishino, K. (2015). Modeling of the experiments on the Marangoni convection in liquid bridges in weightlessness for a wide range of aspect ratios. International Journal of Heat and Mass Transfer, 87, 119–127. doi:10.1016/j.ijheatmasstransfer.2015.03.016
- Sankar, M., Venkatachalappa, M., & Do, Y. (2011). Effect of magnetic field on the buoyancy and thermocapillary driven convection of an electrically conducting fluid in an annular enclosure. International Journal of Heat and Fluid Flow, 32, 402–412. doi:10.1016/j.ijheatfluidflow.2010.12.001
- Schwabe, D., & Frank, S. (1999). Experiments on the transition to chaotic thermocapillary flow in floating zones under microgravity. Advances in Space Research, 24, 1391–1396. doi:10.1016/S0273-1177(99)00751-6
- Sim, B. C., Kim, W. S., & Zebib, A. (2004a). Axisymmetric thermocapillary convection in open cylindrical annuli with deforming interfaces. International Journal of Heat and Mass Transfer, 47, 5365–5373. 10.1016/j.ijheatmasstransfer.2004.03.031 doi: 10.1016/j.ijheatmasstransfer.2004.03.031
- Sim, B. C., Kim, W. S., & Zebib, A. (2004b). Dynamic free-surface deformations in axisymmetric liquid bridges. Advances in Space Research, 34, 1627–1634. 10.1016/j.asr.2004.09.003 doi: 10.1016/j.asr.2004.09.003
- Takagi, Y., Okano, Y., & Dost, S. (2012). A numerical simulation study on the effects of crucible rotation and magnetic fields in growth of SiGe by the traveling heater method. ASME Journal of Heat Transfer, 134(1), 012301. 10.1115/1.4004803 doi: 10.1115/1.4004803
- Yang, S., Liang, R. Q., Yan, F. S., Gao, T. Y., & Feng, Y. T. (2015). Thermocapillary convection and surface fluctuation in a liquid bridge under lateral vibrations. Microgravity Science and Technology, 27(1), 1–10. 10.1007/s12217-014-9407-8 doi: 10.1007/s12217-014-9407-8
- Yano, T., Nishino, K., Kawamura, H., Ueno, I., & Matsumoto, S. (2015). Instability and associated roll structure of Marangoni convection in high Prandtl number liquid bridge with large aspect ratio. Physics of Fluids, 27, 024108. doi:10.1063/1.4908042
- Yao, L. P., Zeng, Z., Chen, J. Q., & Li, L. (2012). Investigation of convection control under the non-uniform RMF in a liquid bridge. Procedia Engineering, 31, 659–664. 10.1016/j.proeng.2012.01.1082 doi: 10.1016/j.proeng.2012.01.1082
- Yao, L. P., Zeng, Z., & Li, X. H. (2011). Effects of rotating magnetic fields on thermocapillary flow in a floating half-zone. Journal of Crystal Growth, 316(1), 177–184. doi:10.1016/j.jcrysgro.2010.12.065
- Zeng, Z., Mizuseki, H., Simamura, K., Fukuda, T., Higashino, K., & Kawazoe, Y. (2001). Three-dimensional oscillatory thermocapillary convection in liquid bridge under microgravity. International Journal of Heat and Mass Transfer, 44, 3765–3774. doi:10.1016/S0017-9310(01)00012-6
- Zhou, L., Liu, D. Y., & Ou, C. Q. (2011). Simulation of flow transients in a water filling pipe containing entrapped air pocket with VOF model. Engineering Applications of Computational Fluid Mechanics, 5(1), 127–140. 10.1080/19942060.2011.11015357 doi: 10.1080/19942060.2011.11015357
- Zhou, X. M., & Huai, X. L. (2015a). Free surface deformation of thermo-solutocapillary convection in axisymmetric liquid bridge. Microgravity Science and Technology, 27(1), 39–47. doi:10.1007/s12217-014-9411-z
- Zhou, X. M., & Huai, X. L. (2015b). Thermosolutocapillary convection in an open rectangular cavity with dynamic free surface. Journal of Heat Transfer, 137, 082901. 10.1115/1.4029270 doi: 10.1115/1.4029270
- Zhou, X. M., & Huang, H. L. (2010). MHD effects on the instability of thermocapillary convection in two-layer fluid system. International Journal of Heat and Mass Transfer, 53, 5827–5834. doi:10.1016/j.ijheatmasstransfer.2010.08.001