
ABSTRACT
This study uses the lattice Boltzmann method (LBM) to simulate in 2D the capillary infiltration into porous structures obtained from the packing of particles. The experimental problem motivating the work is the densification of carbon preforms by reactive melt infiltration. The aim is to determine the optimization principles for the manufacturing of high-performance ceramics. Simulations are performed for packings with varying structural properties. The results suggest that the observed slow infiltrations can be ascribed to interface dynamics. Pinning represents the primary factor retarding fluid penetration. The mechanism responsible for this phenomenon is analyzed in detail. When surface growth is allowed, it is found that the phenomenon of pinning becomes stronger. Systems trying to reproduce typical experimental conditions are also investigated. It turns out that the standard for accurate simulations is challenging. The primary obstacle to overcome for enhanced accuracy seems to be the over-occurrence of pinning.
1. Introduction
Porous media are ubiquitous in science and engineering. Typical examples ripple across a number of disciplines such as hydrology, oil recovery, materials science, printing and solar technology, to cite but a few (Bear, Citation1972; Dullien, Citation1992; Furler et al., Citation2012; Goodall & Mortensen, Citation2014; Koponen et al., Citation1998). In simulations, the structures of porous media are investigated according to a variety of properties (mechanical, thermal and fluid dynamics) mainly through finite-element methods (Alawadhi, Citation2010; Bohn & Garboczi, Citation2003, FEMs). Capillarity is the spontaneous infiltration of a fluid into a porous medium (Alava, Dube, & Rost, Citation2004; Washburn, Citation1921). The adhesive forces between the liquid and solid phases are responsible for this phenomenon. Indicatively, its characteristic length scale is the micron (de Gennes, Brochard-Wyart, & Quéré, Citation2004). The focus of the present study lies in the role that the porous structure plays during capillary infiltration. Simulations are carried out using the lattice Boltzmann method (LBM) (Benzi, Succi, & Vergassola, Citation1992; Chen & Doolen, Citation1998; Succi, Citation2009; Sukop & Thorne, Citation2010; Wolf-Gladrow, Citation2005). The LBM is a numerical scheme for approximating hydrodynamic behavior that is especially well suited to problems involving complex boundaries and interface phenomena. Its main advantage over other approaches resides in the discretization of the velocity space and a statistical treatment of particle motion and collisions. Its applications encompass disparate critical systems (Bao et al., Citation2014; Ghosh, Patil, Mishra, Das, & Das, Citation2012; Haghani, Rahimian, & Taghilou, Citation2013; Joshi & Sun, Citation2010; H. Liu, Valocchi, & Kang, Citation2012; Wang & Pan, Citation2008). The accuracy is in general comparable with that of studies in computational fluid dynamics (CFD) based on the FEM (Succi, Citation2009).
The actual problem motivating the present research is the reactive infiltration of molten silicon (Si) into carbon (C) preforms (Bougiouri, Voytovych, Rojo-Calderon, Narciso, & Eustathopoulos, Citation2006; Dezellus & Eustathopoulos, Citation2010; Dezellus, Hodaj, & Eustathopoulos, Citation2003; Einset, Citation1996, Citation1998; Eustathopoulos, Citation2015; Eustathopoulos, Nicholas, & Drevet, Citation1999; Hillig, Mehan, Morelock, DeCarlo, & Laskow, Citation1975; Israel et al., Citation2010; G. W. Liu, Muolo, Valenza, & Passerone, Citation2010; Messner & Chiang, Citation1990; Mortensen, Drevet, & Eustathopoulos, Citation1997; Voytovych, Bougiouri, Calderon, Narciso, & Eustathopoulos, Citation2008). This is a complex phenomenon associated with a wetting transition and surface growth. A feature of this process is that Si reacts with C to form silicon carbide (SiC). Si wets SiC but does not wet C (Bougiouri et al., Citation2006). Furthermore, the reaction-formed phase causes a thickening of the surface behind the invading front (Bougiouri et al., Citation2006; Einset, Citation1996, Citation1998; Israel et al., Citation2010; Messner & Chiang, Citation1990). The interaction with the fluid flow results in a retardation of the infiltration up to its interruption because of pore clogging. This research has also gained increasing attention in industrial practice. Liquid Si infiltration (LSI) is a common manufacturing route to high-performance ceramics. Prominent advanced applications include armor and brake systems (Fan et al., Citation2008; Krenkel & Berndt, Citation2005; Roberson & Hazell, Citation2003). Significant engineering efforts are concentrated on the control of the effects of reactivity. Indeed, SiC formation provides additional hardness in the resulting ceramic material while also reducing the amount of residual unreacted Si, which is detrimental for high-temperature functioning. On the other hand, pore closure can stop infiltration before full densification is attained. The microstructure of the C preform is of course of importance for optimal impregnation, as well as for the operating behavior of the final ceramic product in specific applications (e.g. the length of reinforced C fibers; see Aghajanian et al., Citation2013; Gadow, Citation2000; Gadow & Speicher, Citation2000; Israel et al., Citation2010; Paik et al., Citation2002; Salamone, Karandikar, Marshall, Marchant, & Sennett Citation2008).
The effects of surface growth for systems composed of single capillaries both uniform and structured have been studied in 2D in previous works (Sergi, Grossi, Leidi, & Ortona, Citation2014, Citation2015). The focus of the present investigation is on making more precise the pore configurations that are of particular relevance for the industrial application of LSI. The strategy consists in first realizing porous structures approximating real porous preforms. To this end, packing systems are generated by using particles differing in basic attributes (size, shape and distribution). In principle, these parameters can be controlled by the selection and processing of powders. The packing structures are assembled by means of the random sequential addition (Sherwood, Citation1997; Widom, Citation1966). This is a simple and effective algorithm that allows reasonable volume fractions to be reached for random packings. The simulations for capillary infiltration aim at highlighting the function of specific pore and structural characteristics. The systems of this work display enhanced randomness with pores and channels of different sizes and orientations, inducing complex dynamics for the invading front. The significance of this investigation resides in the possibility of translating the findings into inputs for preform preparation in order to improve the quality of ceramic materials.
The present simulations indicate that the interface dynamics can be assumed to be responsible for small effective radii. Pinning of the contact line is the primary process affecting capillary infiltration. This work provides evidence for the mechanism responsible for determining pinning in random systems. Packings of particles based on bimodal size distributions turn out to provide features reducing the strong retardation of liquid invasion associated with pinning. Larger particles introduce walls creating channels that are filled faster while smaller particles make the pore structure more uniform. As a result, the interface travels longer distances before the loss of its curvature. Furthermore, the probability of encountering the surfaces of other particles is higher. The present data also show that the inertia effects induced by acceleration remain of secondary importance. With surface growth, it is found that pore closure can be effective and that pinning is enhanced. The retardation effects are stronger for fast infiltrations (higher degree of orientation disorder), which nevertheless remain more advantageous. Furthermore, with surface growth, bimodal size distributions lead to better results. Simulations with higher resolution for the porous structure are also performed for a direct comparison with experimental expectations. In this case, the effect of surface growth on pore closure is mainly indirect because pinning is stronger. Furthermore, the relative strength of capillary forces is too weak. This means that the details of the infiltration process suffer from discrepancies with real conditions. For example, this implies that the ratio of the infiltrated distance to the thickness of the growing surface (i.e. the width of the reaction-formed phase) is too small in the simulations. Progress seems especially possible by reducing the phenomenon of pinning.
2. Models and analysis
For the formalism of the LBM models the interested reader is directed to Sergi et al. (Citation2014). In the sequel, the same notation and terminology are employed. It is recalled that in experiments with molten Si and some alloys the invading front exhibits a kinetics linear with time (Israel et al., Citation2010; Voytovych et al., Citation2008). The standard Washburn law for capillary infiltration in a vacuum predicts a parabolic time dependence. The observed experimental behavior can be reproduced with the simulations by assuming that the systems are composed by two fluid components (Chibbaro, Citation2008; Chibbaro, Biferale, Diotallevi, & Succi, Citation2009; Diotallevi, Biferale, Chibbaro, Lamura, et al., Citation2009; Diotallevi, Biferale, Chibbaro, Pontrelli, et al., Citation2009). This means that the effect of the reaction at the contact line is equivalent to the resistance due to the presence of a second non-wetting component as dense and viscous as the wetting one (Sergi et al., Citation2014). This approach does not explain the origin of the linear behavior for the infiltration kinetics generally ascribed to effects of the reactivity (Israel et al., Citation2010; Voytovych et al., Citation2008).
The differential equation describing capillary infiltration for two fluids with the same density ρ and dynamic viscosity μ into a single channel in 2D reads (Chibbaro, Biferale, Diotallevi, & Succi, Citation2009):
(1) where z is the position of the invading front, r is the radius of the channel, and L is the length of the channel. The first term on the left-hand side accounts for inertial forces while the second one introduces viscous forces. The term on the right-hand side is due to capillary forces. When inertial forces are neglected, for a shrinking radius such as
(where
is the initial radius and k is the reaction-rate constant), a solution to the above equation is given by
(2) where
is the initial position. For completeness, in the absence of a reaction, a solution to Equation (Equation1
(1) ) which also takes the inertial forces into account is obtained by (Chibbaro, Biferale, Diotallevi, & Succi, Citation2009):
(3) where
and
. For more general porous systems, the radius of the channel is replaced with the effective radius. Relevant studies on reactive infiltration based on dynamics can be found in Asthana Asthana, Singh, and Sobczak (Citation2005), Gern and Kochendörfer (Citation1997), Martins, Olson, and Edwards (Citation1988), Messner and Chiang (Citation1990), Sangsuwan, Orejas, Gatica, Tewari, and Singh (Citation2001), and Yang and Ilegbusi (Citation2000).
The simulation output is in model units. For the units of the basic quantities of mass, length, the symbols mu, lu and ts are used, respectively. The data obtained from simulations can be expressed in regular units of the International System SI after suitable transformations (Chibbaro, Biferale, Binder, et al., Citation2009; Chibbaro, Costa, et al., Citation2009; Gross, Varnik, Raabe, & Steinbach, Citation2010; Joshi and Sun, Citation2010; Komnik, Harting, & Herrmann, Citation2004). For comparisons with experimental data the approach is applied based on dimensionless numbers like the Reynolds or capillary numbers (Landau & Lifshitz, Citation2008). For example, these numbers compare the relative strengths of the effects of the inertial, viscous and capillary forces. Two systems are assumed to be equivalent when the dimensionless numbers for the dominating forces have the same values. For the present purposes, dimensionless numbers involving the characteristic time set by the surface reaction are also needed (Sergi, Camarano, Molina, Ortona, & Narciso, Citation2016):
where v is the characteristic velocity of the system.
,
, and
compare the reaction with surface tension, viscosity, and inertia, respectively; for completeness,
compares inertia with the capillary forces. In the present terminology, the first force becomes more important as the dimensionless number increases. In the notation used here, the Reynolds and capillary numbers are given by
and
. In the onset of pore closure,
tends toward zero faster and thus surface tension is the dominant force. Inertia has the weakest effect since
diverges while
and
tend to zero. By using the average value
for the time-varying effective radius, the same conclusions are obtained.
For the characterization of the porous systems, the Darcy law is used (Sukop & Thorne, Citation2010):
where v is the interstitial velocity, ϕ is the porosity, P is the pressure and K is the permeability. Another quantity that is taken into account is the tortuosity (Bear, Citation1972) which is defined as the ratio of the actual length of the capillary paths to the corresponding length of the sample. The formula
(Duda, Koza, & Matyka, Citation2011; Matyka & Koza, Citation2012) is used for the computations, where u is the magnitude of the fluid velocity of the components
and
. It is worth recalling that at the interface there are spurious currents (Wagner, Citation2003).
3. Packing systems
It is standard practice to reproduce the microstructure of composite materials with random packings (Scocchi et al., Citation2013; Torquato, Citation2002). The problem consists in filling the empty space with particles arranged in a disordered way. The realization of high volume fractions can also be quite challenging (Donev et al., Citation2004). The principle of the algorithm for the random sequential addition is to place one particle after another in the simulation domain (Sherwood, Citation1997; Widom, Citation1966). In the case of overlap between a test particle and an existing one, the trial is not accepted and a new particle is considered. This procedure is iterated up to the desired filling fraction. With this algorithm it is not easy to exceed values beyond 0.6.
In order to generate the packing systems for the LBM simulations, the algorithm proposed in Sergi, D'Angelo, Scocchi, and Ortona (Citation2012) is employed. The method consists in breaking down the particles into small cubes. The lengths are measured in units of the small cubes which make up the particles according to the rule , where n is the number of cubes and
is the length of their sides. Here, spheres, rhombs and sticks with a certain degree of randomness for their size are considered. For a given value of n, the associated lengths are chosen with a Gauss distribution with an average ℓ and a standard deviation
. When the rotation of the particles is allowed, the rotation angles around the three axes are at most
and
. The domain is a cube of side 1 divided into N=256 bins. The porous medium for the LBM simulations is obtained by suitably replicating the packing systems. The minimal distance between two small cubes is
. An external pressure is applied toward the center of the domain in order to obtain more compact structures when necessary, as is the case for higher degrees of disorder, for example. The other parameters for the pressure are the same as those used in Sergi et al. (Citation2012).
The packing systems aim to reproduce the basic characteristics resulting from the use of common commercial powders for preform preparation. In order to make the distinction between round-shaped and sharp-edged morphologies for the particles, spheres and rhombs are considered. For example, the latter geometry can approximate the elongated shape of SiC particles. Fibers are also used in an attempt to understand the role of long walls. Concerning the size, the distribution is bimodal, multimodal or monomodal (coarse and fine particles). The properties of the packing systems are summarized in Tables to , while Figure shows sections for some of the systems. Briefly, both for spheres and rhombs, four different average sizes for the particles are considered (see Tables and ). Bimodal distributions from 1 to 3 are obtained by combining the largest particles with the other three types of particles in decreasing order for the size. For multimodal distributions, all the four types of particles are used. Monomodal distributions from 1 to 4 use only one type of particles, again in decreasing order for the size. For fibers three average lengths are considered (see Table ). The packing systems in this case are obtained by starting from the longest fibers and combining them with rhombs of three different sizes. The numbering of the systems follows the size of the particles in decreasing order.
Table 1. Relevant data for the packing structures composed of spheres.
Table 2. Basic information for the porous systems obtained from the packing of rhombs.
Table 3. Data for the packing structures obtained with fibers and rhombs.
Figure 1. 2D sections for packing structures: (a) bimodal1 for spheres, (b) fine1 for spheres, (c) multimodal for blocks, (d) bimodal3 with misalignment for blocks, (e) fiber1 for misalignment, (f) fiber6 for misalignment and tilt, and (g) the microstructure of a typical preform.
Note: The filler particles are shown in the dark sections. Further information on the structures can be found in Tables to .
4. Settings for LBM simulations
The LBM method is based on the discretization of the velocity space and a statistical treatment of the particle motion. In the Bhatnagar–Gross–Krook (BGK) approximation for the collisions (Bhatnagar, Gross, & Krook, Citation1954), LBM simulations remain versatile, efficient and accurate. Proper hydrodynamic behavior can be recovered in the incompressible limit at low Mach numbers (Chen & Doolen, Citation1998). The domain for simulations is
lu long and
lu wide. The porous structure has a length of
and the solid–liquid interface starts at
. The total number of time steps is given by
ts. In the region occupied by the porous structure the boundaries of the simulation domain are solid and subject to the common bounce-back rule; elsewhere they are periodic. This is done in order to reduce the phenomenon of pinning near narrow-to-wide parts (Blow, Kusumaatmaja, & Yeomans, Citation2009; Chibbaro, Biferale, Binder, et al., Citation2009; Chibbaro, Costa, et al., Citation2009; Kusumaatmaja, Pooley, Girardo, Pisignano, & Yeomans, Citation2008; Mognetti & Yeomans, Citation2009; Wiklund & Uesaka, Citation2012, Citation2013). The reason is that pinning can result in a significant slowdown of infiltration or even stop the flow. As explained previously, the problem is studied using a two-component system, or binary mixture (Chibbaro, Citation2008; Chibbaro, Biferale, Binder, et al., Citation2009; Sukop & Thorne, Citation2010). The viscosity is kept fixed with a relaxation time of
ts for both components. This choice is in general a guarantee for numerical stability (Sukop & Thorne, Citation2010). In the initial condition, half of the simulation domain is filled with the wetting fluid and the other half with the non-wetting one. At the start, the density for the main component is
mu/lu2 and the density for the dissolved component is
mu/lu2. The parameter for fluid–fluid interactions (cohesive forces) is set to
lu/mu/ts2 (Martys & Chen, Citation1996; Sukop & Thorne, Citation2010), resulting in a surface tension of
lu·mu/ts2 (Sergi et al., Citation2014). Solid–fluid interactions (adhesive forces) are determined by the parameters
lu/ts2 (Martys & Chen, Citation1996; Sukop & Thorne, Citation2010). With this choice the equilibrium contact angle turns out to be
(Sergi et al., Citation2014). This value is typical for Si droplets on SiC (Bougiouri et al., Citation2006; Voytovych et al., Citation2008). The details of the LBM models can be found in Sergi et al. (Citation2014).
The process of surface growth from the reaction is introduced by relying on a purely heuristic treatment. A description based on solute transport as in Sergi et al. (Citation2014, Citation2015) exhibits limitations related to the interface for solute transport. Namely, the interface can form inside the porous structures, leading to the diffusion of solute in the whole system. Therefore, in this work the reaction is implemented by making the surface of the solid phase grow behind the contact line at regular intervals of time. Specifically, the first layer around the solid boundaries is converted to the solid phase after every time steps. The reaction-rate constant is thus given by
lu/ts. This framework has the advantage of being suitable for a critical volume of simulations, which allows observation of the effects of pore structure and surface growth on fluid flow. Unless otherwise stated, these settings are maintained in the sequel.
5. Results and discussion
5.1. Packing systems
The results of the simulations for the systems obtained from the packing of spheres in the absence of a surface reaction are reported in Table . Here, z indicates the penetration attained on average at the end of the process and is an estimate of the deviations from the average. This quantity is determined from the maximum and minimum front displacement. It is to be noted that the error
is comparable to the infiltrated distance. This means that the fluid advances into the porous medium through selected pathways. It can be expected that these fingers then contribute to filling the pores left behind. It is worth noticing that the average error is 82 lu while the size of the largest particles is on average of 51 lu. As an example, in Figure a the formation of a finger can be recognized. Figure shows the kinetics of invasion. It turns out that the infiltration is slower for a monomodal distribution of the particle size. Fitting the data using Equation (Equation3
(3) ) results in the infiltration velocity
and effective radius
being derived (see Table ). It can be seen that the effective radius is one to two orders of magnitude smaller than the average particle size, as stressed in previous works (Einset, Citation1996; Patro, Bhattacharyya, & Jayram, Citation2007). The permeability K is determined under the conditions usually employed to reproduce Poiseuille flow, i.e., with a single fluid, periodic boundaries and an external acceleration (Sukop & Thorne, Citation2010). From Table it can be seen that the permeability for spheres is higher with bimodal size distributions. In order to assess the role of interface dynamics, the tortuosity is computed in two different ways:
is determined in the presence of an external acceleration as for the permeability, while
is obtained from the process of infiltration driven by capillary forces. The data in Table show that
is two orders of magnitude higher. As a consequence, the interface dynamics induced by the pore structure plays a prominent role. Meanwhile,
is obtained by an average over the velocities inside the porous media in the direction of infiltration, i.e., x. The difference with
is more marked when the process is slower. For a proper basis of comparison with systems which include the reaction, the characteristic dimensionless numbers are calculated by means of
(see Table ). It is also interesting to consider the Mach number defined as
, where
lu/ts is the speed of sound. From Table it can be seen that the order of magnitude of Ma is
. It follows that in this study the numerical error associated with the LBM scheme remains within the tolerance limits (He & Luo, Citation1997; Sukop & Thorne, Citation2010).
Figure 2. Fluid invasion for selected packing structures after ts: (a) simulation for bimodal1 with spherical particles, (b) infiltration for bimodal2 with rhombs in the presence of misalignment, (c) visualization of a system using fiber2, with misalignment and tilt, and (d) simulation of bimodal2 for rhombs with misalignment and surface reaction enabled.
Note: Red is used for the wetting fluid and blue for the non-wetting component. The initial solid phase is represented by the dark areas and the growing surface from the reaction is represented by the yellow areas. More details on the properties of the packing systems are reported in Tables to , and more details on the results of the infiltrations are reported in Tables to .
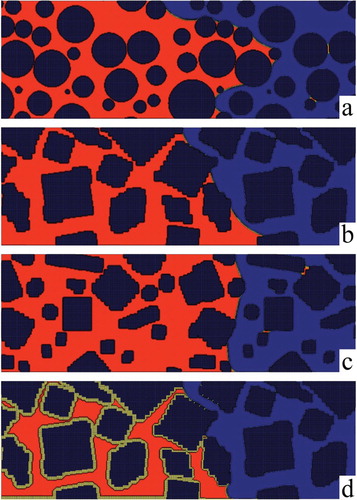
Figure 3. Infiltrated distance with chemical inertness for the solid surface: (a) packing structures obtained from spheres, and (b) packing structures realized with aligned rhombs.
Note: Points represent simulation results. The solid lines are fits to the data using Equation (Equation3(3) ). The basic properties of the packing systems are listed in Tables and .
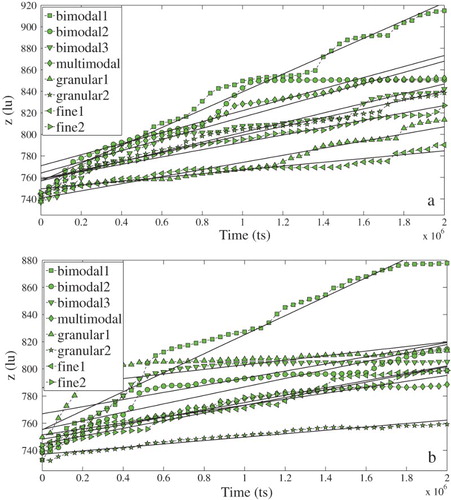
Table 4. Spheres composing the packing structures infiltrated without surface growth (see Table ).
Table 5. Rhombs composing the packing systems infiltrated with inert boundaries (see Table ).
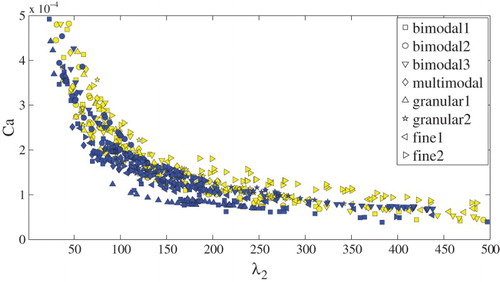
The results of the simulations without reactivity for packings of particles with the shape of rhombs are reported in Table . Figure shows the kinetics in the case of aligned rhombs. A comparison with the outcome for packings of spheres indicates that the structure arising from rhombs is subject to more pinning. It turns out that as the degree of disorder increases, the infiltration becomes faster. The fastest infiltrations are obtained with tilt and misalignment, even though the tortuosity attains a larger value on average. The dynamics with spheres remain still faster or at least comparable. A possible explanation for this observation is that the arrangement of rhombs can give rise to channels that are easily filled. The downside is that the phenomenon of pinning becomes more frequent. In 3D in a real preform, it is expected that the advantages will prevail since the connectivity of the pore chambers is higher and the number of pathways increases. For example, the particle walls above or below a 2D section and almost parallel to it contribute to a reduction in pinning. This point becomes clearer from the discussion on the advantages of bimodal size distributions. As expected, the permeability K is higher with increasing orientation disorder (see Table ). For aligned systems it also turns out that K attains higher values in the presence of larger particles. Figure shows the range of variation of Ca. The same behavior holds for Re; the same relation between Re and Ca is of course an identity. More marked variations are observed for
. The increase can amount to one order of magnitude. It is interesting to note that the deviations from the average values are stronger for rhombs since the filling of distinct channels and depinning introduce more accelerations. From the order of magnitude of the average values of Ca,
and Re, it is concluded that the effects of inertia are weak and that the capillary forces thus remain the dominant ones. Furthermore, in Figure it can be seen that for a given capillary number, the tortuosity seems to be slightly lower for aligned rhombs in a comparison with spheres. This tendency is also recognized in the presence of orientation disorder and for fluctuations of Ca. For clarity, this suggests that, when the fluid accelerates, the tortuosity is not higher and thus the resistance of inertia has a weak effect. So, in this case the averages of dimensionless numbers still provide an exhaustive description. As expected, it follows that the interface dynamics induced by the pore structure seems to play a more important role for the pronounced difference between
and
. Spurious currents at the interface should average out since it can be verified that, when the fits allowing
to be obtained are more precise, the discrepancies with
are smaller. Again, for aligned rhombs it arises that liquid penetration tends to be better with a bimodal distribution. This trend is less clear with misalignment and tilt. It should be said that, in this case, to a large extent the 2D sections lose the specific characteristics of the particles composing the packings. For this reason, it might be presumed that, in 3D, bimodal distributions should be more advantageous. Examination of the data associated with the maxima and minima for infiltration reveals that pinning is the discriminating factor coming into play. The basic mechanism at the origin of pinning is that the meniscus advances slowly while losing its curvature, resulting in a drop of capillary pressure. In the presence of channel walls, the front can travel a longer distance since the pinning sites are not vertically aligned. As a consequence, the meniscus can encounter the surface of new particles with higher probability before halting. In Figure b it can be seen that the front will further advance because it can hit the corner of another particle before losing its curvature. In packings with small particles the pinning sites are instead generally separated by small distances. The probability that the invading front stops moving is thus higher. It is also interesting to note that rhombs with bimodal distributions pack more efficiently. On average the filling fraction of their 2D sections is
higher than in the case of monomodal distributions. However, their infiltrations remain faster on average by
. It can be seen that the results are more sensitive to specific porous configurations than to the porosity. For more clarity, test simulations are performed for different porosities for the three bimodal systems composed of rhombs with particles aligned and misaligned. For filling fractions of 36% to 50% the penetration depth varies within a narrow range on average. This is partly in line with the discussion for the conditions helping the advancement of fluid. The porosity seems to start becoming detrimental for a filling fraction approaching
.
Figure 4. Relationship between the fluctuations of characteristic numbers and Ca for packing systems with spheres and rhombs in the absence of surface reaction.
Note: Yellow markers are used for spheres, blue for aligned rhombs, red for rhombs with misalignment and green for rhombs with misalignment and tilt (see Tables and ).
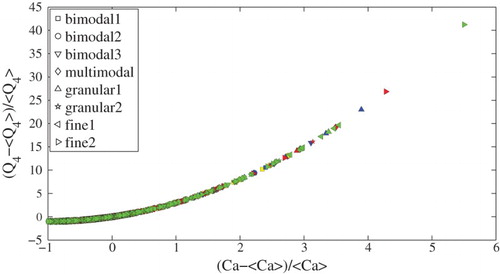
Figure 5. Relationship between the capillary number and the tortuosity for packing systems with spheres and rhombs in the absence of surface reaction.
Note: Yellow markers are used for spheres and blue for aligned rhombs. The properties of the packing systems are summarized in Tables and .
Packing structures with sticks are also considered in order to make clearer the role of channels arising from the arrangement of particles introducing long walls. Table summarizes the results of the simulations. It is clear that the systems with alignment lead to the fastest infiltrations. Furthermore, within this group the dynamics tend to be faster in the presence of longer sticks. These results show that fibers favor the formation of preferential infiltration paths. This also comes about as a result of the high values of the error on the average penetration depth. With orientation disorder, the results of rhombs and fibers are still comparable (cf. ). Sticks introduce more channels that are filled easily, inducing stronger accelerations. This also appears as a result of the fluctuations of Ca and Re that turn out to be more marked, also displaying higher peaks (results not shown for brevity). Nevertheless, for this set of data, capillary forces also remain the dominant ones. It is interesting to note that the simulations with misalignment and tilt can lead to quite fast infiltrations, even though the number of channels is lower. A possible explanation for this is that orientation disorder for fibers can be regarded as equivalent to the presence of small particles when 2D cross sections are considered. More precisely, in Figure c tilted fibers result in the presence of small grains in 2D sections favoring infiltration, as for bimodal designs. As a consequence, when the meniscus slides along the walls introduced by fibers, it is likely to encounter the surfaces of other particles before the interface becomes flat and pinning occurs. So, the results for fibers confirm the advantages identified for pore configurations associated with bimodal size distributions. The permeabilities for packings with fibers are more informative on the performance of the porous systems for capillary infiltration than in the presence of rhombs. It is also interesting to consider the influence of the surface area of the solid phase (Bear, Citation1972), i.e., the length of its boundary for 2D structures. In principle, for a given volume, spherical shapes tend to minimize the surface area while thin oblate spheroids maximize it. It is found that for systems obtained from spheres and rhombs, the boundary length of the solid phase is higher for the systems composed of small particles, in particular for spheres. The boundary of the solid phase is longer in the case of aligned fibers. With orientation disorder, the length of the solid boundary is still longer than that of systems with rhombs. By considering for the solid phase its surface area divided by its volume, known as the specific surface (Bear, Citation1972), it is found that systems with fibers exhibit higher values than bimodal systems on average. The specific surface is used for the characterization of powders. For the systems in this study, the specific surface is lower for rhombs because it is easier to realize compact packings with coarse particles. The highest values are obtained with fibers that have the advantage of favoring the formation of channels.
Table 6. Fibers added to the packing systems infiltrated without reactive boundaries (see Table ).
Table 7. Surface reaction enabled for the infiltration of packing systems obtained from rhombs (see Tables and ).
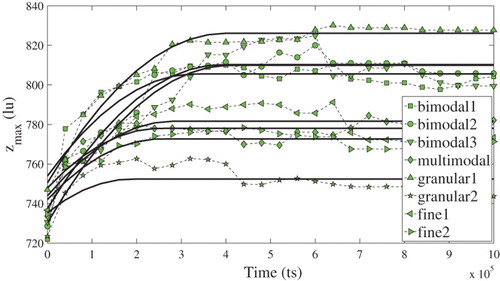
Simulations in the presence of surface growth are performed for packing structures composed of rhombs (see Tables and ). A typical configuration is shown in Figure d, where in particular infiltration stops because of pore closure. Figure shows examples of infiltration kinetics. At the interface between the solid and the wetting fluid, the front retreats as the surface grows. This effect is more important when agglomerates of particles merge. In the analysis of the data, an average is thus considered over the highest values for the position of the front. Fits to Equation (Equation2(2) ) obtain the initial effective radius
. The effective radius used to determine the characteristic numbers is set to the average value
. The question arises as to whether infiltrations stop because of pore closure or pinning. Examination of the fastest dynamics indicates that pore closure is the cause as often as the barrier introduced by pinning is the cause. This implies that surface growth enhances the phenomenon of pinning. Indeed, it is found that in the period considered for the fits, the infiltrations without surface reaction are on average
faster. The resistance of surface growth is more marked for the fastest dynamics, i.e., with higher orientation disorder. At the point where infiltration stops according to the theoretical model of Equation (Equation2
(2) ), the results with surface growth are comparable to those with inert boundaries. But it is to be noted that
turns out to be underestimated in particular for the longer infiltrations where the front can overcome pinning barriers. More details for the results are summarized in Table . It can be seen that orientation disorder is associated with faster infiltrations. Bimodal size distributions lead to better results for aligned and misaligned particles. This is no more true with the addition of tilt. In any case, it can be expected that, in 3D porous structures, bimodal size distributions still present more advantages. In Table , the infiltration velocities are higher than in Table . With surface reaction, the dynamics is shorter and the initial fast infiltration has more weight. It should be kept in mind that at this point the dominant effect is the infiltration interruption directly caused or induced by surface growth. With surface growth allowed, Ca,
and Re increase appreciably (see Table ). Furthermore, their fluctuations are by a factor of two smaller than for inert boundaries.
gains on average one order of magnitude, but the effects of capillary and viscous forces remain more significant. This arises also from the characteristic numbers involving the properties of surface reaction
,
and
. These quantities better describe the systems because infiltration stops under the action of surface growth.
is more accurate because the effects of capillary forces are second in importance even though their relevance weakens with respect to viscosity and inertia in the presence of surface growth. Only the fluctuations of
in a few cases can deviate from the average value by more than one order of magnitude.
Figure 6. Average maximum of the invading front as time passes for infiltrations with surface reaction.
Note: The porous structures are obtained from the packing of rhombs with aligned particles (see Table ). Points represent simulation results. The solid lines are fits to the data by means of Equation (Equation2(2) ).
5.2. Comparison with experiments
The desire now is to carry out simulations for typical experimental results with pure Si (Eustathopoulos, Citation2015; Israel et al., Citation2010). The initial porosity of the preform can be assumed to be 0.3, with an initial average pore diameter of m. The pore size distribution is assumed to be quite narrow, with pore diameters mainly in the range of 7–
m. The preform is composed of graphite particles with an average size of 70 µm. The reaction-rate constant is
m/s (Messner and Chiang, Citation1990). The other parameters of Si are
kg/m3 for the density,
for the viscosity and
N/m for the surface tension (Einset, Citation1996). For the infiltration velocity,
m/s is used (Eustathopoulos, Citation2015). Thus, the holding time for the experiment can be estimated to be
s. From the average pore radius it follows that at this time, indicated by
, pore closure occurs and infiltration stops. The resultant maximal infiltration depth is
mm. The effective radius is estimated using a Dullien model as in Einset (Citation1996). By taking into account the thickening of the surface of 2.5 µm, leading to an average pore diameter of d/2, it is found that an estimate for the effective radius is
m. Indicatively, in the industrial practice targeted by this study (e.g., manufacturing of burners and radiation plates), the C preforms are obtained starting from powders with bimodal size distributions. The size of the largest particles can vary in the range of 30–70 µm. The size of the smallest particles can be assumed to be 5 µm. For example, typical experimental work would proceed as described in the articles by Israel et al. (Citation2010) and Voytovych et al. (Citation2008).
Given the above experimental conditions, the systems lu long and
lu wide are considered for the simulations. Since the width is twice as long as before, roughly speaking the infiltration velocity may double, as suggested by Equations (Equation2
(2) ) and (Equation3
(3) ). The length of the samples is again
, placed in the simulation domain as described in section 4. The total number of time steps is now set to
ts. The surface grows after every
time steps. In simulations, the reaction-rate constant is thus given by
lu/ts. All the other parameters for the LBM simulations remain unchanged. The porous structures are obtained from the packing of rhombs with an average side and height of 36 lu and 31 lu, respectively. Both misalignment and tilt are allowed. The resolution of the systems does not allow the inclusion of small particles, as in industrial applications. The porosity of the resulting system is 0.64. In this case, the sides of the unit cube defining the porous structure are subdivided into 512 bins. Simulations are performed for 30 sections in 2D. The correspondence with experimental results is established by imposing the experimental values for
and
.
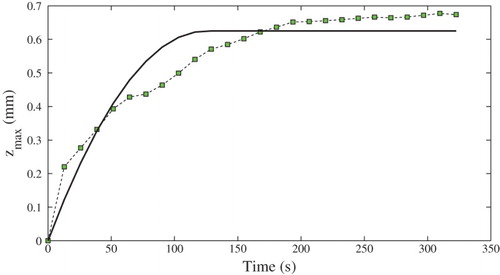
Figure shows the kinetics of infiltration as obtained from simulations. As done before, an average is taken over the highest values for the positions of the fronts. It can be seen that the model predicts a more abrupt behavior for the interruption of penetration, as is also observed in the experiments (Israel et al., Citation2010). It turns out that after an initial fast dynamics, the infiltration velocity decreases and in the last stage the maximal depth is attained slowly. For the sake of clarity, suitable averages in the neighborhood of the point where pore closure occurs and in the ensuing interval of time where a plateau is expected to form are considered. It is found that for of the systems the infiltrated distance increases more than
after the time
where pore closure is predicted by the model for the data of Figure . On average, the further advancement amounts to
. For the remaining
of the systems after the time
the fronts travel on average an additional distance corresponding to
. It is verified that in this case the flow interruption can be ascribed to pinning. As a result, the value of
determined by the model is practically associated with the first pinning barrier. When the plateau starts forming the effect of surface growth seems to remain mainly indirect. Note that the simulations reveal the tendency that the interruption of invasion is affected by the combination of the effects of surface growth, tortuosity and interface dynamics. In principle, it is reasonable to presume that the infiltration may stop before the time required for the obstruction of the average radius, since the process of infiltration is described by an effective radius. However, it was found that in the simulations the effect of pinning is more critical than expected in the experiments. In order to elucidate the role of the effective radius, more experiments are needed for given well-known reaction-rate constants (Israel et al., Citation2010).
Figure 7. LBM simulations of the experimental results with surface growth.
Note: The average maximum for the infiltrated length is given as a function of time. Points represent simulation results. The solid line is a fit to the data by means of Equation (Equation2(2) ).
In Table the characteristic numbers of the simulations and the experiments are compared with the aim of assessing the quality of the equivalence between experimental and simulation conditions. It appears that the effects of the capillary forces are too weak with respect to the effects of surface growth and viscous forces. For the capillary number it is well known that high values satisfy . For this reason, it could be questioned if the difference for the orders of magnitude of
is of particular relevance. For sure, the present approach allows an equivalence for the dynamics of the average penetration depth to be established. However, the details of the invasion process cannot be taken for granted. For example, for estimates based on the average radius of the porous structure, in experiments, when the infiltration stops because of pore closure, the ratio of the infiltrated distance to the thickness of the reaction-formed SiC is 125. In the simulations, 75 is obtained. As discussed above, the relation between the average and effective radii deserves attention, but a major obstacle to achieving better results is the phenomenon of pinning. These simulations also prove that a higher resolution is not sufficient to reduce pinning. Again, it is observed that the structure is more important than the average radius, of course increasing with a higher resolution. Under the conditions of these simulations, the average size of the particles is 150 µm while the target is 70 µm for an equivalence with a stronger direct correspondence for the porous structure. It is not easy to improve the comparison because with packings composed of smaller particles, pinning would become even more important. Furthermore, if the data associated with the first point in Figure exceeding the average of
over the last 10 frames taken into account is used for the fit, the improvement is relative because the velocity decreases but the initial effective radius
increases. The result is that
and Ca remain of the same order. Thus, reducing the velocity, keeping
small and weakening the phenomenon of pinning at the same time in the simulations is not a straightforward matter.
Table 8. Characteristic dimensionless numbers for infiltrations in the presence of surface growth.
6. Conclusions
In this work, LBM simulations are proposed for the study of capillary infiltration into porous structures. Optimization principles for the manufacturing of ceramic materials through reactive melt infiltration are the primary focus. With this aim in mind, porous systems realized through the packing of particles with varying properties (shape, size distribution, orientation disorder) are first considered. The results show that without surface growth the invading front tends to select preferential pathways, which can result in the formation of fingers. The data also indicate that bimodal size distributions display better infiltrations than monomodal distributions. The improvement is found to be on average (see Tables and ). Pinning of the contact line appears to be the primary factor affecting liquid penetration. Structural disorder can reduce its effect. Interestingly, bimodal size distributions present advantages in order to limit pinning. Larger faceted particles introduce walls, giving rise to channels. As a result, the meniscus travels longer distances before the loss of its curvature. The probability of encountering the surface of other particles is even greater with the addition of smaller particles. The results for packings with fibers support this view. It is also verified that inertia effects induced by transient accelerations remain of secondary importance. Surface growth results in a clear interruption of the flow. This can occur because pinning turns out to be enhanced or because of the pore-closing phenomenon. The retardation effects are more marked for a fast dynamics with a higher degree of orientation disorder. Again, the results suggest that bimodal size distributions appear to be able to accommodate optimal infiltration. Simulations with a higher resolution were also performed for comparison with experimental data. The relative strength of capillary forces turned out not to be strong enough. As a result, the infiltration dynamics is not reproduced in full detail. Furthermore, the effects of surface growth for the interruption of infiltration are basically indirect in this case. Two aspects that are significant for further advances have been identified. First, the relation for the interruption of infiltration with the physical (e.g., average and minimum) and effective radii needs to be elucidated. Second, longer infiltrated lengths should be realized in simulations. A major obstacle to improvements resides in the over-occurrence of pinning. This situation could be improved by considering other combinations of surface tension, viscosity and, especially, contact angle (Chibbaro, Costa, et al., Citation2009). This could also be an extension of this work to Si alloys. Finally, this study has developed simulations relevant for increasing the quality of ceramics obtained from LSI. Despite poor statistics and noisy results, operational guidelines are highlighted. Further research is necessary in order to refine the conditions that provide the optimal configuration for the porosity. Experiments would also allow an increased understanding of the robustness of these findings based on simplified systems.
Disclosure statement
No potential conflict of interest was reported by the authors.
Additional information
Funding
References
- Aghajanian M., Emmons C., Rummel S., Barber P., Robb C., & Hibbard D. (2013). Effect of grain size on microstructure, properties and surface roughness of reaction bonded SiC ceramics. In J. L. Robichaud, M. Krödel, & W. A. Goodman (Eds.), Material technologies and applications to optics, structures, components and sub-systems (Vol. 8837-19). Bellingham, WA: SPIE Press. doi:10.1117/12.2024308
- Alava M., Dube M., & Rost M. (2004). Imbibition in disordered media. Advances in Physics, 53, 83–175. doi:10.1080/00018730410001687363
- Alawadhi E. M. (2010). Finite element simulations using ANSYS. Boca Raton, FL: Taylor & Francis.
- Asthana R., Singh M., & Sobczak N. (2005). Infiltration processing of ceramic-metal composites: The role of wettability, reaction, and capillary flow. Journal of the Korean Ceramic Society, 42, 703–717. doi: 10.4191/KCERS.2005.42.11.703
- Bao N., Zhou Y., Jiao K., Yin Y., Du Q., & Chen J. (2014). Effect of gas diffusion layer deformation on liquid water transport in proton exchange membrane fuel cell. Engineering Applications of Computational Fluid Mechanics, 8, 26–43. doi:10.1080/19942060.2014.11015495
- Bear J. (1972). Dynamics of fluids in porous media. New York, NY: Elsevier.
- Benzi R., Succi S., & Vergassola M. (1992). The lattice Boltzmann equation: Theory and applications. Physics Reports, 222, 145–197. doi:10.1016/0370-1573(92)90090-M
- Bhatnagar P. L., Gross E. P., & Krook M. (1954). A model for collision processes in gases. I. Small amplitude processes in charged and neutral one-component systems. Physical Review, 94, 511–525. doi:10.1103/PhysRev.94.511
- Blow M. L., Kusumaatmaja H., & Yeomans J. M. (2009). Imbibition through an array of triangular posts. Journal of Physics: Condensed Matter, 21:464125. doi:10.1088/0953-8984/21/46/464125
- Bohn R. B., & Garboczi E. J. (2003). User manual for finite element and finite difference programs: A parallel version of NISTIR-6269 (NIST Internal Report No. 6997). Gaithersburg, MD: Building and Fire Research Laboratory, National Institute of Standards and Technology.
- Bougiouri V., Voytovych R., Rojo-Calderon N., Narciso J., & Eustathopoulos N. (2006). The role of the chemical reaction in the infiltration of porous carbon by NiSi alloys. Scripta Materialia, 54, 1875–1878. doi:10.1016/j.scriptamat.2006.02.015
- Chen S., & Doolen G. D. (1998). Lattice Boltzmann method for fluid flows. Annual Review of Fluid Mechanics, 30, 329–364. doi:10.1146/annurev.fluid.30.1.329
- Chibbaro S. (2008). Capillary filling with pseudo-potential binary Lattice-Boltzmann model. The European Physical Journal E, 27, 99–106. doi:10.1140/epje/i2008-10369-4
- Chibbaro S., Biferale L., Binder K., Dimitrov D., Diotallevi F., Milchev A., & Succi S. (2009). Hydrokinetic simulations of nanoscopic precursor films in rough channels. Journal of Statistical Mechanics: Theory and Experiments, 2009, PO6007. doi:10.1088/1742-5468/2009/06/P06007
- Chibbaro S., Biferale L., Diotallevi F., & Succi S. (2009). Capillary filling for multicomponent fluid using the pseudo-potential Lattice Boltzmann method. The European Physical Journal Special Topics, 171, 223–228. doi:10.1140/epjst/e2009-01032-8
- Chibbaro S., Costa E., Dimitrov D. I., Diotallevi F., Milchev A., Palmieri D., … Succi S. (2009). Capillary filling in microchannels with wall corrugations: A comparative study of the Concus-Finn criterion by continuum, kinetic, and atomistic approaches. Langmuir, 25, 12653–12660. doi:10.1021/la901993r
- de Gennes P. G., Brochard-Wyart F., & Quéré D. (2004). Capillarity and wetting phenomena: Drops, bubbles, pearls, waves. New York, NY: Springer.
- Dezellus O., & Eustathopoulos N. (2010). Fundamental issues of reactive wetting by liquid metals. Journal of Materials Science, 45, 4256–4264. doi:10.1007/s10853-009-4128-x
- Dezellus O., Hodaj F., & Eustathopoulos N. (2003). Progress in modelling of chemical-reaction limited wetting. Journal of the European Ceramic Society, 23, 2797–2803. doi:10.1016/S0955-2219(03)00291-7
- Diotallevi F., Biferale L., Chibbaro S., Lamura A., Pontrelli G., Sbragaglia M., … Toschi T. (2009). Capillary filling using lattice Boltzmann equations: The case of multi-phase flows. The European Physical Journal Special Topics, 166, 111–116. doi:10.1140/epjst/e2009-00889-7
- Diotallevi F., Biferale L., Chibbaro S., Pontrelli G., Toschi F., & Succi S. (2009). Lattice Boltzmann simulations of capillary filling: Finite vapour density effects. The European Physical Journal Special Topics, 171, 237–243. doi:10.1140/epjst/e2009-01034-6
- Donev A., Cisse I., Sachs D., Variano E. A., Stillinger F. H., Connelly R., … Chaikin P. M. (2004). Improving the density of jammed disordered packings using ellipsoids. Science, 303, 990–993. doi:10.1126/science.1093010
- Duda A., Koza Z., & Matyka M. (2011). Hydraulic tortuosity in arbitrary porous media flow. Physical Review E, 84, 036319. doi:10.1103/PhysRevE.84.036319
- Dullien F. A. L. (1992). Porous media: Fluid transport and pore structure. San Diego, CA: Academic Press.
- Einset E. O. (1996). Capillary infiltration rates into porous media with applications to silcomp processing. Journal of the American Ceramic Society, 79, 333–338. doi:10.1111/j.1151-2916.1996.tb08125.x
- Einset E. O. (1998). Analysis of reactive melt infiltration in the processing of ceramics and ceramic composites. Chemical Engineering Science, 53, 1027–1039. doi:10.1016/S0009-2509(97)00379-5
- Eustathopoulos N. (2015). Wetting by liquid metals—application in materials processing: The contribution of the Grenoble group. Metals, 5, 350–370. doi:10.3390/met5010350
- Eustathopoulos N., Nicholas M. G., & Drevet B. (1999). Wettability at high temperatures. Oxford: Pergamon.
- Fan S., Zhang L., Xu Y., Cheng L., Tian G., Ke S., … Liu H. (2008). Microstructure and tribological properties of advanced carbon/silicon carbide aircraft brake materials. Composites Science and Technology, 68, 3002–3009. doi:10.1016/j.compscitech.2008.06.013
- Furler P., Scheffe J., Gorbar M., Moes L., Vogt U., & Steinfeld A. (2012). Solar thermochemical CO2 splitting utilizing a reticulated porous ceria redox system. Energy and Fuels, 26, 7051–7059. doi:10.1021/ef3013757
- Gadow R. (2000). Current status and future prospects of CMC brake components and their manufacturing technologies. In T. Jessen & E. Ustundag (Eds.), Proceedings of the 24th Annual Conference on Composites, Advanced Ceramics, Materials, and Structures A (Vol. 21, pp. 15–29). Hoboken, NJ: Wiley & Sons. doi:10.1002/9780470294628.ch2
- Gadow R., & Speicher M. (2000). Optimized morphological design for silicon infiltrated microporous carbon preforms. In T. Jessen & E. Ustundag (Eds.), Proceedings of the 24th Annual Conference on Composites, Advanced Ceramics, Materials, and Structures A (Vol. 21, pp. 485–492). Hoboken, NJ: Wiley & Sons. doi:10.1002/9780470294628.ch57
- Gern F. H., & Kochendörfer R. (1997). Liquid silicon infiltration: Description of infiltration dynamics and silicon carbide formation. Composites Part A: Applied Science and Manufacturing, 28, 355–364. doi:10.1016/S1359-835X(96)00135-2
- Ghosh S., Patil P., Mishra S. C., Das A. K., & Das P. K. (2012). 3-D lattice Boltzmann model for asymmetric Taylor bubble and Taylor drop in inclined channel. Engineering Applications of Computational Fluid Mechanics, 6, 383–394. doi:10.1080/19942060.2012.11015429
- Goodall R., & Mortensen A. (2014). Porous metals. In D. E. Laughlin & K. Huno (Eds.), Physical metallurgy (pp. 2399–2595). Waltham, MA: Elsevier. doi:10.1016/B978-0-444-53770-6.00024-1
- Gross M., Varnik F., Raabe D., & Steinbach I. (2010). Small droplets on superhydrophobic substrates. Physical Review E, 81, 051606. doi:10.1103/PhysRevE.81.051606
- Haghani R., Rahimian M. H., & Taghilou M. (2013). LBM simulation of a droplet dripping down a hole. Engineering Applications of Computational Fluid Mechanics, 7, 461–470. doi:10.1080/19942060.2013.11015485
- He X., & Luo L.-S. (1997). Lattice Boltzmann model for the incompressible Navier–Stokes equation. Journal of Statistical Physics, 88, 927–944. doi:10.1023/B:JOSS.0000015179.12689.e4
- Hillig W. B., Mehan R. L., Morelock C. R., DeCarlo V. J., & Laskow W. (1975). Silicon/silicon carbide composites. American Ceramic Society Bulletin, 54, 1054–1056.
- Israel R., Voytovych R., Protsenko P., Drevet B., Camel D., & Eustathopoulos N. (2010). Capillary interactions between molten silicon and porous graphite. Journal of Materials Science, 45, 2210–2217. doi:10.1007/s10853-009-3889-6
- Joshi A. S., & Sun Y. (2010). Wetting dynamics and particle deposition for an evaporating colloidal drop: A lattice Boltzmann study. Physical Review E, 82, 041401. doi:10.1103/PhysRevE.82.041401
- Komnik A., Harting J., & Herrmann H. J. (2004). Transport phenomena and structuring in shear flow of suspensions near solid walls. Journal of Statistical Mechanics: Theory and Experiment, 2004, P12003. doi:10.1088/1742-5468/2004/12/P12003
- Koponen A., Kandhai D., Hellén E., Alava M., Hoekstra A., Kataja M., … Timonen J. (1998). Permeability of three-dimensional random fiber webs. Physical Review Letters, 80, 716–719. doi:10.1103/PhysRevLett.80.716
- Krenkel W., & Berndt F. (2005). C/C-SiC composites for space applications and advanced friction systems. Materials Science and Engineering A, 412, 177–181. doi.org/10.1016/j.msea.2005.08.204 doi: 10.1016/j.msea.2005.08.204
- Kusumaatmaja H., Pooley C. M., Girardo S., Pisignano D., & Yeomans J. M. (2008). Capillary filling in patterned channels. Physical Review E, 77, 067301. doi:10.1103/PhysRevE.77.067301
- Landau L. D., & Lifshitz E. M. (2008). Fluid mechanics. Burlington, MA: Elsevier.
- Liu G. W., Muolo M. L., Valenza F., & Passerone A. (2010). Survey on wetting of SiC by molten metals. Ceramics International, 36, 1177–1188. doi:10.1016/j.ceramint.2010.01.001
- Liu H., Valocchi A. J., & Kang Q. (2012). Three-dimensional lattice Boltzmann model for immiscible two-phase flow simulations. Physical Review E, 85, 046309. doi:10.1103/PhysRevE.85.046309
- Martins G. P., Olson D. L., & Edwards G. R. (1988). Modeling of infiltration kinetics for liquid metal processing of composites. Metallurgical and Materials Transactions B, 19, 95–101. doi:10.1007/BF02666495
- Martys N. W., & Chen H. D. (1996). Simulation of multicomponent fluids in complex three-dimensional geometries by the lattice Boltzmann method. Physical Review E, 53, 743–750. doi:10.1103/PhysRevE.53.743
- Matyka M., & Koza Z. (2012). How to calculate tortuosity easily? In K. Vafai (Ed.), Porous media and its applications in science, engineering, and industry (pp. 17–22). Melville, NY: American Institute of Physics. doi:10.1063/1.4711147
- Messner R. P., & Chiang Y.-M. (1990). Liquid-phase reaction-bonding of silicon carbide using alloyed silicon-molybdenum melts. Journal of the American Ceramic Society, 73, 1193–1200. doi:10.1111/j.1151-2916.1990.tb05179.x
- Mognetti B. M., & Yeomans J. M. (2009). Capillary filling in microchannels patterned by posts. Physical Review E, 80, 056309. doi:10.1103/PhysRevE.80.056309
- Mortensen A., Drevet B., & Eustathopoulos N. (1997). Kinetics of diffusion-limited spreading of sessile drops in reactive wetting. Scripta Materialia, 36, 645–651. doi:10.1016/S1359-6462(96)00431-9
- Paik U., Park H.-C., Choi S.-C., Ha C.-G., Kim J.-W., & Jung Y.-G. (2002). Effect of particle dispersion on microstructure and strength of reaction-bonded silicon carbide. Materials Science and Engineering: A, 334, 267–274. doi:10.1016/S0921-5093(01)01897-4
- Patro D., Bhattacharyya S., & Jayram V. (2007). Flow kinetics in porous ceramics: Understanding with non-uniform capillary models. Journal of the American Ceramic Society, 90, 3040–3046. doi:10.1111/j.1551-2916.2007.01776.x
- Roberson C., & Hazell P. J. (2003). Resistance of silicon carbide to penetration by a tungsten carbide cored projectile. In E. Medvedovsk (Ed.), Proceedings of the 105th Annual Meeting of the American Ceramic Society: Ceramic armor and armor systems (pp. 165–174). Hoboken, NJ: Wiley & Sons. doi:10.1002/9781118406793.ch14
- Salamone S., Karandikar P., Marshall A., Marchant D. D., & Sennett M. (2008). Effects of Si:SiC ratio and SiC grain size on properties for RBSC. In E. Lara-Curzio, J. Salem, & D. Zhu (Eds.), Mechanical properties and performance of engineering ceramics and composites III (pp. 101–109). Hoboken, NJ: Wiley & Sons. doi:10.1002/9780470339497.ch10
- Sangsuwan P., Orejas J. A., Gatica J. E., Tewari S. N., & Singh M. (2001). Reaction-bonded silicon carbide by reactive infiltration. Industrial & Engineering Chemistry Research, 40, 5191–5198. doi:10.1021/ie001029e
- Scocchi G., Ortona A., Grossi L., Bianchi G., D'Angelo C., Leidi T., & Gilardi R. (2013). Evaluation of a simple finite element method for the calculation of effective electrical conductivity of compression moulded polymer-graphite composites. Composites Part A: Applied Science and Manufacturing, 48, 15–25. doi:10.1016/j.compositesa.2012.12.013
- Sergi D., Camarano A., Molina J. M., Ortona A., & Narciso J. (2016). Surface growth for molten silicon infiltration into carbon millimeter-sized channels: Lattice-Boltzmann simulations, experiments and models. International Journal of Modern Physics C, 27, 1–24. doi:10.1142/S0129183116500625
- Sergi D., D'Angelo C., Scocchi G., & Ortona A. (2012). Random packing of small blocks: Pressure effects, orientational correlations and application to polymer-based composites. Particle & Particle Systems Characterization, 29, 24–34. doi:10.1002/ppsc.201200001
- Sergi D., Grossi L., Leidi T., & Ortona A. (2014). Surface growth effects on reactive capillary-driven flow: Lattice Boltzmann investigation. Engineering Applications of Computational Fluid Mechanics, 8, 549–561. doi:10.1080/19942060.2014.11083306
- Sergi D., Grossi L., Leidi T., & Ortona A. (2015). Lattice Boltzmann simulations on the role of channel structure for reactive capillary infiltration. Engineering Applications of Computational Fluid Mechanics, 9, 301–323. doi:10.1080/19942060.2015.1026432
- Sherwood J. D. (1997). Packing of spheroids in three-dimensional space by random sequential addition. Journal of Physics A: Mathematical and General, 30, L839–L843. doi:10.1088/0305-4470/30/24/004
- Succi S. (2009). The lattice Boltzmann equation for fluid dynamics and beyond. Oxford: Oxford University Press.
- Sukop M. C., & Thorne D. T., Jr. (2010). Lattice Boltzmann modeling: An introduction for geoscientists and engineers. Berlin: Springer.
- Torquato S. (2002). Random heterogeneous materials: Microstructures and macroscopic properties. New York, NY: Springer.
- Voytovych R., Bougiouri V., Calderon N. R., Narciso J., & Eustathopoulos N. (2008). Reactive infiltration of porous graphite by NiSi alloys. Acta Materialia, 56, 2237–2246. doi:10.1016/j.actamat.2008.01.011
- Wagner A. J. (2003). The origin of spurious velocities in lattice Boltzmann. International Journal of Modern Physics B, 17, 193–196. doi:10.1142/S0217979203017448
- Wang M., & Pan N. (2008). Modeling and prediction of the effective thermal conductivity of random open-cell porous foams. International Journal of Heat and Mass Transfer, 51, 1325–1331. doi:10.1016/j.ijheatmasstransfer.2007.11.031
- Washburn E. W. (1921). The dynamics of capillary rise. Physical Review, 27, 273–283. doi:10.1103/PhysRev.17.273
- Widom B. (1966). Random sequential addition of hard spheres to a volume. The Journal of Chemical Physics, 44, 3888–3894. doi:10.1063/1.1726548
- Wiklund H., & Uesaka T. (2012). Edge-wicking: Micro-fluidics of two-dimensional liquid penetration into porous structures. Nordic Pulp and Paper Research Journal, 27, 403–408. doi:10.3183/NPPRJ-2012-27-02-p403-408
- Wiklund H., & Uesaka T. (2013). Microfluidics of imbibition in random porous media. Physical Review E, 87, 023006. doi:10.1103/PhysRevE.87.023006
- Wolf-Gladrow D. A. (2005). Lattice-gas cellular automata and lattice Boltzmann models: An introduction. Berlin: Springer.
- Yang J., & Ilegbusi O. J. (2000). Kinetics of silicon-metal alloy infiltration into porous carbon. Composites Part A: Applied Science and Manufacturing, 31, 617–625. doi:10.1016/S1359-835X(99)00089-5