
 ?Mathematical formulae have been encoded as MathML and are displayed in this HTML version using MathJax in order to improve their display. Uncheck the box to turn MathJax off. This feature requires Javascript. Click on a formula to zoom.
Abstract
Accurate predictions of decaying swirling flow behavior in the multi-lobed swirl generator (MLSG) are essential for certain engineering applications. In this study, decaying swirling flow characteristics in an MLSG are examined using the Computational Fluid Dynamics (CFD) technique with a Reynolds stress turbulence model (RSM). The effects of different lobe numbers (n) and pitch length ratios (P/D) on swirl intensity, pressure drop, friction factor coefficient, and decay rate are observed with Reynolds number from 50,000 to 125,000. Combined with the pressure loss, the efficiency of swirl induction is evaluated by introducing a swirl effectiveness (SE) evaluation criterion. The initial swirl intensity is shown to first increases and then decreases as lobe number increases. The maximum value is obtained at lobe number n = 4. The pitch length ratios P/D corresponding to the optimal SE value obtained from different lobe also differ. The optimal SE value is achieved at n = 4 and P/D = 8. The friction factor ratio fs/fp decreases as pitch length ratio increases, but the decreasing trend decelerates over time. Correlations based on the numerical predictions of friction factor ratio fs/fp and decay rate β are presented accordingly.
Nomenclature
| A | = | area |
| D | = | diameters of tube |
| I | = | turbulence intensity |
| Dh | = | hydraulic diameter |
| k | = | turbulent kinetic energy |
| g | = | gravitational acceleration |
| n | = | lobed number |
| DT,ij | = | viscous diffusion term of Reynolds stress |
| f | = | friction factor |
| P | = | pitch of twisted tube |
| Pij | = | generation rate of Reynolds stress |
| r | = | radius of arc part of tube |
| R | = | radius of tube |
| Re | = | Reynolds number |
| S | = | cross section area |
| SE | = | Swirl effectiveness |
| t | = | time |
| U | = | mean axial velocity |
| ui | = | velocity vector component |
| ui | = | velocity component |
| uθ | = | tangential velocity |
| xi | = | spatial direction |
| y+ | = | non-dimensional wall distance |
| z | = | coordinate oriented along the flow |
| Δp | = | pressre drop |
Greek
| β | = | swirl decay rate |
| ϵ | = | dissipation of turbulent kinetic energy |
| μ | = | dynamics viscosity |
| ρ | = | density |
| τij | = | stress tensor |
| φij | = | pressure-strain term of Reynolds stress |
| Ω | = | swirl number |
| Ω0 | = | initial swirl intensity at generator outlet |
Subcripts
| polygon | = | inscribed polygon |
| lobe | = | lobed part |
| p | = | plain tube |
| CS | = | inscribed circle |
| s | = | swirl generator |
1. Introduction
The world’s primary energy consumption, and its accompanying greenhouse gas emissions, are expected to increase annually as the global economy continues to advance (Dudley, Citation2019). In recent years, innovative devices have emerged to optimize local facilities to induce swirl flow locally. These devices facilitate heat transfer enhancement, food and beverage industries, pneumatic/hydraulic conveying, and a broad spectrum of other engineering applications (Fokeer et al., Citation2009; Jafari et al., Citation2017; Tang et al., Citation2015; Zhou et al., Citation2016). They can improve energy efficiency and reduce additional energy consumption, effectively promoting energy conservation and emissions reduction. Due to the complex wall effects affecting the local swirl flow process, it is difficult to predict the swirl intensity decays as it moves downstream. A detailed understanding of decaying swirling flow characteristics is essential for guiding the optimization of these devices.
Swirl flow is a complex flow phenomenon with an obvious tangential velocity component, which can cause an intense secondary flow that increases the swirl intensity of the near-wall fluid, the mixing of fluids, and disturbance to the boundary layer (Martemianov & Okulov, Citation2004; Omidi et al., Citation2018). The structure of a swirling flow depends on the methods and devices utilized to produce it. Coiled wires, twisted tapes, axial blades, internal spirals, tangential inlets, and radial blade cascades are the most popular types of swirl generators (Aydin et al., Citation2014; Taheran & Javaherdeh, Citation2019; Zhou et al., Citation2016). Among them, the multi-lobed swirl generator (MLSG) as a method for internal spiral induction is widely used due to its advantages of low cost, simple structure, and ready integration.
Many experimental investigations have been conducted to study the swirling phenomenon induced by the MLSG. Jafari et al. (Citation2017) experimentally investigated the heat transfer performance of a tube with a three-lobed cross-section. They concluded that the Nusselt number increases significantly (1.34–1.74 times) as the friction factor increases within an acceptable range (1.19–1.45 times). A vigorous swirl intensity was found to be the primary cause of improvement in thermal performance. In a further study, they experimentally examined the heat transfer characteristics of four-lobed and five-lobed swirl generators with swirl flow characteristics (Jafari et al., Citation2017a, Citation2017b). They found that the Nusselt number and friction factor of the four-lobed swirl generator increase by 87% and 48%, respectively, while those of the five-lobed swirl generator increase by 85% and 52%, respectively. Li (Citation2016) experimentally studied the Clean-In-Place (CIP) efficiency of a four-lobed swirl generator to find stronger CIP in the downstream at a distance of at least 4.6 meters in a closed processing system. Tonkin (Citation2005) investigated the effect of a four-lobed tube on the transportation of coal-water, sand-water, and magnetite-water slurries experimentally. The swirling flow was found to strongly promote denser slurries at higher concentrations and markedly improve the downstream particle distribution. Fokeer et al. (Citation2009) experimentally investigated the impact of a three-lobed tube on a pneumatic conveying process using the laser doppler anemometry (LDA) method. They concluded that the three-lobed tube creates a wall jet type of swirling flow, and a decay rate inversely proportional to the Reynolds number. Owing to the friction, the swirling flow downstream continues to decay until it becomes an axial flow. Practices across various engineering fields have shown that the application of an MLSG can effectively alleviate certain problems.
An accurate understanding of the swirling flow induction mechanism and decay characteristics of the MLSG helps in effectively optimizing the device. However, experiments provide only a limited understanding of the complex decaying swirling flow. Additional CFD analyses can significantly enrich this understanding while reducing the time and cost of experimental research (Akbarian et al., Citation2018; Gabl & Righetti, Citation2018; Ghalandari et al., Citation2019; Salih et al., Citation2019). Li et al. (Citation2015) constructed a numerical model of a four-lobed swirl tube and found that it can generate tangential wall shear stress downstream to improve the CIP efficiency. Swirl intensity also showed a significant impact on the tangential wall shear stress. They also explored the mean and fluctuation rate of the downstream wall shear stress based on the large eddy simulation (LES) to find that the four-lobed swirl generator substantially improves the CIP efficiency without raising the overall operating velocity (Li et al., Citation2017). Fokeer et al. (Citation2010) explored flows within and downstream of a three-lobed tube via CFD method to find that the swirl intensity decays exponentially as it moves downstream. Zhou et al. (Citation2016) studied the pneumatic conveying efficiency of a three-lobed swirl generator using the CFD-DEM method. Their results showed that application in the preliminary conveying stage has a positive effect.
As mentioned above, although strong swirl intensity is beneficial for many engineering fields, it also inevitably leads to a pressure loss penalty. The swirl intensity should be increased only to the extent that the pressure drop change of the equipment or technology is acceptable; this is related to the pumping power and the associated operation costs. Previous studies have focused on the characteristics of decaying swirling flows induced by MLSG devices with certain numbers of lobes while generally neglecting the effects of pressure loss on swirl effectiveness. The comprehensive effects of geometric parameters such as the lobe number and the pitch length ratio on the flow characteristics of MLSG are not yet well understood.
The aim of the present study is to investigate the decaying swirling flow characteristics of the MLSG using the CFD modeling approach. A Reynolds stress turbulence model (RSM) is used to investigate the effects of the lobe number (n) and pitch length ratio (P/D) on decaying swirling flow characteristics numerically, with Reynolds numbers ranging from 50,000 to 125,000. The decay phenomenon as the flow moves downstream is investigated in detail and the effectiveness of the induced swirl flow is evaluated. Empirical correlations of the friction factor ratio and decay rate are established to support the observations.
2. Methodology
2.1. Physical model
The geometry of a tube with an MLSG (Figure (a)) as investigated in this study is the same as that used in a previous study by Li (Citation2016) except for its rotation direction. The cross-section of the lobed tube (n = 4) is shown in Figure (b). Here, n is the lobe number of the cross-section and the diameter of the tube is D = 0.05 m. The cross-section of the MLSG consists of an inner polygon and several identical outer semicircles. The cross-sectional area is consistent with that of a circular tube; the multi-lobed tube and circular tube are connected in a transitional manner. In the single-phase case, the entrance section length of turbulent flow is calculated as:
(1)
(1)
By calculation, the entrance section length is less than 1.55 m. The upstream part of the MLSG extends long enough to ensure that the flow in the tube is fully developed. The effect of different pitch length ratios (P/D) on the flow is also considered here; the pitch length P is the length of the multi-lobed tube that undergoes a 360° rotation. The simulations were conducted with different lobe numbers of n = 3, 4, 5, 6, 8, 9, and 10, and pitch length ratios of P/D = 4, 6, 8, 10, and 12. The geometric parameters of different lobe numbers can be calculated as follows:
(2)
(2)
(3)
(3)
(4)
(4)
(5)
(5) where, rlobe is the radius of the semicircle of the lobed tubes; RCS is the radius of the polygon circumscribed circle. The calculated rlobe and RCS values for different lobe numbers are given in Table .
Figure 1. Detailed view of MLSG. (a) geometric model; (b) cross section of multi-lobed tube.
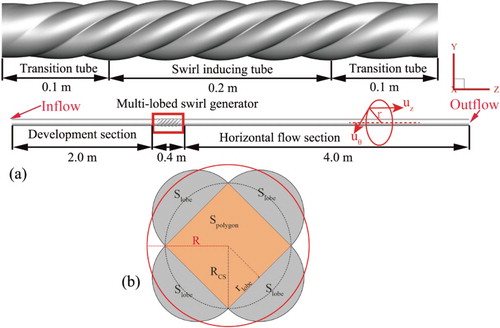
Table 1. Parameters for the value of rlobe and RCS.
2.2. Governing equations
The RSM is a more refined Reynolds-averaged Navier-Stokes (RANS) turbulence model than the usual two-equation model. The RSM abandons the isotropic eddy-viscosity hypothesis and closes the RANS equations by solving Reynolds stresses transport equation and dissipation rate equation.
As the RSM rigorously explains the influence of streamline curvature, swirl, rotation, and rapid changes in strain rate, it shows better potential for the accurate prediction of complex flows (Escue & Cui, Citation2010). For an incompressible fluid flow, the continuity equation, momentum equation, and the RSM turbulence model based on the Linear Pressure-Strain (LPS) model (Gibson & Launder, Citation1978; Launder & Shimat, Citation1989) are written as follows.
Continuity equation:
(6)
(6)
Momentum equation:
(7)
(7)
RSM turbulence model:
(8)
(8)
In these equations, ρ is the constant water density; ui is the fluid velocity component along the Cartesian coordinate xi direction; μ is viscosity coefficient; p is fluid pressure; gi is the acceleration of gravity; ϵ is dissipation velocity of the turbulent kinetic energy; Here, is the ith fluctuating velocity component, where <> makes the involved averaging operation explicit. δij is the Kronecker delta (δij = 1 for i = j and δij = 0 for i ≠ j). At the right side of the equation, Dt,ij, Pij, and φij is the diffusion term, production term, and pressure-strain term, respectively. These equations can be found in the literature of Lin et al. (Citation2014) in detail.
To close the Reynolds stress model, the scalar dissipation rate ϵ can be obtained by solving its transport equation:
(9)
(9) where k is turbulent kinetic energy, it is given as
; μt is the turbulent viscosity. Cϵ1, Cϵ2, and σϵ are constants, and Cϵ1 = 1.44, Cϵ2 = 1.92, σϵ = 1.0.
2.3. Parameter definition
The friction factor f can be calculated as:
(10)
(10) where ΔP is the pressure drop; L is the tube length; U is the mean axial velocity. For the tube side flow’s friction correlations, Blasius’s correlation (Citation1913) for fully developed turbulent flow at
is given as follows:
(11)
(11)
Petukhov’s correlation (Citation1970) for fully developed turbulent flow at is:
(12)
(12)
The Reynold number can be calculated by using the following equation:
(13)
(13)
The swirl number Ω represents the ratio between the axial flux of tangential momentum to the axial thrust, which indicates the swirl intensity in the swirling flow field (Beér & Chigier, Citation1972). The swirl number is expressed as:
(14)
(14) where uz and uθ are the axial and tangential velocity in a computational grid cell, respectively; r is the radial position. The tangential velocity uθ is obtained from the tangential velocity vector which calculated from the velocity vector components in the Cartesian coordinate system. The calculation formula is calculated as follows:
(15)
(15) where θ is the angular coordinate,
,
. According to a large number of scholars’ experiments (Osami Kitoh, Citation1991; Reader-Harris, Citation1994; Steenbergen & Voskamp, Citation1998), the swirl number Ω yields an exponential decay formula as follows:
(16)
(16) where Ω0 is initial swirl intensity obtained at the outlet of the swirl generator, β is the decay rate, z is the axial position, and z0 is the axial position of the swirl generator outlet.
2.4. Boundary conditions and simulation strategy
Single-phase liquid was simulated in this work. The density and viscosity of the liquid (water) are 998.2 kg/m3 and 1.003 × 10⁻³ Pa· s, respectively. The boundary conditions at the inlet and outlet are velocity inlet and pressure outlet, respectively. The values of turbulence intensity I and hydraulic diameter Dh were also given. No-slip boundary conditions (i.e. ux, uy, and uz = 0) were adopted at the wall. The turbulence intensity I is calculated as follows (Ansys, Inc, Citation2016):
(17)
(17)
The finite volume method was used to discretize the above governing equations using the Semi-Implicit Method for Pressure-linked Equation (SIMPLE) algorithm for pressure-velocity coupling. The second-order implicit scheme was employed to solve the unsteady formulation. The second-order upwind scheme was used to solve the momentum, turbulence, and Reynolds stresses equations. The solution was considered to converge when the normalized residuals of each scaled residual component are lower than 10−5. The simulations were solved on an Intel Core i7 workstation for a time period of 10 s.
2.5. Grid details and grid independence test
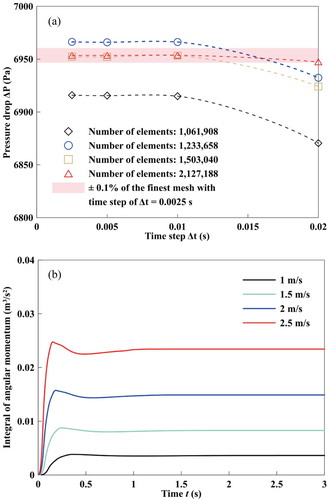
In order to ensure that the numerical model captures the details of decaying swirling flow, and taking into account the calculation cost, a grid independence test was carried out to prevent the grid size and time step from impacting the results. Four meshing schemes with different grid numbers (1.06 × 10⁶, 1.23 × 10⁶, 1.50 × 10⁶, and 2.13 × 10⁶ meshes) were used for grid independence and validation (Figure a). The maximum difference in pressure drop between 2.13 × 10⁶ meshes when the timestep was Δt = 0.0025 s, and 1.50 × 10⁶ meshes when the timestep was Δt = 0.01 s, were less than 0.1%. For the optimal convergence of the numerical calculations, we finally chose a grid with 1.50 × 10⁶ meshes and Δt = 0.005 s, then ran 20 iterations per time step. To verify whether the timestep selection was proper, the contour of the convective Courant number was checked after the calculation is complete. The maximum value was less than 12.1 for all the simulations, meet the recommendation that the Courant number should not exceed a value of 20–40 in most sensitive transient regions of the domain (Ansys, Inc, Citation2011). The number of iterations in two consecutive time steps was less than two when the simulation time was 10 s. This mesh distribution and a timestep of Δt = 0.005 s were utilized for all subsequent analyses. As seen in Figure (b), the integral of angular momentum at the exit section of the MLSG is monitored, and changes at different time intervals are obtained. Based on this information, we believe that the flow field can reach a relatively steady-state within the simulation time.
Figure 2. Grid independence test. (a) grid independence study (b) variations of angular momentum changes at different time intervals.
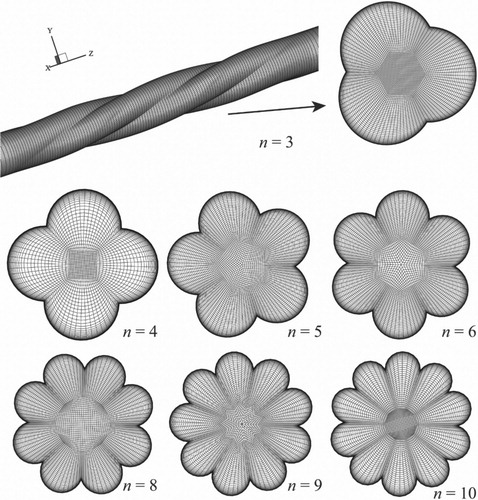
The geometrical model was meshed using a structured hexahedral structure grid. For the near-wall treatment, the enhanced wall function was used to represent the wall boundary conditions. The grid division at the boundary layers satisfied the condition of y+ ≈ 1. The grid division is shown in Figure .
Figure 3. Detail view of computational mesh of the MLSG with different lobe numbers.
3. Validation of numerical results
We compared our numerical results against experimental results available in the open literature (Li, Citation2016) under the same boundary conditions. The friction factor of the fully developed section of the tube was calculated by the empirical formula and compared with the simulation results as well. The results are shown in Figure . The mean relative errors between the experimental results and CFD predictions are less than 3.7%. The mean deviation of numerical f and the empirical correlations of Blasius (Equation (10)) and Petukhov (Equation (11)) are less than 4.4% and 6.4%, respectively. Comparison of pressure drop between experimental results with a 95% confidence interval and CFD results are shown in Table . It is observed that the results of the present simulation are in good agreement with the empirical formula and experimental data.
Figure 4. Comparison of pressure drop and friction factor coefficient between experimental results (Li, Citation2016) and correlations results (Blasius, Citation1913; Petukhov, Citation1970).
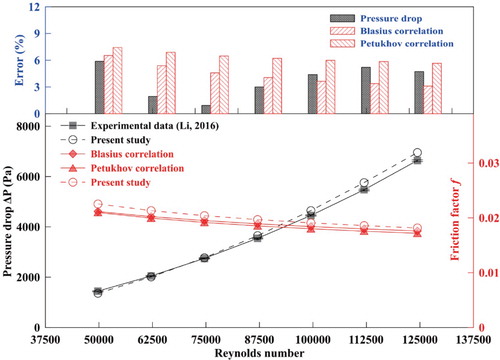
Table 2. Comparison of pressure drop between experimental results with a 95% confidence interval and CFD results.
4. Results and discussion
4.1. Effects of lobe number (n), and pitch length ratio (P/D) on swirling characteristics
Figure shows the changes swirl number under different lobe numbers along the flow direction. The variations in initial swirl intensity and decay rate with different lobe numbers were also observed. The swirl number decayed exponentially, which is similar to results obtained in previous experiments (Osami Kitoh, Citation1991; Reader-Harris, Citation1994; Steenbergen & Voskamp, Citation1998). For n ≥ 4 cases, the initial swirl intensity decreased as lobe number increased, but the extent of this decrease weakened over time; the decrease of Ω0 caused by the increases in n was more obvious with smaller n values. For example, Ω0 values from n = 4 to n = 6 decreased by 14.9% but decreased by only 4.0% from n = 8 to n = 10. The exception at n = 3 can be attributed to a change in the RCS value. RCS was 20.16 when n = 3, which fall between the values of n = 6 and n = 8. The increase in RCS value means that the degree of momentum exchange between the tube core area and the lobed area is reduced. The decay rate here appears to be closely correlated with the initial swirl intensity, which is consistent with a previous observation by Osami Kitoh (Citation1991).
Figure 5. Swirl number variations along tube; initial swirl intensity variations; decay rate versus lobe number. (Re = 50,000, P/D = 8)
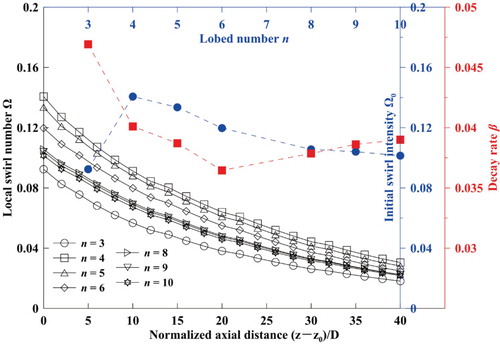
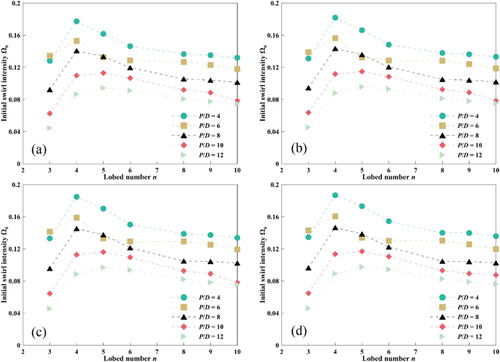
Figure shows the effects of various lobe numbers (n) and pitch length ratios (P/D) in the MLSG on the initial swirl intensity across the range of Reynolds numbers mentioned above. The initial swirl intensity increases slightly with the rise of Reynolds number. The flow rate increased by 150% as the Reynolds number increased from 50,000 to 125,000, but the initial swirl intensity increased by only about 3.4% on average. The initial swirl intensity was more sensitive to the changes in the lobe number (n) and pitch length ratio (P/D). An increase in the pitch length ratio reduced the initial swirl intensity as well as the tangential kinetic energy of the fluid that was forced to deflect. Further, the initial swirl intensity increased at first and then decreased as the lobe number increased. The maximum Ω0 value was obtained at n = 4. It is possible that an increase in lobe number causes the area of the single lobe and inside tube to change, thus changing the momentum exchange capacity between the multi-lobed tube and the inner core. However, when n = 3, the wall of the lobed region was just slightly convex which weakened the swirl flow caused by the curvature wall inside the tube.
Figure 6. Variations in initial swirl intensity with lobe number under different pitch length ratios. (a) Re = 50,000; (b) Re = 75,000; (c) Re = 100,000; (d) Re = 125,000.
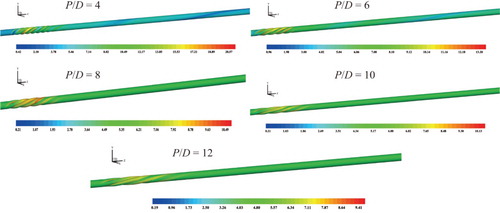
Tangential velocity contours of the four-lobed tube cross-section with P/D = 8 are given in Figure . The tangential velocity at the near-wall region appears to reach the maximum while the tangential velocity at the core region is zero. The geometric structure of the MLSG forced the fluid to deflect inside and downstream in this simulation. Four flow phenomena were observed similar to Kelvin-Helmholtz (K-H) vortices at the contact between the multi-lobed tube and the core area of the tube. This vortex structure can be attributed to the four relatively low-pressure distribution areas caused by the curvature wall, which were responsible for secondary motions. The flow was deflected to form four central circulation areas. This enhanced the intensive mixing of the fluid as it moved downstream as well as the tangential kinetic energy exchange between the fluid with high swirl intensity near the wall and the fluid with low swirl intensity inside. The tangential velocity and K-H vortex intensity gradually increased, which caused more vigorous flow mixing and an increase in the swirl intensity.
Figure 7. Tangential velocity magnitude distribution in four-lobed swirl generator (P/D = 8). (a) Re = 50,000; (b) Re = 75,000; (c) Re = 100,000; (d) Re = 125,000.
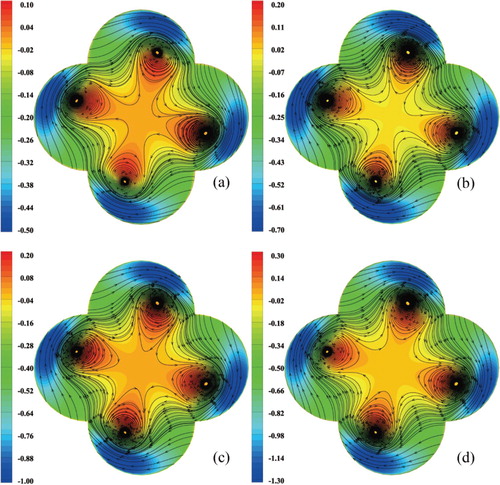
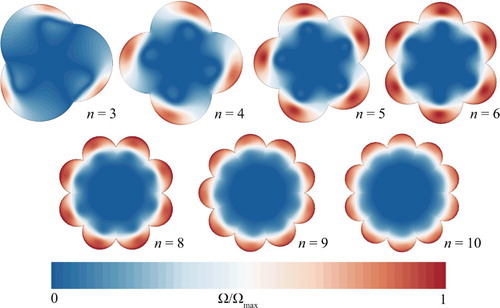
Figure shows normalized swirl number distribution contours of the MLSG cross-section. The swirl intensity was high near the wall and was relatively low in the interior due to the curvature wall, which caused secondary motions. The dominant high swirl motion was concentrated on the outside of the MLSG (Alhajeri et al., Citation2019). The K-H vortex appeared at the position of contact between the central area of the tube and the multi-lobed tube when n ≤ 6, which indicates that the momentum exchange capacity of the fluid in the tube was enhanced at that point. The tangential kinetic energy was enhanced due to the secondary flow phenomenon induced by the irregular shape of the tube. The vortex structure was the most obvious when n = 4 and n = 5. An increase in the lobe numbers weakened the kinetic energy transfer to the central region of the tube, to a certain extent, resulting in a decrease in the overall swirl intensity. The physical mechanisms of swirl flow induction in the MLSG can be roughly split into two categories: (1) geometrical characteristics increasing the fluid velocity and curvature wall which drives secondary motions (Tang et al., Citation2015), and (2) enhancement of fluid mixing caused by the K-H vortex between the core and near-wall areas. The strength of the K-H vortex in the MLSG appears to be the key to increasing the intensity of the induced swirl flow.
Figure 8. Normalized swirl number distribution at middle cross-section of multi-lobed swirl generator with P/D = 8, Re = 50,000, different lobe numbers.
4.2. Effects of different lobe numbers, pitch length ratios on swirl effectiveness
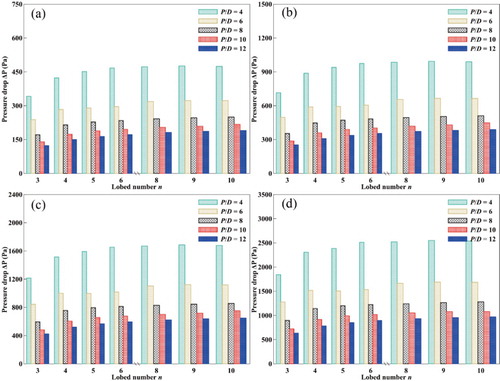
After evaluating the swirl intensity induction ability of the MLSG, the accompanying pressure loss also should be judged because it determines the pump power consumption. Figure shows the variation of pressure drop versus the lobe number n with different pitch length ratios P/D. An increase in Re appears to cause an increase in pressure drop, which indicates that the flow rate is still the main factor affecting the pressure drop. The pressure drop decreased as the pitch length ratio increased, but the decreasing rate gradually decelerated over the course of the simulation; this may be attributable to a rise in P/D leading to a rise in the form resistance and flow blockage of the MLSG. When Re did not change, higher pressure drop values were found to cause higher swirl intensities as the additional pressure drop loss principally transformed into the angular momentum of the swirl flow. The pressure drop increased as the lobe number increased, but this effect grew insignificant when lobe number n was higher than five. These combined effects may explain the changes in K-H vortex intensity and lobe number we observed. An increase in the K-H vortex intensity caused more intensive fluid mixing and an increase in the pressure drop. An increase in the lobe number caused a continuous increase in the cross-section circumference leading to additional friction loss.
Figure 9. Variation of pressure drop with lobe number under different pitch length ratios. (a) Re = 50,000; (b) Re = 75,000; (c) Re = 100,000; (d) Re = 125,000.
MLSG designs with optimal swirling performance should meet the compromise between high swirl intensity and pressure drop. The swirl effectiveness (SE) parameter was developed in this study to evaluate the influence of elevated swirl intensity and pressure loss (Ganeshalingam, Citation2002). SE, is defined as follows:
(18)
(18)
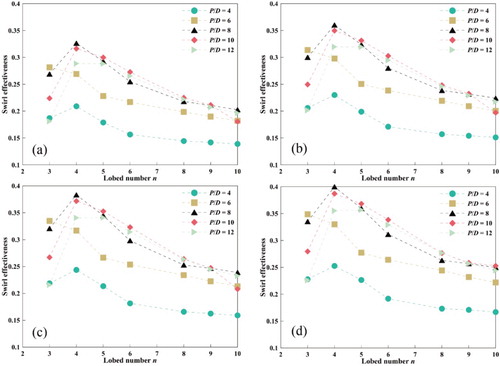
Figure shows the SE variations under various lobe numbers (n) and pitch length ratios (P/D) for the range of Reynolds numbers considered here. SE increased as P/D increased, but the rate of this increase decelerated over the course of the simulation. The SE values of P/D = 10 and 12 were very close. SE also increased as Re increased which indicates that the effect of swirl intensity on SE is more significant among the pressure drop and swirl intensity changes caused by the increase in Reynolds number. Another interesting finding is that the pitch length ratio corresponding to the optimal SE value obtained from different lobe numbers is different. The SE of the MLSG is affected by both the lobe number and the pitch length ratio. For example, when n = 3, the optimal SE value appears at P/D = 6. Similarly, the optimal SE value appears at P/D = 8 for n = 4, P/D = 10 for n = 5 and 6, respectively. The optimal SE value of the MLSG was observed in the case of n = 4 and P/D = 8; this is consistent with a previous observation by Ganeshalingam (Citation2002), who found that a four-lobed tube with P/D = 8 was most effective at swirl generation.
Figure 10. Variations in SE with lobe number under different pitch length ratios. (a) Re = 50,000; (b) Re = 75,000; (c) Re = 100,000; (d) Re = 125,000.
4.3. Effect of different lobe numbers, pitch length ratios on friction characteristics
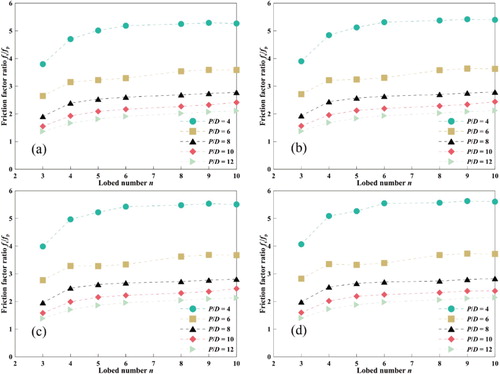
Variations in the friction factor ratio fs/fp versus lobe number with different pitch length ratios are shown in Figure . Here, fs is defined as the friction factor of the MLSG, and fp is defined as the friction factor for fully developed, non-swirling, turbulent flow in the tube. The fs/fp value varied from 1.4 to 5.6 in this simulation, which suggests that the use of the MLSG inevitably leads to a rise in pressure drop and pump power consumption. An increase in form resistance also caused a decrease in fs/fp as pitch length ratio increased. The extent of this decrease weakened over the course of the simulation. A smaller pitch length ratio also created a more pronounced distortion of the tube wall. We also observed increases in the fs/fp values as the lobe number increased, but this change was not apparent when n was greater than 5. This can be explained by the combined effects of the weakened K-H vortex and the enhanced friction loss caused by the increase in wall circumference.
Figure 11. Variations in fs/fp with lobe number under different pitch length ratios. (a) Re = 50,000; (b) Re = 75,000; (c) Re = 100,000; (d) Re = 125,000.
The swirl intensity also appears to affect the friction factor coefficient when the swirl effect is more pronounced, as such an increase indicates an increase in the actual fluid velocity magnitude, which is equivalent to changes in the Reynolds number in the tube (Cavazzuti & Corticelli, Citation2017). The relationship between friction factor ratio, Reynolds number, and geometric parameters was established in this study. An empirical correlation was developed (Equation (17)) according to the simulation results. Figure shows fitted curves of the relationship between the simulation data and the predicted values. Our correlations reasonably agreed, within ±10%, in comparison with the numerical friction factor ratio data.
(19)
(19)
Figure 12. A comparison between the numerical results and the calculated results using the presented correlations.
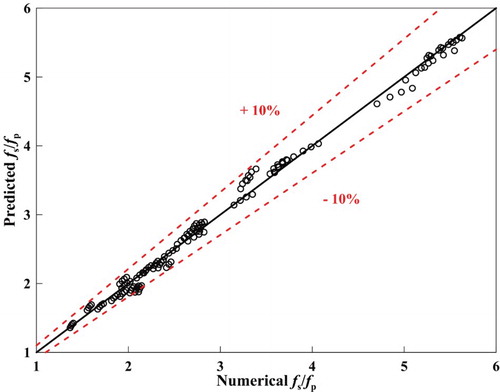
Figure shows the skin friction coefficient contours of the four-lobed tube wall under different pitch length ratios. The distribution of the skin friction coefficient in the downstream area was strongly affected by the upstream MLSG, and the pitch of the rotation appears to be related to the pitch length of the MLSG. The diagram also shows that when the P/D value was small, the distribution of the skin friction coefficient along the downstream direction was the lowest. When P/D was large, the twisted pitch of the skin friction coefficient was also large; this reflects an extension of the influence of the four-lobed tube on the downstream circular tube. This result can be attributed to vigorous fluid mixing caused by intense twisting of the tube wall under a relatively small pitch length ratio. The skin friction coefficient of the four-lobed tube decreased as the pitch length ratio increased. The maximum difference in skin friction coefficient between the pitch length ratio P/D = 4 and P/D = 12 is about 54.3%.
Figure 13. Contours of skin friction coefficient at interior wall of multi-lobed tube and downstream for different pitch length ratios.
4.4. Effects of different lobed numbers, pitch length ratios on decay rate
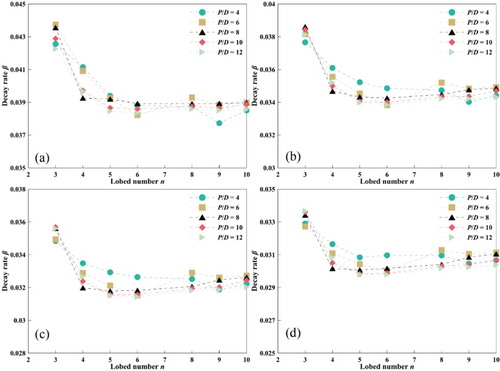
Figure shows the variations in decay rate versus lobe number with different pitch length ratios across the same Reynolds number range as that used in previous simulations. The Reynolds number affected the decay rate as a whole. As the Reynolds number increased from 50,000 to 125,000, the decay rate decreased by 27.9% on average. The continuous distance of the swirl flow appears to be longer under high Reynolds number conditions. We also found that the deviation of decay rate under different lobe numbers and pitch length ratios was significant at lower Reynolds numbers; for example, the maximum deviation of decay rate at Re = 50,000 is 15.9%. By contrast, the maximum deviations decreased to 14.1%, 13.6%, and 13.0% at Reynolds numbers Re = 75,000,100,000, and 125,000, respectively. The decay rate was more sensitive to changes in the geometric parameters of the MLSG. The momentum change caused by the transformation of the geometric parameters grew weaker as the Reynolds number increased because of an increase in the kinetic energy carried inside the fluid.
Figure 14. Variations in decay rate with lobe number under different pitch length ratios. (a) Re = 50,000; (b) Re = 75,000; (c) Re = 100,000; (d) Re = 125,000.
A decaying swirling flow is the result of viscous dissipation and angular momentum transfer to the wall of the internal fluid. The decay rate value reflects the sustainability of the swirl. In the early stage, Osami Kitoh (Citation1991) suggested that the decay rate is not a constant value, but rather than its size depends on the swirl intensity. Reader-Harris (Citation1994) considered the decay rate to be directly proportional to the friction coefficient of the tube, as reflected in the following empirical formula:
(20)
(20) Later, Steenbergen and Voskamp (Citation1998) obtained the same law and predicted decay rates as follows:
(21)
(21)
Najafi et al. (Citation2011) studied the law of decaying swirling flows by comparison against the observations by Osami Kitoh (Citation1991). They found that the decay rate is not only a function of Reynolds number but also is related to the type of swirl generation. The relationship between the decay rate and friction factor coefficient obtained by Li et al. (Citation2015) was slightly higher than that of Steenbergen; they pointed out that the difference between the results may be due to the different types of swirl generators they used. The swirl flow induction method used in Steenbergen’s experiment produced more tangential shear force on the wall compared to Li’s experimental rotating wall and four-lobed tube. Recently, Cavazzuti and Corticelli (Citation2017) obtained the relationship between decay rate and friction coefficient in the range of Re = 3,000–1,000,000 via numerical method. They concluded that the linear relationship does not capture the change in slope that the numerical data shows passing from low to high f values. The best correlation function can be expressed as follows:
(22)
(22)
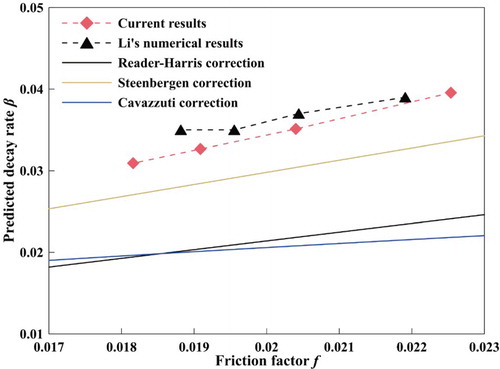
Clearly, there is no consensus regarding the precise quantification of decay rate. We found that the decay rate varies linearly with the friction factor coefficient based on our analysis of exiting numerical data. The decay rate correlation formula obtained by fitting is β = 1.76 f, β = 1.72 f, β = 1.71 f, and β = 1.70 f for the Reynolds numbers Re = 50,000, 75,000, 100,000, and 125,000, respectively. The Reynolds number range we used in this study is Re = 50,000–125,000, though no results have been previously obtained over more extensive ranges of Reynolds numbers like Cavazzuti and Corticelli (Citation2017); data tends to be more linear in the local range.
A comparison between the predicted results of different decay rates and available correlations is provided in Figure . The results we obtained in this study agree well with previously published experimental and numerical results. The decay rate appears to be related to the coefficient of friction as well as the Reynolds number. This relationship relates to the effective distance of the decaying swirling flow under different Reynolds numbers.
Figure 15. Fitted curves of decay rate and comparison between predicted values and available correlations (Cavazzuti & Corticelli, Citation2017; Li et al., Citation2015; Reader-Harris, Citation1994; Steenbergen & Voskamp, Citation1998).
5. Conclusions
In this paper, a set of CFD simulation were carried out to explore the decaying swirling flow characteristics in an MLSG with different lobe numbers and pitch length ratios in the Re range of 50,000–125,000. We found that changes in the geometric structure affects the intensity of the induced swirl flow in the MLSG. The swirl intensity was also found to decrease exponentially along the flow direction. The initial swirl intensity first increased and then decreased as the lobe number increased; the maximum value was observed at n = 4. The initial swirl intensity also decreased as the pitch length ratio increased. The numerical study was performed to analyze the influence of geometrical parameters on SE. The optimal SE value was achieved at n = 4 and P/D = 8. It was found that the friction factor coefficient ratio fs/fp increased due to the smaller form resistance as P/D increased. Finally, we established an empirical correlation of the friction factor coefficient ratio fs/fp and decay rate β accordingly. We compared our work against previously published results to validate our method. The decaying swirling characteristics induced via a multi-lobed swirl generator were presented in this paper. However, the manner in which the swirl is created is essential, though it was not discussed here. In the future, we will consider a decaying swirling flow induced by different types of swirl generator over an extensive range of Reynolds numbers.
Disclosure statement
No potential conflict of interest was reported by the author(s).
Additional information
Funding
References
- Akbarian, E., Najafi, B., Jafari, M., Ardabili, S. F., Shamshirband, S., & Chau, K. (2018). Mechanics experimental and computational fluid dynamics- based numerical simulation of using natural gas in a dual-fueled diesel engine. Engineering Applications of Computational Fluid Mechanics, 12(1), 517–534. 10.1080/19942060.2018.1472670
- Alhajeri, H. M., Almutairi, A., Alenezi, A. H., & Gamil, A. A. A. (2019). Numerical investigation on heat transfer performance and flow characteristics in a roughened vortex chamber. Applied Thermal Engineering, 153(January), 58–68. https://doi.org/10.1016/j.applthermaleng.2019.02.071
- ANSYS, Inc. (2011). Fluent 14.0 user' s guide. Fluent Incorporated.
- Ansys, Inc. (2016). Fluent 17.0 Theory Guide. Fluent Incorporated.
- Aydin, O., Avci, M., Markal, B., & Yusuf Yazici, M. (2014). An experimental study on the decaying swirl flow in a tube. International Communications in Heat and Mass Transfer, 55, 22–28. https://doi.org/10.1016/j.icheatmasstransfer.2014.04.012
- Beér, J. M., & Chigier, N. A. (1972). Combustion aerodynamics. Academic Press.
- Blasius, H. (1913). Das aehnlichkeitsgesetz bei reibungsvorgängen in flüssigkeiten. In Mitteilungen über Forschungsarbeiten auf dem Gebiete des Ingenieurwesens (pp. 1–41). Springer.
- Cavazzuti, M., & Corticelli, M. A. (2017). Convective heat transfer of turbulent decaying swirled flows in concentric annular pipes. Applied Thermal Engineering, 120, 517–529. https://doi.org/10.1016/j.applthermaleng.2017.04.015
- Dudley, B. (2019). BP statistical review of world energy. BP Statistical Review.
- Escue, A., & Cui, J. (2010). Comparison of turbulence models in simulating swirling pipe flows. Applied Mathematical Modelling, 34(10), 2840–2849. https://doi.org/10.1016/j.apm.2009.12.018
- Fokeer, S., Lowndes, I. S., & Hargreaves, D. M. (2010). Numerical modelling of swirl flow induced by a three-lobed helical pipe. Chemical Engineering and Processing: Process Intensification, 49(5), 536–546. https://doi.org/10.1016/j.cep.2010.04.004
- Fokeer, S., Lowndes, I., & Kingman, S. (2009). An experimental investigation of pneumatic swirl flow induced by a three lobed helical pipe. International Journal of Heat and Fluid Flow, 30(2), 369–379. https://doi.org/10.1016/j.ijheatfluidflow.2008.12.004
- Gabl, R., & Righetti, M. (2018). Design criteria for a type of asymmetric orifice in a surge tank using CFD. Engineering Applications of Computational Fluid Mechanics, 12(1), 397–410. 10.1080/19942060.2018.1443837
- Ganeshalingam, J. (2002). Swirl-induction for improved solid-liquid flow in pipes. University of Nottingham.
- Ghalandari, M., Bornassi, S., & Shamshirband, S. (2019). Mechanics Investigation of submerged structures ‘ flexibility on sloshing frequency using a boundary element method and finite element analysis. Engineering Applications of Computational Fluid Mechanics, 13(1), 519–528. 10.1080/19942060.2019.1619197
- Gibson, M. M., & Launder, B. E. (1978). Ground effects on pressure fluctuations in the atmospheric boundary layer. Journal of Fluid Mechanics, 86(3), 491–511. 10.1017/S0022112078001251
- Jafari, M., Dabiri, S., Farhadi, M., & Sedighi, K. (2017). Effects of a three-lobe swirl generator on the thermal and flow fields in a heat exchanging tube: An experimental and numerical approach. Energy Conversion and Management, 148, 1358–1371. https://doi.org/10.1016/j.enconman.2017.06.074
- Jafari, M., Farhadi, M., & Sedighi, K. (2017a). An experimental study on the effects of a new swirl generator on thermal performance of a circular tube. International Communications in Heat and Mass Transfer, 87(August), 277–287. https://doi.org/10.1016/j.icheatmasstransfer.2017.07.016
- Jafari, M., Farhadi, M., & Sedighi, K. (2017b). Thermal performance enhancement in a heat exchanging tube via a four-lobe swirl generator: An experimental and numerical approach. Applied Thermal Engineering, 124, 883–896. https://doi.org/10.1016/j.applthermaleng.2017.06.095
- Launder, B. E., & Shimat, N. (1989). Second-moment closure for the near-wall sublayer: Development and application. AIAA Journal, 27(10), 1319–1325. 10.2514/3.10267
- Li, G. (2016). Investigation of swirl pipe for improving cleaning efficiency in closed processing system. University of Nottingham.
- Li, G., Hall, P., Miles, N., & Wu, T. (2015). Improving the efficiency of “clean-in-place” procedures using a four-lobed swirl pipe: A numerical investigation. Computers and Fluids, 108, 116–128. https://doi.org/10.1016/j.compfluid.2014.11.032
- Li, G., Miles, N. J., Wu, T., & Hall, P. (2017). Large eddy simulation and Reynolds-averaged Navier–stokes based modelling of geometrically induced swirl flows applied for the better understanding of clean-in-place procedures. Food and Bioproducts Processing, 104, 77–93. https://doi.org/10.1016/j.fbp.2017.05.001
- Lin, C. H., Yen, C. H., & Ferng, Y. M. (2014). CFD investigating the flow characteristics in a triangular-pitch rod bundle using Reynolds stress turbulence model. Annals of Nuclear Energy, 65, 357–364. https://doi.org/10.1016/j.anucene.2013.11.023
- Martemianov, S., & Okulov, V. L. (2004). On heat transfer enhancement in swirl pipe flows. International Journal of Heat and Mass Transfer, 47(10–11), 2379–2393. https://doi.org/10.1016/j.ijheatmasstransfer.2003.11.005
- Najafi, A. F., Mousavian, S. M., & Amini, K. (2011). Numerical investigations on swirl intensity decay rate for turbulent swirling flow in a fixed pipe. International Journal of Mechanical Sciences, 53(10), 801–811. https://doi.org/10.1016/j.ijmecsci.2011.06.011
- Omidi, M., Farhadi, M., & Rabienataj, A. A. (2018). Numerical study of heat transfer on using lobed cross sections in helical coil heat exchangers: Effect of physical and geometrical parameters. Energy Conversion and Management, 176(September), 236–245. https://doi.org/10.1016/j.enconman.2018.09.034
- Osami Kitoh. (1991). Experimental study of turbulent swirling flow in a straight pipe. Journal of Fluid Mechanics, 225, 445–479. 10.1017/S0022112091002124
- Petukhov, B. S. (1970). Heat transfer and friction in turbulent pipe flow with variable physical properties. Advances in Heat Transfer, 6(C), 503–564. https://doi.org/10.1016/S0065-2717(08)70153-9
- Salih, S. Q., Aldlemy, M. S., Rasani, M. R., Ariffin, K., Mohammad, T., Shah, Y., Ansari, N., Yaseen, Z. M., & Chau, K. (2019). Mechanics Thin and sharp edges bodies-fluid interaction simulation using cut-cell immersed boundary method. Engineering Applications of Computational Fluid Mechanics, 13(1), 860–877. 10.1080/19942060.2019.1652209
- Reader-Harris, M. J. (1994). The decay of swirl in a pipe. International Journal of Heat and Fluid Flow, 15(3), 212–217. https://doi.org/10.1016/0142-727X(94)90040-X
- Steenbergen, W., & Voskamp, J. (1998). The rate of decay of swirl in turbulent pipe flow. Flow Measurement and Instrumentation, 9(2), 67–78. https://doi.org/10.1016/S0955-5986(98)00016-8
- Taheran, E., & Javaherdeh, K. (2019). Experimental investigation on the effect of inlet swirl generator on heat transfer and pressure drop of non-Newtonian nanofluid. Applied Thermal Engineering, 147(August 2018), 551–561. https://doi.org/10.1016/j.applthermaleng.2018.07.142
- Tang, X., Dai, X., & Zhu, D. (2015). Experimental and numerical investigation of convective heat transfer and fluid flow in twisted spiral tube. International Journal of Heat and Mass Transfer, 90, 523–541. https://doi.org/10.1016/j.ijheatmasstransfer.2015.06.068
- Tonkin, R. J. J. (2005). Swirling pipeflow of non-Newtonian and particle-laden fluids. University of Nottingham.
- Zhou, J. W., Du, C. L., Liu, S. Y., & Liu, Y. (2016). Comparison of three types of swirling generators in coarse particle pneumatic conveying using CFD-DEM simulation. Powder Technology, 301, 1309–1320. https://doi.org/10.1016/j.powtec.2016.07.047