
 ?Mathematical formulae have been encoded as MathML and are displayed in this HTML version using MathJax in order to improve their display. Uncheck the box to turn MathJax off. This feature requires Javascript. Click on a formula to zoom.
ABSTRACT
To analyze the complex spatiotemporal evolution law of the high-speed jet flow field in a liquid-ring pump ejector, both the classic and spectral proper orthogonal decomposition (SPOD) methods were introduced to decompose the transient flow field based on the numerical large eddy simulation. The proper orthogonal decomposition (POD) reduced order model (ROM) of the complex flow in the ejector was established to analyze the transient characteristics and reconstruct the flow field. The spatial mode characteristics of density, pressure and vorticity field, and the frequency domain characteristics of mode coefficients were analyzed. The results show that the spatiotemporal decoupling analysis of a high-speed jet flow field can be accomplished by the POD and SPOD methods. A large-scale symmetric coherent structure is formed in the shear layer of the first two modes of vorticity, and a small-scale antisymmetric structure is formed at the trailing edge of the jet flow for the third and fourth modes. This reflects the evolutionary characteristics of the jet shear vortex. There is a significant spatial correlation between the density and pressure modes, reflecting that the evolution of the two structures has important correlation characteristics. The spectral analysis of the mode coefficients shows that the dominant frequencies of 1250 Hz and 18 kHz correspond to the self-excited oscillation frequency of shock waves and the vortex shedding frequency. The POD-ROM can reconstruct the high-speed flow field of the ejector with enough accuracy using the first 30-order modes, and the root mean square error and mean absolute percentage error for the velocity prediction are 0.48% and 0.24%, respectively.
1. Introduction
A liquid-ring pump ejector is a kind of special fluid machinery, which transfers energy using a high-speed jet. Owing to its advantages of no leakage, strong self-priming and compact structure, it is widely used in refrigeration, vacuum, mining and petrochemical engineering, etc. To improve the hydraulic performance, the ejector is also used in the liquid-ring pump ejector system (Bartosiewicz et al., Citation2005; Chunnanond & Aphornratana, Citation2004; Jiang et al., Citation2021; Omidvar et al., Citation2016; Suvarnakuta et al., Citation2020). The ejector outlet is connected to the inlet of the liquid-ring pump. The high-speed jet formed by the pressure difference between the nozzle inlet and the liquid-ring pump suction inlet can improve the vacuum of the secondary flow inlet.
Although the geometric structure of the ejector is very compact, its inner flow field involves shear flow, shock wave, separation flow and mutual interference of multiple physical fields (Gaitonde, Citation2015; Jeyakumar et al., Citation2021; X. Li et al., Citation2021; Mitchell et al., Citation2012; Rana et al., Citation2013; H. Wang et al., Citation2017; R. C. Zhang et al., Citation2019). Therefore, it is very difficult to identify the complex internal flow characteristics of the ejector and reveal the coupling mechanism between the flow structure and its hydraulic performance.
In recent years, researchers have made a lot of progress in the study of the complex inner flow in the ejector. Nogueira (Citation2019) and Q. L. Liu and Lai (Citation2021) studied the complex coherent structure in the jet flow. The results show that the jet coherent structure includes a streaky structure between high-speed flow and low-speed fluid. C. Zhang et al. (Citation2021) studied the flow-field characteristics of an underwater supersonic jet based on Reynolds-averaged Navier–Stokes (RANS) and volume of fluid (VOF) models, and analyzed the shock-wave oscillation phenomenon in the core area of the jet. The research of X. Wang et al. (Citation2021) shows that the ejector has the minimum entropy production and the maximum entrainment ratio when it operates under the overexpansion condition. A new non-equilibrium evaporation cavitation computational fluid dynamics (CFD) model was used by Y. Li and Deng (Citation2022) to conduct numerical simulation in the trans-critical CO2 ejector. Y. Q. Li et al. (Citation2021) used a numerical simulation method to analyze the influence of different near-wall processing methods on the complex flow structure in the steam ejector. A computational analysis of different configurations in the application of Al2O3 nanoparticles was developed by Granados-Ortiz et al. (Citation2021) to submerge high Reynolds turbulent jet flows for cooling purposes. X. Wang et al. (Citation2020) used a combination of the realizable k–ϵ turbulence model and the Schnerr Sauer cavitation model to analyze the influence of the suction chamber and throat inlet profiles on the cavitation performance of the annular jet pump. Xiao et al. (Citation2020) established a single-jet nozzle model with different traverse speeds to investigate the jet flow-field features and deflection characteristics, and analyzed the effects of nozzle traverse speed and jet pressure through numerical simulations.
Proper orthogonal decomposition (POD) is an analytical method that has been applied to extract the main flow characteristics and coherent structure from turbulent flows (Alomar et al., Citation2020; Guo et al., Citation2021; Q. S. Zhang, Citation2015; R. Zhang et al., Citation2021). It is widely used in complex turbulent flows such as shear flow (Jahanbakhshi & Madnia, Citation2016), boundary layer transition (Chen et al., Citation2021) and jet flow (Dvorak & Safarik, Citation2005; Hassan, Citation2020; Ye et al., Citation2021). Moreno et al. (Citation2004) applied the POD method to analyze PIV test data in the rectangular ejector and constructed a reduced order model (ROM) for flow-field reconstruction. Phan et al. (Citation2022) analyzed the pressure fluctuation characteristics of an impingement jet by the POD method, and obtained the instantaneous maximum pressure gradient and its position through flow-field reconstruction. Sun et al. (Citation2021) studied the self-excited oscillation characteristics of a shock train in isolated section by POD and dynamic modal decomposition methods, and predicted the evolutionary characteristics of the unsteady flow field. Shinneeb et al. (Citation2008) studied the flow characteristics of circular nozzle jet by particle image velocimetry (PIV) technology, and analyzed the evolution law of large-scale flow structures in the flow field by the POD method. Researchers have proposed several modifications and enriched approaches for improving the element-free Galerkin method, and used the POD method to reduce central processing unit (CPU) time (Abbaszadeh et al., Citation2020; Abbaszadeh et al., Citation2021; Dehghan & Abbaszadeh, Citation2016; Dehghan et al., Citation2019; Parvizi et al., Citation2020). Motivated by the need to reduce such large amounts of resources, Abadía-Heredia et al. (Citation2022) proposed a new predictive ROM based on POD to solve fluid dynamics problems. Lopez-Martin et al. (Citation2021) presented a comparison study between different classic machine learning and deep learning techniques and recent methods for data-driven analysis of dynamical models (dynamic mode decomposition) and deep learning ensemble models applied to short-term load forecasting. Roth (Citation2021) analyzed the ROM of fluid mechanics problems using the POD method. Holemans et al. (Citation2022) proposed a new method for obtaining POD basis functions from a small subset of data initially, and then used them in the ROM of either the complete data set or the reduced data set.
The difference between the spectral proper orthogonal decomposition (SPOD) and the classical POD method is that the SPOD method can obtain modes with different frequencies of the flow field, which provides more valuable coherent structures for researchers. Schmidt and Colonius (Citation2020) discussed the SPOD and its application in identifying modes, and proposed a specific algorithm based on estimating the cross-spectral density tensor with Welch’s method. Sieber et al. (Citation2016) proposed a new method termed SPOD to overcome the deficit of POD in extracting multiple frequency structures. Vanierschot et al. (Citation2020) analyzed the shape and dynamics of helical coherent structures found in the flow field of an annular swirling jet undergoing vortex breakdown using both classic POD and SPOD. Towne et al. (Citation2018) discussed SPOD and its relationship to dynamic mode decomposition and resolvent analysis. Lario et al. (Citation2021) reconstructed the latent space dynamics of high-dimensional systems using model order reduction via SPOD.
In this study, to analyze the dynamic evolution law of the high-speed flow in the liquid-ring pump ejector, numerical large eddy simulation (LES) was performed first, and then the flow field was analyzed using POD and SPOD methods. The spatial mode evolution law of density, pressure and vorticity fields, and the frequency domain characteristics of mode coefficients were studied. Furthermore, the POD-ROM was established to analyze the transient characteristics and reconstruct the flow field.
2. Computational model and numerical methods
2.1. Geometric model and grid
Owing to the difficulty of calculating the gas–liquid two-phase flow through the density-based solver, and also to save computational cost, the liquid-ring pump ejector is isolated from the liquid-ring pump. In this study, the high-speed gas-phase flow in the ejector can be numerically simulated and analyzed separately. This study takes the KLRC-200 liquid-ring pump ejector as the study subject. The geometric model and local grid topology of the ejector are shown in Figure , and the basic geometric parameters are shown in Table . The computational domain of the ejector encompasses the nozzle, suction chamber, mixing chamber and diffuser. The computational domain was discretized by hexahedral structured grids, and the mesh independence was verified. The histogram in Figure manifests the trend of secondary fluid mass flow rate with the number of grids. It can be seen that the mass flow rate decreases first and then stabilizes with the increase in the number of grids. Therefore, the case with about 1 × 10⁷ grid cells was selected for numerical simulation in this study.
Figure 1. Geometric model and grid of the ejector: (a) two-dimensional structure; (b) three-dimensional model; (c) grid topology.
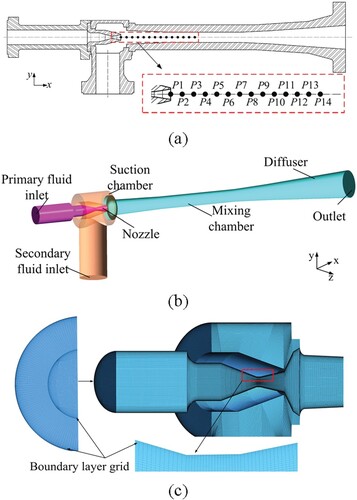
Figure 2. Grid independence verification.
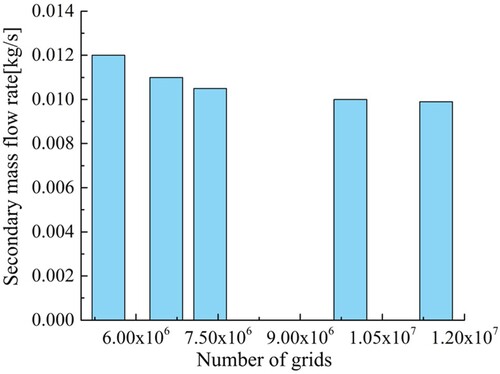
Table 1. Basic parameters of the ejector.
Pope’s criterion is introduced to verify the grid resolution of numerical LES, and the evaluation coefficient M is defined as:
(1)
(1) where K_RES is the turbulent kinetic energy of the resolved eddies and K_SGS is the turbulent kinetic energy of the subgrid-scale eddies.
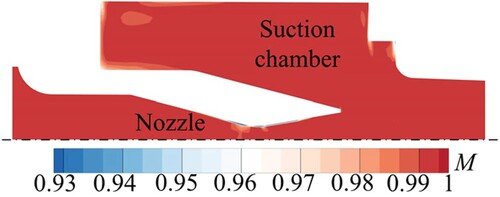
Figure shows the energy ratio distribution of the resolved turbulent kinetics based on Pope’s criterion. It can be seen that more than 90% of the resolved turbulent kinetic energy can be captured by the grid, indicating that the grid resolution fully meets the accuracy requirements of numerical LES.
Figure 3. Resolved turbulent kinetic energy ratio distribution.
2.2. Numerical method and boundary conditions
In the liquid-ring pump ejector, the viscous contact discontinuous shock-wave region is formed as a result of the pressure difference between the inlet and outlet of the nozzle. For the high-speed gas flow, the compressibility should be considered. So, a density-based explicit solver based on the finite volume method was proposed to carry out numerical simulation. The Roe–flux-difference splitting scheme was used for the inviscid flux discretization, and the volumes surrounding the cells were controlled by the least squares calculation gradient. The discretization schemes available for the momentum and energy equations were set to second order upwind. An implicit scheme with first-order accuracy was used to process the time terms. The LES and Smagorinsky–Lilly turbulence models were used to simulate the unsteady flow field in the ejector. The pressure inlet boundary condition was applied for both the primary fluid and secondary fluid inlet, and the pressure outlet boundary condition for the outlet. The inlet pressure of the primary fluid and the secondary fluid were 0.15 and 0.025 MPa, and the temperature was 300 K. Considering the compressibility of the gas in the ejector, the gas was set as ideal gas. A no-slip boundary condition was used for the wall. The convergence residual was set to 1 × 10⁻⁶, and the time step was Δt = 1 × 10⁻⁶ s. The transient flow field of the ejector was analyzed when the unsteady calculation tended to converge, after 12,000 step iterations.
2.3. Proper orthogonal decomposition
The POD is an effective ROM method, also known as principal component analysis method, which is often used for the dimension reduction of complex nonlinear problems. In this study, the POD decomposition of the high-speed jet flow field in the ejector was carried out based on the snapshot theory.
The matrix of the transient flow field was obtained by numerical calculation. The mean value of the matrix
was solved by Equation Equation(2)
(3)
(3) :
(2)
(2) where M is the spatial dimension and N is the number of spatial sampling points. The pulsation matrix is expressed as:
(3)
(3)
The correlation matrix was solved, and the eigenvalue
and eigenvector
of the correlation matrix were calculated:
(4)
(4)
(5)
(5) The POD mode can be obtained by eigenvector mapping:
(6)
(6) The flow field at any time can be expressed as:
(7)
(7) where
is the basic mode coefficient, which can be calculated by the following formula:
(8)
(8) The magnitude of the basic mode energy can be reflected by the magnitude of the eigenvalue. The ratio of the first r-order modes energy to the total energy can be expressed as:
(9)
(9) The mode time coefficients of the first r-order POD basic modes were obtained by the least square method, and the POD–radial basis function (RBF) model was defined:
(10)
(10) where
is the jth component corresponding to the hth order POD mode,
is the RBF network model coefficient, and
is the RBF. The Gaussian RBF is selected, which can be expressed as:
(11)
(11) where
,
can be calculated from the sample spacing.
3. Results and discussion
3.1. Experimental analysis
The experiment was carried out on the liquid-ring pump ejector test system set up by the research team. Figure (a) illustrates the test system and Figure (b) the schematic diagram of the test system. The test system includes the liquid-ring pump, ejector, power and control system, water feeding system, data collecting system, inlet and outlet pipeline system, etc. The ejector is connected in series with the liquid-ring pump, and its outlet is connected to the inlet of the liquid-ring pump. When the ejector is working, valve 9 is fully opened and valve 13 is closed. The secondary flow inlet vacuum is controlled by adjusting the opening of valve 14. The vacuum and flow rate of secondary fluid inlet were measured by pressure gauge 11 and orifice flowmeter 3, and the flow rate of the primary fluid was measured by turbine flowmeter 10.
Figure 4. Experimental system: (a) liquid-ring pump ejector test system; (b) schematic diagram of liquid-ring pump injector test system. 1. Water tank; 2. control cabinet; 3. orifice flowmeter; 4. feeding pump; 5. motor; 6. liquid-ring pump; 7. gas–liquid separation tank; 8. ejector; 9. flow control valve; 10. turbine flowmeter; 11. pressure gauge; 12. pressure gauge; 13. control valve; 14. control valve; 15. control valve.
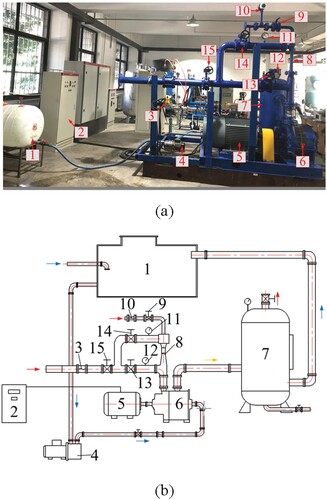
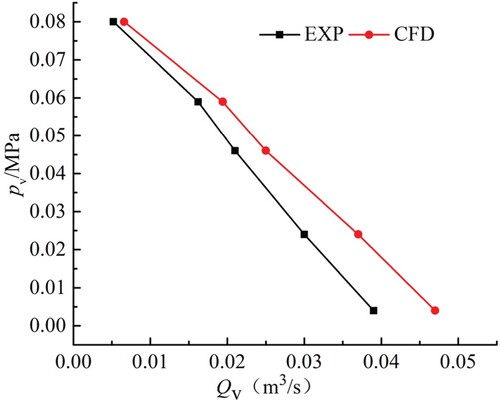
Figure shows the comparison between the numerical simulation and experimental results of the ejector. As can be seen from the figure, the suction vacuum PV gradually decreases as discharge volume QV rises. The trend of the performance curve acquired by numerical simulation has a good agreement with the experimental results. However, there is still minor error between the numerical simulation and the experimental results. The main reason is that the losses caused by pump axial gap leakage are not considered. The grid resolution used makes it difficult to capture the small-scale structure of the jet flow in the ejector, and part of the hydraulic losses is difficult to predict. The root mean square error (RMSE) is 0.53%.
Figure 5. Comparison between numerical and experimental results. EXP = experiment; CFD = computational fluid dynamics.
3.2. Transient flow-field characteristics of liquid-ring pump ejector
The axial flow-field distribution of the liquid-ring pump ejector is shown in Figure .
Figure 6. Flow field of the ejector axial plane: (a) axial vortex structure based on Q criterion; (b) sub-grid turbulent dissipation; (c) numerical schlieren of the density gradient.
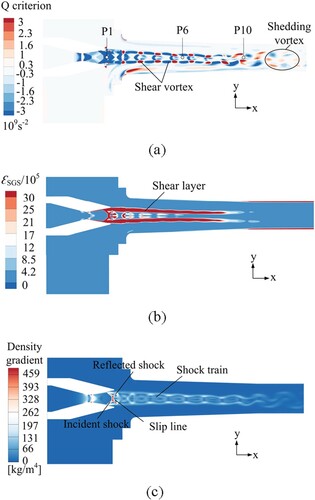
Figure (a) shows the axial vortex structure based on the Q criterion. As can be seen from the figure, the cylindrical shear layer is formed between the high-speed flow and low-speed flow for a strong velocity gradient, and opposite rotating shear vortices are formed in the cylindrical shear layer. The energy of the high-speed jet is transferred through the cylindrical shear layer, and shedding vortices are formed at the trailing edge of the jet. The sub-grid turbulence dissipation in Figure (b) shows that the energy loss in most regions is low, while the energy loss in the jet shear layer and shock-wave region increases owing to the influence of the shear vortex and shock wave. Figure (c) is the numerical schlieren diagram of the density gradient in the axial plane. It can be seen that the reflected shock wave is formed by Mach reflection of the incident shock wave inside the nozzle accompanied by the generation of slip lines. Meanwhile, a rhomboid shock train structure is formed under the interaction between the reflected shock waves and the jet shear layer. The reason for this is that the shock wave will reflect when it intersects with some contact surfaces with discontinuous physical quantities. Furthermore, it can be seen that there is an obvious oscillation phenomenon at the trailing edge of the jet.
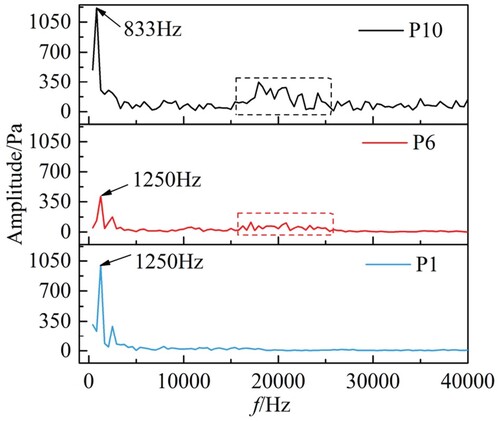
The high-speed jet flow field presents strong unsteady characteristics owing to the interaction between the shock wave and the shear layer. A large number of studies show that there is a strong correlation between the self-excited oscillation of the shock string and the pressure pulsation of the flow field (Huang et al., Citation2019; Ikui et al., Citation1974; J. Liu & Yang, Citation2016). To analyze the oscillation characteristics of the shock train, 14 measuring points were arranged equidistantly along the axial direction (see Figure (a)). Figure shows the pressure pulsation frequency domain distribution of measuring points P1, P6 and P10. It can be seen from the figure that the dominant frequency of measuring points P1 and P6 is 1250 Hz, which is the self-excited oscillation frequency of the shock wave. The reason for this is that the measuring points P1 and P6 are located in the shock-wave region, and are easily affected by the pulsation load caused by shock-wave oscillation. Meanwhile, it can be seen that the oscillation frequency of the shock wave at measuring point P10 is 833 Hz. Compared with measurement points P1 and P6, the frequency of measurement point P10 is lower and the oscillation amplitude is higher. The trend of oscillation amplitude has a good agreement with the result of C. P. Wang and Zhang (Citation2010). The self-excited oscillation of the shock-wave train is dominated by multiple frequencies and has the characteristics of low energy in the high-frequency region and high energy in the low-frequency region. In addition, it can be seen that there are high-frequency pulsation components at measuring points P6 and P10, and the pulsation amplitude of measuring point P10 is higher. The reason for this is that the measuring point P10 is located at the trailing edge of the jet flow and is greatly affected by the shedding vortex.
Figure 7. Spectrum analysis of pressure fluctuation at different monitoring points.
3.3. POD mode decomposition of high-speed jet flow field
To extract the main flow characteristics and coherent structure of the high-speed jet flow field, a total of 600 instantaneous data points of the flow field were sampled at 4 × 10⁻⁶ s intervals. The distribution of the POD mode energy in the axial density, pressure, velocity and vorticity fields of the ejector is shown in Figure .
Figure 8. Mode energy ratio distribution.
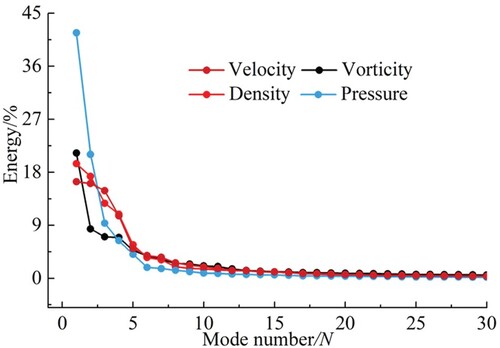
It is observed from the figure that the first four order modes of vorticity, density, pressure and velocity field containsignificant percentage of the total energy, and the energy proportions of the first four modes of vorticity, density, pressure andvelocity field to the total energy are 43%, 60%, 78% and 58%. In addition, it can be seen that the mode energy decreases rapidly with the increase in the number of modes, and the mode energy tends to 0 after the 30th mode. Accordingly, the analysis of the mode characteristics to be discussed later is confined mostly to these dominant modes.
Figure shows the distribution of the first four order vorticity modes in the section of the ejector. It can be observed from the figure that a large-scale symmetric coherent structure is formed in the shear layer, and a smaller scale structure is formed at the nozzle exit. Here, the large-scale coherent structure corresponds to the disturbance of jet shear vortex to the flow field, and the small-scale structure reflects the vortex caused by slip-line instability. Slip-line instability is a flow phenomenon caused by shock-induced flow instability (Liang et al., Citation2018). For the third- and fourth-order modes, the spatial structure is obviously different from those of the first two order modes. It can be observed that there are antisymmetric and alternating small-scale coherent structures at the trailing edge of the jet. The distribution of the first four modes shows that the large-scale coherent structures in the jet shear layer break into small-scale structures in the process of evolution. These characteristics are significantly correlated with the evolution of shear vortex.
Figure 9. Sectional vorticity field mode.
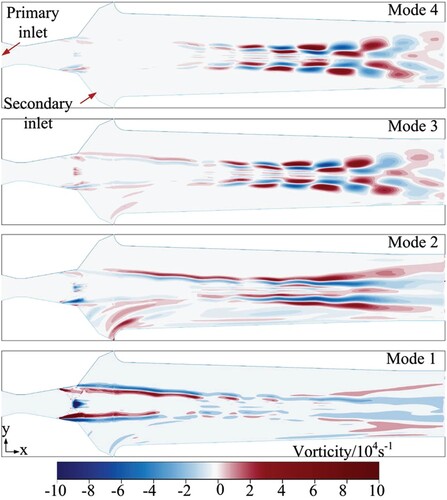
Figure shows the distribution of the first four order density modes in the section of the ejector. It can be seen from the first two spatial modes that a λ-shape structure and oscillation distribution region are presented in the nozzle and the jet core region, respectively. These features are also shown in Figure (c), where a similar λ shock wave and rhombic shock train are clearly displayed. Furthermore, it can be seen that there are alternating small-scale structures at the trailing edge of the jet in the first-order mode. The alternating small-scale structure of the first-order mode gradually evolves into an antisymmetric pattern along the axial in the second-order and third-order modes. The alternating structure is closely related to the oscillation and vortex shedding phenomenon at the trailing edge of the jet shown in Figure , which will be analyzed later.
Figure 10. Sectional density field mode.
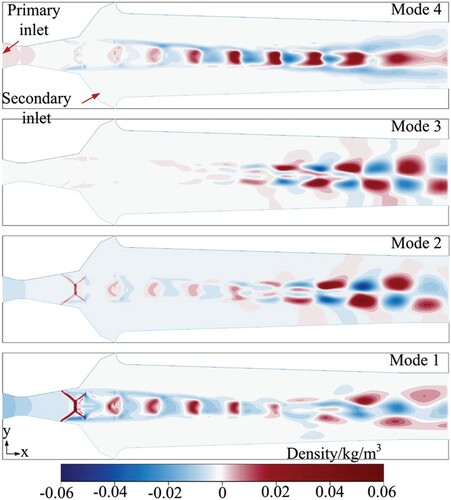
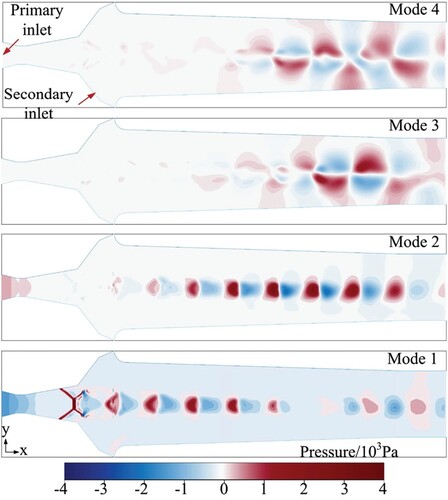
Figure shows the distribution of the first four order pressure modes in the section of the ejector. Compared with the spatial distribution of the density mode in Figure , the λ-shaped structure and oscillation area can be seen in the first-order pressure mode, and the alternating structure can also be observed at the trailing edge of the third-order and fourth-order modes. These phenomena indicate that there is a significant spatial correlation between the density and the pressure modes, reflecting that the evolution of two structures has important correlation characteristics.
Figure 11. Sectional pressure field mode.
The spatial characteristics of first four order POD modes were discussed based on a comprehensive comparison of the different flow fields. To analyze the frequency domain characteristics of the mode coefficient, the spectral results of mode coefficients were calculated by fast Fourier transform and are shown in Figure .
Figure 12. Spectrum of mode coefficients: (a) spectrum of vorticity mode coefficients; (b) spectrum of density mode coefficients.
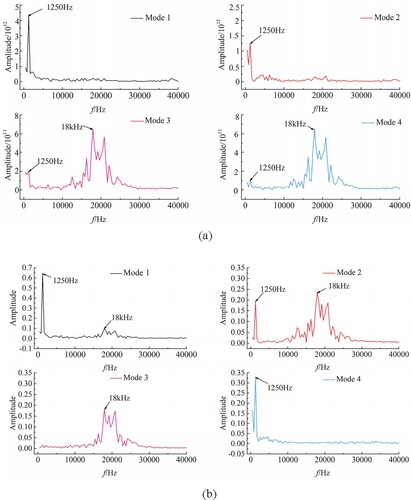
Figure 2(a) shows the spectrum analysis of the first four order vorticity mode coefficients. Noticeably, dominant peaks can be detected in the spectrum results. For the first two modes of vorticity, a pronounced peak of 1250 Hz occurs at a lower frequency range. For modes 3 and 4, the dominant frequency of 18 kHz takes place in the high-frequency range and also has a low-frequency component of 1250 Hz. These observations are consistent with the spectral results based on the pressure fluctuation in Figure . The result of the density mode coefficient in Figure 2(b) shows the same frequency components as in Figure 2(a). Therefore, a comprehensive analysis of both spatial mode and mode coefficient results for vorticity and density was performed. The results show that the dominant frequencies of 1250 Hz and 18 kHz correspond to the self-excited oscillation frequency of shock waves and the vortex shedding frequency, respectively.
3.4. SPOD decomposition of density field
The SPOD method was used to decompose the jet density field to obtain the spatiotemporal coupling single-frequency mode. Welch’s method was used to divide the snapshot matrix into five blocks, and the number of snapshots in each block was 200. The SPOD energy spectrum of the density field is shown in Figure .
Figure 13. Spectral proper orthogonal decomposition (SPOD) energy spectra of the density field.
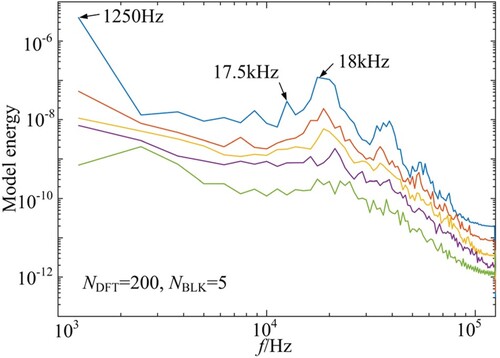
Figure shows the SPOD spectra distribution of the jet density field. It can be seen that the energy at different frequencies is arranged in descending order, and the energy of the first mode at different frequencies is the highest, indicating that the first mode is the dominant mode of the flow field. Furthermore, compared with the spectral distribution of POD mode coefficients in Figure , it can be seen that the SPOD mode also has energy peaks at frequencies of 1250 Hz and 18 kHz.
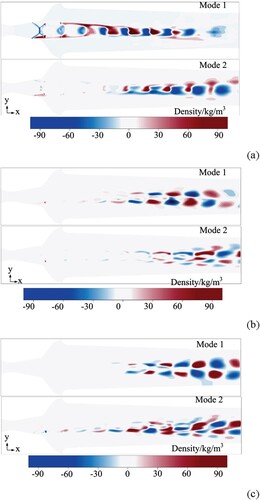
Figure shows the dominant mode distribution of SPOD in the jet density field. Compared with Figure , it can be seen that the SPOD method can also accurately extract the jet coherent structure and obtain the single-frequency mode of the flow field. When the frequency is 1250 Hz, the first-order mode results of SPOD and POD are basically similar. However, there is still minor error between the results of SPOD and POD. The first-order SPOD mode only captures the λ shock wave and shock-train structure. When the frequency is 17.5 and 18 kHz, the first-order SPOD mode is similar to the third-order POD mode structure, and the small-scale alternating structure is captured. These results show that SPOD method can present accurate single-frequency characteristics and greatly improve the multi-frequency coupling problem of POD modal decomposition. Meanwhile, it can be seen that the SPOD results between the second-order mode and the first-order mode are different. Compared with the first-order SPOD mode, the scale of the coherent structure captured by the second-order mode is much smaller. These characteristics reveal the evolution law of the jet coherent structure.
Figure 14. Dominant spectral proper orthogonal decomposition (SPOD) modes of the density field: (a) frequency of 1250 Hz; (b) frequency of 17.5 kHz; (c) frequency of 18 kHz.
3.5. Flow-field prediction analysis
In the context of flow-field reconstruction problems, it has been suggested that 99% of the total energy be used as a cut-off for representing the flow field accurately. Furthermore, research suggests that 75% of energy may be sufficient for a good representation of the flow field. Here, the first 30 POD modes of velocity were used, as they contain 92% of the total energy. CFD numerical simulation and POD reconstruction are completed on a small workstation with the same CPU configuration. The CFD numerical simulation and POD reconstruction time are 48 h and 60 s, respectively. Therefore, the POD-ROM is important to reduce the CPU time.
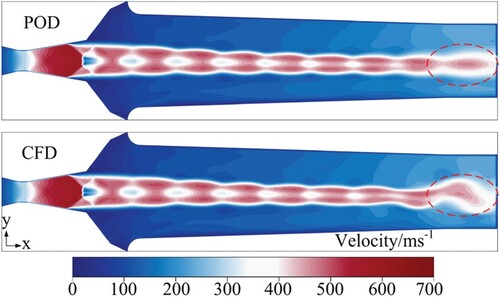
Figure shows the comparison between CFD and POD reconstructed results of the velocity field. As can be seen from the CFD result, the velocity of the primary fluid reaches supersonic speed at the nozzle outlet. Moreover, the velocity in the core of the jet presents discontinuous characteristics for the influence of the shock train. For the reconstructed data, it appears that the first 30 modes capture the velocity field with fidelity. However, there is still a small difference between the POD and CFD results at the jet trailing edge.
Figure 15. Comparison between proper orthogonal decomposition (POD) and computational fluid dynamics (CFD) results of the velocity field.
The root mean square error (RMSE) and mean absolute percentage error (MAPE) are defined as (Strušnik & Avsec, Citation2022; R. H. Zhang et al., Citation2018):
(12)
(12)
(13)
(13) where fi,POD and fi,CFD are the POD and CFD results of different grid nodes, respectively, and K is the total number of grid nodes.
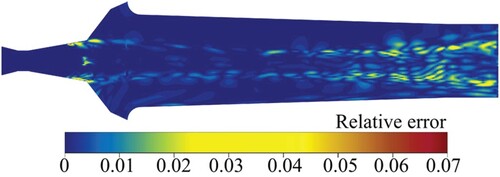
Figure shows the prediction error of the velocity field. It can be seen that the prediction error in most flow regions is less than 0.3%. The prediction error of the shear layer and jet trailing edge increases, and the error is close to 4%. The RMSE and MAPE are 0.48% and 0.24%. To sum up, the high-precision CFD simulation of a high-speed jet flow field by the POD method can be utilized to construct the flow-field prediction agent model and optimize the ejector structure.
Figure 16. Prediction error of the velocity field.
4. Conclusions
In this paper, the POD and SPOD methods were introduced to decompose the jet flow field based on the numerical LES. Meanwhile, the POD-ROM of the complex flow in the ejector was established to analyze the transient characteristics and reconstruct the flow field. The following conclusions can be drawn.
The opposite rotating shear vortices are formed in the cylindrical shear layer, and the energy of the shear vortices dissipates gradually along the flow direction. The energy loss is mainly formed in the jet shear layer and shock-wave region owing to the influence of the shock wave and shear vortex. Furthermore, there is a self-excited oscillation phenomenon of shock wave at constant back-pressure, and the oscillation frequency is 1250 Hz.
The spatial distribution of the vorticity modes can reflect the evolutionary characteristics of the shear vortex. Furthermore, a correlation between the structural evolution of the density and pressure modes can be observed. The frequency of both the shock-wave oscillation and vortex shedding can be extracted by spectral analysis of the mode coefficients.
The high-precision CFD simulation of high-speed jet flow field by the POD method can be utilized to construct the flow-field prediction agent model and optimize the ejector structure. The RMSE for the velocity prediction is 0.48%.
Data analysis statement
The analysis of SPOD results in this paper refers to the open-source MATLAB® code (Mengaldo & Maulik, Citation2021; Schmidt & Colonius, Citation2020).
Disclosure statement
No potential conflict of interest was reported by the authors.
Additional information
Funding
References
- Abadía-Heredia, R., López-Martín, M., Carro, B., Arribas, J. I., Pérez, J. M., & Le Clainche, S. (2022). A predictive hybrid reduced order model based on proper orthogonal decomposition combined with deep learning architectures. Expert Systems with Applications. https://doi.org/10.1016/j.eswa.2021.115910
- Abbaszadeh, M., Dehghan, M., Khodadadian, A., & Heitzinger, C. (2020). Analysis and application of the interpolating element free Galerkin (IEFG) method to simulate the prevention of groundwater contamination with application in fluid flow. Journal of Computational and Applied Mathematics, 368, 112453. https://doi.org/10.1016/j.cam.2019.112453
- Abbaszadeh, M., Dehghan, M., Khodadadian, A., Noii, N., Heitzinger, C., & Wick, T. (2021). A reduced-order variational multiscale interpolating element free Galerkin technique based on proper orthogonal decomposition for solving Navier–Stokes equations coupled with a heat transfer equation: Nonstationary incompressible Boussinesq equations. Journal of Computational Physics, 426, 109875. https://doi.org/10.1016/j.jcp.2020.109875
- Alomar, A., Nicole, A., Sipp, D., Rialland, V., & Vuillot, F. (2020). Reduced-order model of a reacting, turbulent supersonic jet based on proper orthogonal decomposition. Theoretical and Computational Fluid Dynamics, (5). https://doi.org/10.1007/s00162-019-00513-y
- Bartosiewicz, Y., Aidoun, Z., Desevaux, P., & Mercadier, Y. (2005). Numerical and experimental investigations on supersonic ejectors. International Journal of Heat and Fluid Flow, 26(1), 56–70. https://doi.org/10.1016/j.ijheatfluidflow.2004.07.003
- Chen, J., Yi, S., Li, X., Han, G., & Yuan, X. (2021). Theoretical, numerical and experimental study of hypersonic boundary layer transition: Blunt circular cone. Applied Thermal Engineering, 194(2), 116931. https://doi.org/10.1016/j.applthermaleng.2021.116931
- Chunnanond, K., & Aphornratana, S. (2004).Ejectors: Applications in refrigeration technology. Renewable and Sustainable Energy Reviews, 8(2), 129–155. https://doi.org/10.1016/j.rser.2003.10.001
- Dehghan, M., & Abbaszadeh, M. (2016). Proper orthogonal decomposition variational multiscale element free galerkin (POD-VMEFG) meshless method for solving incompressible Navier-Stokes equation. Computer Methods in Applied Mechanics and Engineering, 311(Nov.1), 856–888. https://doi.org/10.1016/j.cma.2016.09.008
- Dehghan, M., Abbaszadeh, M., Khodadadian, A., & Heitzinger, C. (2019). Galerkin proper orthogonal decomposition-reduced order method (POD-ROM) for solving generalized Swift-Hohenberg equation. International Journal of Numerical Methods for Heat and Fluid Flow, 2019. ahead-of-print. doi.org/10.1108/HFF-11-2018-0647
- Dvorak, V., & Safarik, P. (2005). Transonic instability in entrance part of mixing chamber of high-speed ejector. Journal of Thermal Science, 14(3), 258–264. https://doi.org/10.1007/s11630-005-0011-5
- Gaitonde, D. V. (2015). Progress in shock wave/boundary layer interactions. Progress in Aerospace Sciences, 72, 80–99. https://doi.org/10.1016/j.paerosci.2014.09.002
- Granados-Ortiz, F. J., Leon-Prieto, L., & Ortega-Casanova, J. (2021). Computational study of the application of Al2O3 nanoparticles to forced convection of high-reynolds swirling jets for engineering cooling processes. Engineering Applications of Computational Fluid Mechanics, 15(1), 1–22. https://doi.org/10.1080/19942060.2020.1845805
- Guo, G. Q., Zhang, R. H., Chen, X. B., & Jiang, L. J. (2021). Analysis of transient gas-liquid two-phase flow in liquid ring pump based on POD modal decomposition. Journal of Engineering Thermophysics, 42(2), 349–356.
- Hassan, M. E. (2020). Numerical investigation of the flow dynamics inside supersonic fluid ejector. Arabian Journal for Science and Engineering, 45(2), 909–919. https://doi.org/10.1007/s13369-019-04179-w
- Holemans, T., Yang, Z., & Vanierschot, M. (2022). Efficient reduced order modeling of large data sets obtained from CFD simulations. Fluids, 7(3), 110. https://doi.org/10.3390/fluids7030110
- Huang, R., Li, Z., & Yang, J. (2019). Engineering prediction of fluctuating pressure over incident shock/turbulent boundary-layer interactions. AIAA Journal, 1–5. doi:10.2514/1.J057903
- Ikui, T., Matsuo, K., Nagai, M., & Honjo, M. (1974). Oscillation phenomena of pseudo-shock waves. Bulletin of JSME, 17(112), 1278–1285. https://doi.org/10.1299/jsme1958.17.1278
- Jahanbakhshi, R., & Madnia, C. K. (2016). Entrainment in a compressible turbulent shear layer. Journal of Fluid Mechanics, 797, 564–603. https://doi.org/10.1017/jfm.2016.296
- Jeyakumar, S., Kandasamy, J., Karaca, M., Karthik, K., & Sivakumar, R. (2021). Effect of hydrogen jets in supersonic mixing using strut injection schemes. International Journal of Hydrogen Energy, 46(44), 23013–23025. https://doi.org/10.1016/j.ijhydene.2021.04.123
- Jiang, L. J., Zhang, R. H., & Chen, X. B. (2021) Internal flow field in ejector of liquid ring pump and its matching characteristic with liquid-ring pump. Journal of Huazhong University of Science and Technology (Natural Science Edition), 49(4), 8–13. https://doi.org/10.13245/j.hust.210402
- Lario, A., Maulik, R., Schmidt, O. T., Rozza, G., & Mengaldo, G. (2021). Neural-network learning of SPOD latent dynamics. arXiv Preprint ArXiv, 2110, 09218. https://doi.org/10.48550/arXiv.2110.09218
- Li, X., Yang, Q., Chen, J., Huang, Z., & Tu, G. (2021). Effect of three-dimensional smooth humps on hypersonic boundary layer instability of streamwise vortices over a yawed cone. Physics of Fluids, 33(6), 064109. https://doi.org/10.1063/5.0054396
- Li, Y., & Deng, J. (2022). Numerical investigation on the performance of transcritical CO2 two-phase ejector with a novel non-equilibrium CFD model. Energy, 238, 121995. https://doi.org/10.1016/j.energy.2021.121995
- Li, Y. Q., Shen, S. Q., & Zhang, M. C. (2021). Near-wall treaments of non-equilibrium condensing RSM model of a supersonic steam ejector. Journal of Engineering the Rmophysics, 9, 2321–2325.
- Liang, Y., Zhai, Z. G., & Luo, X. S. (2018). Interaction of strong converging shock wave with SF6 gas bubble. Science China Physics, Mechanics & Astronomy, 61(6), 79–87. https://doi.org/10.1007/s11433-017-9151-6
- Liu, J., & Yang, Z. (2016). Numerical study on transonic shock oscillation suppression and buffet load alleviation for a supercritical airfoil using a microtab. Engineering Applications of Computational Fluid Mechanics, 10(1), 529–544. https://doi.org/10.1080/19942060.2016.1210029
- Liu, Q. L., & Lai, H. X. (2021). Comparison of five sub-grid-scale models based on prediction of coherent structures in plane turbulent jets. Chinese Journal of Theoretical and Applied Mechanics, 53(7), 1842–1855.
- Lopez-Martin, M., Sanchez-Esguevillas, A., Hernandez-Callejo, L., Arribas, J. I., & Carro, B. (2021). Novel data-driven models applied to short-term electric load forecasting. Applied Sciences, 11(12), 5708. https://doi.org/10.3390/app11125708
- Mengaldo, G., & Maulik, R. (2021). Pyspod: A python package for spectral proper orthogonal decomposition (SPOD). Journal of Open Source Software, 6(60), 2862. https://doi.org/10.21105/joss.02862
- Mitchell, D. M., Honnery, D. R., & Soria, J. (2012). The visualization of the acoustic feedback loop in impinging underexpanded supersonic jet flows using ultra-high frame rate schlieren. Journal of Visualization, 15(4), 333–341. https://doi.org/10.1007/s12650-012-0139-9
- Moreno, D., Krothapalli, A., Alkislar, M. B., & Lourenco, L. M. (2004). Low-dimensional model of a supersonic rectangular jet. Physical Review E, 69(2), 026304. https://doi.org/10.1103/PhysRevE.69.026304
- Nogueira, P. A., Cavalieri, A. V., Jordan, P., & Jaunet, V. (2019). Large-scale streaky structures in turbulent jets. Journal of Fluid Mechanics, 873, 211–237. https://doi.org/10.1017/jfm.2019.365
- Omidvar, A., Ghazikhani, M., & Razavi, S. (2016). Entropy analysis of a solar-driven variable geometry ejector using computational fluid dynamics. Energy Conversion and Management, 119, 435–443. https://doi.org/10.1016/j.enconman.2016.03.090
- Parvizi, M., Khodadadian, A., & Eslahchi, M. R. (2020). Analysis of ciarlet–raviart mixed finite element methods for solving damped Boussinesq equation. Journal of Computational and Applied Mathematics, 379, 112818. https://doi.org/10.1016/j.cam.2020.112818
- Phan, L. Q., Johnstone, A. D., Kosasih, B., & Renshaw, W. (2022). Patterns and reduced-order reconstruction of impinging wiping Jet pressure profile fluctuation using proper orthogonal decomposition. Journal of Fluids Engineering, 144(2), 021502. https://doi.org/10.1115/1.4051811
- Rana, Z. A., Thornber, B., & Drikakis, D. (2013). Dynamics of sonic Hydrogen Jet injection and mixing inside scramjet combustor. Engineering Applications of Computational Fluid Mechanics, 7(1), 13–39. https://doi.org/10.1080/19942060.2013.11015451
- Roth, J. (2021). Proper orthogonal decomposition for fluid mechanics problems. Leibniz Universitat Hannover.
- Schmidt, O. T., & Colonius, T. (2020). Guide to spectral proper orthogonal decomposition. AIAA Journal, 58(3), 1023–1033. https://doi.org/10.2514/1.J058809
- Shinneeb, A. M., Balachandar, R., & Bugg, J. D. (2008). Analysis of coherent structures in the far-field region of an axisymmetric free jet identified using particle image velocimetry and proper orthogonal decomposition. Journal of Fluids Engineering, 130(1), 151–163. https://doi.org/10.1115/1.2813137
- Sieber, M., Paschereit, C. O., & Oberleithner, K. (2016). Spectral proper orthogonal decomposition. Journal of Fluid Mechanics, 792, 798–828. https://doi.org/10.1017/jfm.2016.103
- Strušnik, D., & Avsec, J. (2022). Exergoeconomic machine-learning method of integrating a thermochemical Cu–Cl cycle in a multigeneration combined cycle gas turbine for hydrogen production. International Journal of Hydrogen Energy, 47(39), 17121–17149. https://doi.org/10.1016/j.ijhydene.2022.03.230
- Sun, F., Su, W. Y., Hou, Q., & Wang, M. Y. (2021). Modal decomposition and rapid prediction of shock train oscillation for inlet. Journal of Aerospace Power, (5), 1040–1051. doi:10.13224/j.cnki.jasp.2021.05.015
- Suvarnakuta, N., Pianthong, K., Sriveerakul, T., & Seehanam, W. (2020). Performance analysis of a two-stage ejector in an ejector refrigeration system using computational fluid dynamics. Engineering Applications of Computational Fluid Mechanics, 14(1), 669–682. https://doi.org/10.1080/19942060.2020.1756913
- Towne, A., Schmidt, O. T., & Colonius, T. (2018). Spectral proper orthogonal decomposition and its relationship to dynamic mode decomposition and resolvent analysis. Journal of Fluid Mechanics, 847, 821–867. https://doi.org/10.1017/jfm.2018.283
- Vanierschot, M., Müller, J. S., Sieber, M., Percin, M., van Oudheusden, B. W., & Oberleithner, K. (2020). Single- and double-helix vortex breakdown as two dominant global modes in turbulent swirling jet flow. Journal of Fluid Mechanics, 883. https://doi.org/10.1017/jfm.2019.872
- Wang, C. P., & Zhang, K. Y. (2010). Shock train oscillation and wall pressure fluctuation in internal flow. Journal of Experiments in Fluid Mechanics, 24(5), 57–62.https://doi.org/10.3969/j.issn.1672-9897.2010.05.012
- Wang, H., Zhai, Z., Luo, X., Yang, J., & Lu, X. (2017). A specially curved wedge for eliminating wedge angle effect in unsteady shock reflection. Physics of Fluids, 29(8), 086103. https://doi.org/10.1063/1.4999349
- Wang, X., Chen, Y., Li, M., Xu, Y., & Dang, X. (2020). Numerical investigation of the cavitation performance of annular jet pumps with different profiles of suction chamber and throat inlet. Engineering Applications of Computational Fluid Mechanics, 14(1), 1416–1428. https://doi.org/10.1080/19942060.2020.1824875
- Wang, X., Li, H., Ning, J., Zhang, P., Huang, H., & Tu, J. (2021). Numerical investigation of the nozzle expansion state and its effect on the performance of the steam ejector based on ideal gas model. Applied Thermal Engineering, 199, 117509.https://doi.org/10.1016/j.applthermaleng.2021.117509
- Xiao, S., Ge, Z., Ren, Q., Liu, J., & Wang, H. (2020). Numerical analysis on the flow field structure and deflection characteristics of water jets under nozzle moving conditions. Engineering Applications of Computational Fluid Mechanics, 14(1), 1279–1301. https://doi.org/10.1080/19942060.2020.1822210
- Ye, Z. X., Fang Y. Q., Zou, J. F., Wang, G. F., Shi, Y., & Zheng, Y. (2021). Synthetic jet actuator PIV experiments and modal analysis. Journal of Propulsion Technology, (2), 258–271. doi:10.13675/j.cnki.tjjs.190681
- Zhang, C., Yu, W., & Wang, B. S. (2021). Flow field characteristics of underwater supersonic over-expanded gas jet. Journal of Aerospace Power, 1–11. https://doi.org/10.13224/j.cnki.jasp.20210370
- Zhang, Q. S. (2015) PIV measurements of unsteady characteristics of separated and reattaching flow on finite blunt plate. (Doctoral dissertation, Shanghai Jiao Tong University). https://kns.cnki.net/KCMS/detail/detail.aspx?dbname=CDFDLAST2017&filename=1016787672.nh
- Zhang, R., Chen, X., & Luo, J. (2021). Knowledge mining of low specific speed centrifugal pump impeller based on proper orthogonal decomposition method. Journal of Thermal Science, 30(3), 9. https://doi.org/10.1007/s11630-020-1356-5
- Zhang, R. C., Bai, N. J., Fan, W. J., Huang, X. Y., & Fan, X. Q. (2019). Influence of flame stabilization and fuel injection modes on the flow and combustion characteristics of gas turbine combustor with cavity. Energy, 189, 116216. https://doi.org/10.1016/j.energy.2019.116216
- Zhang, R. H., Chen, X. B., Guo, G. Q., & Li, R. N. (2018). Reconstruction and modal analysis for flow field of Low specific speed centrifugal pump impeller. Transactions of the Chinese Society for Agricultural Machinery, 49(12), 143–149. https://doi.org/10.6041/j.issn.1000-1298.2018.12.018