
 ?Mathematical formulae have been encoded as MathML and are displayed in this HTML version using MathJax in order to improve their display. Uncheck the box to turn MathJax off. This feature requires Javascript. Click on a formula to zoom.
Abstract
How to accurately predict the resonance operating point and the corresponding vibrating amplitude of the underwater structures are of interest in the field of hydraulic machinery. In the present investigation, a resonance risk assessment method consisting of unsteady CFD, modal work approach, and harmonic response analysis is established, and an implementation is carried out on a centrifugal impeller of a storage pump. The simulation results (head, efficiency, and pressure pulsation) are carefully verified by comparing them with the experimental results, with relative deviations within 11%. Regarding the prototype pump, the amplitude of the pressure pulsation coefficient is almost identical to the model pump, with a relative deviation of 13.5%. It is found that the hydrodynamic damping ratio is gradually decreased if the operating flow rate deviates from the design one, based on the modal work approach. And then, the harmonic response is carried out on the prototype impeller, by setting the pressure pulsation as the initial excitation condition and considering the hydrodynamic damping ratio. Finally, the natural frequency, the resonance amplitude, and maximum equivalent stress are quantitatively determined, which proves that the resonance risk assessment method has the potential to judge the resonance operating point and destructiveness in practical engineering.
1. Introduction
Renewable energy (e.g. hydropower, ocean power, solar power, wind power, etc.) has been developed rapidly worldwide, to cope with global climate change. Up to 2021, renewables generated an estimated 29% of global electricity (REN21, Citation2021). The pumped hydroelectric energy storage (PHES) system is an important guarantee for integrating renewable energy into power grids (Bermúdez et al., Citation2017; Kong et al., Citation2017). Currently, the installed capacity of PHES has a rapid growth trend (Kong et al., Citation2017). Moreover, the demand for variable speed units is increasing, to satisfy the end user's real-time regulation capacity requirements (Schmidt et al., Citation2017). This will inevitably lead to the storage pump operating in off-design conditions (Liu et al., Citation2016; Wang et al., Citation2021). Especially, there is even a resonance risk of the impeller, due to the wide range of hydraulic excitation frequency, if the impeller suffers from some transient events (such as form start-stops and frequent changes of operating conditions) (Liu et al., Citation2016; Tanaka, Citation2011; Zhao et al., Citation2021). Accurate calculations of the vibration amplitude and the dynamic stress at the resonance condition are essential for the safe and reliable operation of hydraulic machines.
Damping (usually consists of hydrodynamic damping, structural damping, and material damping) is a key parameter that affects the vibration amplitude at the resonance condition, its essence is the energy dissipation of the vibrating system (Crandall, Citation1970; Trivedi, Citation2017). When the impeller was rotating, the internal flow velocity can be as high as 30–40 m/s (Trivedi, Citation2017). And hydrodynamic damping had the potential to dominate other dampings by an order of amplitude (Trivedi, Citation2017). The methods to obtain hydrodynamic damping mainly included experiments and numerical simulation. Regarding experiment investigations, it was usually for some simple structures like hydrofoils and plates, and most structures were fixed in a non-rotating environment (Bergan et al., Citation2018; Roth et al., Citation2009; Seeley et al., Citation2012; Yao et al., Citation2014). However, for the internal flow environment of storage pumps with high-pressure and high-flow velocity, the current experimental technology was difficult to obtain hydrodynamic damping due to the lack of reliable measurement equipment for vibration signals. The commonly used simulation methods included the unsteady vortex lattice method (UVLM) (Kohtanen & Davis, Citation2019), the two-way fluid-structure interaction (FSI) method (Zeng et al., Citation2019), and the modal work approach (Gauthier et al., Citation2017). UVLM was based on the potential flow theory and does not consider the fluid viscosity, so it had higher simulation efficiency than other methods, but the calculation error was greater (in the case of a plate, the error can reach about 58%) (Kohtanen & Davis, Citation2019). The two-way FSI method considered the interaction between the flow field and the structural field, and the calculation results had higher accuracy in theory but require more computing resources (Zeng et al., Citation2019). This method was mainly applied to the mechanism study of some simple structures, such as hydrofoils (Liaghat et al., Citation2014; Zeng et al., Citation2019), while it was currently not suitable for the calculation of hydrodynamic damping of storage pumps due to the complex geometry. The modal work approach takes into account both simulation accuracy and efficiency. Specifically, in the case of hydrofoils, the reliability of this method had been verified, with a relative error of about 10% (Bergan et al., Citation2018; Gauthier et al., Citation2017). Moreover, the calculation time of the modal work approach was only about 1/6 compared with the two-way FSI method (Zeng et al., Citation2019; Zeng et al., Citation2021a). Therefore, it was considered that the modal work approach was the most suitable for the study of the hydrodynamic damping characteristics of a storage pump.
How to precisely predict the operation point of resonance and the vibration amplitudes of the impeller was of interest in the field of hydraulic machinery. At present, the hydraulic excitation frequency and natural frequency of underwater structures can be obtained by unsteady CFD and coupled acoustic-structural simulation, respectively (Tengs, Citation2019a). And then, the operation point of resonance can be determined, based on a resonance check. As for the calculation of resonance amplitude, the one-way FSI method and harmonic response analysis were widely used (He et al., Citation2014; Tengs, Citation2019a; Tengs et al., Citation2019b). For example, during the start-up process, the dynamic stress at different rotational speeds was predicted by He et al. (Citation2014) based on a one-way FSI simulation. And the maximum dynamic stress and vibration amplitude were obtained, at the resonance condition. As compared with the one-way FSI simulation method, the harmonic response analysis had higher calculation efficiency because no real-time signal transmission is needed between the flow field and structure field. It had become an important structural strength check method in the design stage, by importing the hydraulic excitation signal as the initial condition (Liang et al., Citation2012). However, due to an insufficient understanding of hydrodynamic damping, the current structural design can only consider the empirical value of hydrodynamic damping, or even ignore hydrodynamic damping (He et al., Citation2014). In theory, this will lead to the inaccurate prediction of the resonance amplitude. As a result, the structural strength check in the design stage had a limited contribution to the actual project. Therefore, it is necessary to develop a resonance assessment method that takes into account hydrodynamic damping, to improve the prediction accuracy of resonance amplitude.
The present research is devoted to developing a method to quantitatively assess the resonance risk of the impeller of a storage pump. The specific aims are to achieve the following two sub-objectives: (1) To quantitatively analyze the hydrodynamic damping characteristic of an impeller at design and off-design conditions. (2) To develop a resonance prediction method by considering the hydrodynamic damping ratio, based on the harmonic response analysis approach.
2. Numerical simulation methods
The simulation works in the present investigation include three steps: (1) The unsteady CFD is used to simulate the internal flow dynamics of a pump. (2) The modal work approach is used to determine the hydrodynamic damping characteristics of the impeller. (3) A harmonic response analysis is used to analyze the resonance risk.
2.1. Unsteady CFD
The rotation-curvature correction was applied to the shear stress transport (SST) k-ω model, to improve the prediction accuracy of the turbulence model by considering the rotation-curvature effects. And then the rotation-curvature corrected SST k-ω (SST CC) model was formed (Smirnov & Menter, Citation2009; Tao et al., Citation2018), to close the governing equations (Navier Stokes equations) of the flow field. In particular, the improvement of the SST CC model was reflected in the turbulent kinetic energy production term, as follows (Smirnov & Menter, Citation2009):
(1)
(1)
(2)
(2)
(3)
(3)
(4)
(4)
(5)
(5)
(6)
(6)
(7)
(7) where
and
is the turbulent kinetic energy production term of the SST k-ω model and SST CC model, respectively;
is the rotation correction term;
is the empirical correction coefficient,
is the strain rate,
is the rotation rate,
is the rotation rate of the reference frame;
,
and
are the constant coefficients;
is the turbulence eddy frequency.
is defined as the maximum of the strain rate squared and the turbulence eddy frequency squared, and a is the square root of
.
2.2. Modal work approach
The modal work approach essentially calculated the energy dissipation of the vibration system in a vibrating cycle and then calculated the hydrodynamic damping. If the mode shape of the structure was imported into the unsteady CFD, and periodic vibration was performed according to the natural frequency. The modal work (or energy dissipation) of the vibrating structure was as follows (Gauthier et al., Citation2017; Zeng et al., Citation2021a):
(8)
(8)
(9)
(9) where N is the number of vibrating cycles;
is the fluid added modal force;
is the angular natural frequency of vibrating structure in water; S is the surface area;
is the direction vector; p is the pressure;
is the wall shear stress vector.
is the vibration velocity of the underwater structure.
And then, the hydrodynamic damping ratio can be calculated (Gauthier et al., Citation2017):
(10)
(10) where
and
is the structural modal mass and fluid added mass, respectively;
is the amplitude of mode shape.
The mode shape and unknown parameters (,
and
) can be determined by the modal analysis approach, based on the finite element method. The surrounding water was simplified as the acoustic elements, and the governing equations of the modal analysis approach can see in Liang et al. (Citation2007).
2.3. Harmonic response analysis
If the excitation frequency was close to the natural frequency of the underwater structure, the structure response will be amplified compared with the static load amplitude (Tengs et al., Citation2019b), as follows:
(11)
(11)
(12)
(12) where
and
are the dynamic and static load amplitude, respectively;
is the dynamic amplification factor;
and
are the natural and excitation frequency, respectively.
is the total damping ratio.
Assuming that the total damping ratio is a superposition of different types of damping, it can be expressed as:
(13)
(13) where
is the structural damping ratio. It should be noted that the hydrodynamic damping ratio, the focus of this study, is only contributed by the surrounding fluid.
The harmonic response analysis is conducted by using ANSYS Workbench. And the hydrodynamic damping ratio is imported as the initial condition, according to the Rayleigh damping matrix, as follows (Liu & Gorman, Citation1995):
(14)
(14)
(15)
(15) where [C], [M], and [K] are the damping, mass, and stiffness matrix, respectively.
and
are the constants of proportionality.
In many practical structural vibration problems, the mass proportional term () may be ignored, since its contribution was much smaller than the stiffness proportional term (
) (ANSYS Inc, Citation2012). In such cases, the
can be evaluated from the known values
and
.
2.4. Parameters definition of a storage pump unit
To verify the reliability of the simulation results, we designed a model experiment to obtain the quantitative energy performance (head and efficiency) and pressure pulsation of a storage pump. A detailed description of the experiments can be found in our previously published article (Zeng et al., Citation2021b). After the model experiment, the flow rate, head, and efficiency are converted into the corresponding values of the prototype pump, and the equations were as follows (IEC Standards 60193, Citation1999):
(16)
(16)
(17)
(17)
(18)
(18) where Q is the flow rate, H is the head, n is the rotation speed,
is the hydraulic efficiency. The subscribe p and m represent the prototype and model pump, respectively. Δη is the incremental value of efficiency when converting from model to prototype.
Both the model and prototype pumps have the same specific speed, which is defined as follows:
(19)
(19) where
= 55 is the specific speed, and the subscribe d represents the designed condition.
As for the pressure pulsation, a pressure coefficient is defined (Zeng et al., Citation2021b):
(20)
(20) where
is the unsteady pressure,
is the time-averaged pressure,
is the circumferential velocity at the impeller discharge, and ρ is the density of the fluid.
The peak-to-peak value of the pressure coefficient is used to describe the statistical level of the pressure pulsation, based on a 97% confidence region, as follows (Zeng et al., Citation2021b):
(21)
(21) where
and
are the maximum and minimum pressure coefficients, respectively.
3. Calculation setup and validations
3.1. Physical model
The physical model is shown in Figure . The fluid domain consists of the inlet chamber, impeller, guide vane, volute casing, and outlet pipe, as shown in Figure (a). As for the structure domain, a centrifugal impeller with both hub and shroud is shown in Figure (b). The side gap between the rotating impeller and the side chamber is 3 mm. Fluid fills the gap and is considered in the harmonic response analysis. The material of the impeller is stainless steel, with a density of 7700 kg/m3, Young's modulus of 215 GPa, and Poisson's ratio of 0.3.
Figure 1. Physical model (a) Fluid domain (b) Structure domain.
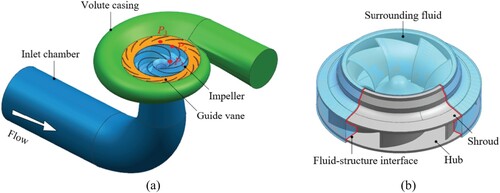
Regarding geometry and hydraulic parameters, the specific values for model and prototype pumps are shown in Table . In addition, the blade numbers of the impeller and guide vane are 7 and 15, respectively. As for the impeller, the wrap angles at the hub and shroud are 115° and 120°, respectively. The inlet angles at the hub and shroud are 20° and 19°, respectively. While both the outlet angles at the hub and shroud are 19°.
Table 1. Main geometry and designed hydraulic parameters.
3.2. Calculation schemes and boundary conditions
The calculation schemes and purposes of the resonance risk assessment method are shown in Table . In particular, it consists of unsteady CFD, modal work approach, and harmonic response analysis.
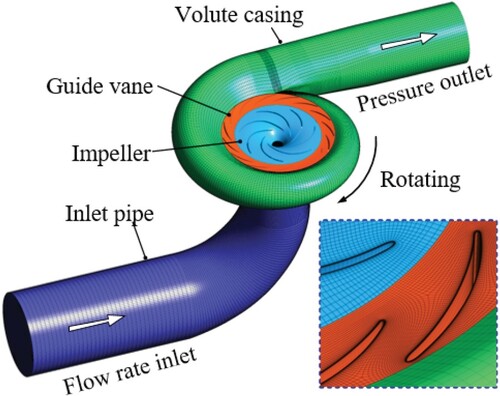
The unsteady CFD is used to obtain the hydraulic excitation characteristics (the frequency and corresponding amplitude of the pressure pulsation). For the boundary condition, the mass flow rate inlet is employed and the pressure outlet (atmospheric pressure) is adopted. The interfaces between the rotating impeller and stationary parts are set as transient rotor-stator. The no-slip wall condition is used for other surfaces, and the roughness of the wall is not taken into consideration. For the solution of the governing equations, the second-order backward Euler scheme, the second-order upwind scheme, and the central difference scheme are used for the discretization of the transient term, the convective term, and the diffusion term, respectively. Three monitoring points at the leading edge of the impeller (P1), the trailing edge of the impeller (P2), and the vaneless region between the impeller and guide vane (P3) are adopted to record the pressure pulsation, as shown in Figure (a).
The modal work approach is used to determine the hydrodynamic damping ratio. The mode shape and corresponding natural frequency obtained by modal analysis are set as the initial files of unsteady CFD. And the dynamic mesh technology is adopted to simulate the energy dissipation over one vibrating cycle. The other calculation settings are the same as the unsteady CFD.
Harmonic response analysis is used to calculate the vibration amplitude and equivalent stress distribution at the resonance condition. In this step, only the impeller and surrounding fluid are considered. The acoustic element is coupled with the harmonic response analysis, to consider the influence of added mass on the vibration characteristic. The hydraulic excitation obtained by unsteady CFD and the hydrodynamic damping ratio obtained by the modal work approach are set as initial files. In particular, the hydraulic excitation is applied to the impeller in the form of a sweep signal, with ranges of 0.8–1.2 times of natural frequency.
Table 2. Calculation contents and purposes of resonance risk assessment method
The unsteady CFD and the modal work approach are carried out on both model and prototype impellers. While the harmonic response analysis is only carried out on the prototype impeller because only the resonance assessment of the prototype is instructive for practical engineering. The selected flow rates range from 0.9-1.4 Qd and cover the working conditions where the pump has high efficiency.
3.3. Calculation parameters verification
3.3.1. Mesh convergence analysis
A mesh convergence method (A detailed description of this method can be found in Celik et al., Citation2008) is conducted, to quantitatively estimate the discretization error. The schematic of the mesh is shown in Figure , the structured grids are adopted to discretize all the calculation domains. Three meshing schemes, grid1, grid2, and grid3, are proportionally determined and the elements are 6.04, 2.49, and 1.12 million, respectively. The grid refinement factors, r21 and r32, are 1.34 and 1.31, respectively. The head (H), efficiency (η), and peak-to-peak value of pressure pulsation () of the model pump are taken as the key variables to carry out mesh convergence analysis, at the flow rate of 1.2Qd.
Figure 2. Mesh of the calculation domain.
The evaluation results of discretization errors are shown in Table . Including the calculation value of ith grid ( to
), the extrapolated value (
) that is calculated by the Richardson extrapolation method (Celik et al., Citation2008), the accuracy order (R), the extrapolated relative error (
), and the grid convergence index (
). When grid1 is selected, the extrapolated relative error and grid convergence index are within 1.93% and 2.46%, respectively. It indicates that the numerical uncertainty of grid1 for the calculations of the head, efficiency, and pressure pulsation is within 2.46%. Therefore, the meshing scheme of grid1 can meet the grid convergence requirements.
Table 3. Evaluation results of the discretization error.
3.3.2. Time step analysis
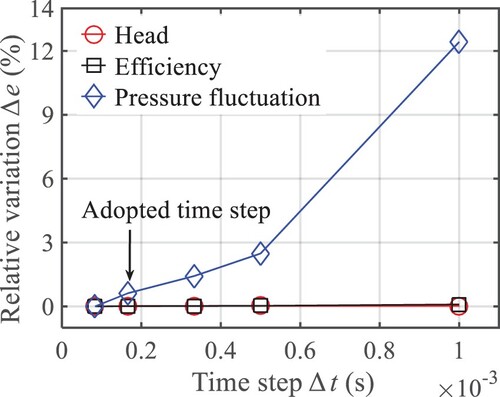
The head, efficiency, and peak-to-peak value of pressure pulsation of the model pump are also taken as the key variables to conduct time step analysis, as shown in Figure . The results show that the time step has almost no effect on the head and efficiency. Indicating that these parameters can be calculated by the steady state, to reduce the calculation time in actual engineering. While the peak-to-peak value of pressure pulsation is sensitive to the time step. In particular, when the time step is reduced from 1 × 10⁻³ to 1 × 10⁻⁴, the relative variation of can reach 12.3%. When the time step is less than 1.67 × 10⁻⁴, the relative variation of
is within 1%. In this investigation, the time step of 1.67 × 10⁻⁴ is adopted (the impeller rotates one degree per time step).
Figure 3. Time step analysis.
3.4. Numerical results verification
3.4.1. Energy performance
The comparison of energy performance between the experiment (Zeng et al., Citation2021b) and simulation results are shown in Figure , for both model and prototype pumps. The experimental and simulation results are represented by ‘Exp’ and ‘Sim’ in Figure , respectively. As for the head, the simulation results almost coincide with the experimental results, with relative deviations within 1.67%. Regarding efficiency, the optimal operating points obtained by simulation and experiment are not consistent. In particular, the optimal operating point obtained by simulation is at the design flow rate, while it obtained by the experiment is at about 1.1 times the design one. And therefore, it causes a relatively large efficiency error at the design flow rate. But the calculation accuracy is still acceptable in engineering, because the deviations between experiment and simulation are within 5%, under different flow rates. Indeed, the phenomenon that the optimal operating point deviates from the design flow rate was also observed in previously published experimental works (Chen et al., Citation2021; Zhao et al., Citation2022). And according to the work of Chen et al. (Citation2021), the efficiency characteristic of a centrifugal impeller was proven to be sensitive to the change in the inlet blade angle. Therefore, for the present investigation, the movement of the experimental optimal operating point to a larger flow rate may also be explained by the slight changes in the blade inlet angle, due to some imperfections in the process of impeller manufacturing. For the model pump and the prototype pump, the numerical efficiencies are 0.82-4.03% and 2.18-4.12% higher than the experimental results, respectively. It can be interpreted as the neglect of friction loss, volume leakage loss, and hydraulic loss in numerical calculation.
Figure 4. Comparison of energy performance, experiment vs. simulation (a) Head (b) Efficiency.
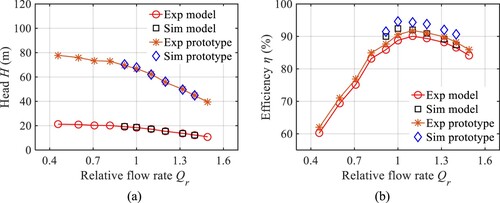
In addition, the energy performances of the model and prototype pump are also compared. The head obtained by the model pump and the prototype pump is quite different, because both the rotational speed and impeller size are different. As for efficiency, the value of the prototype pump is 2.21% higher than that of the model pump, at the optimal operating point.
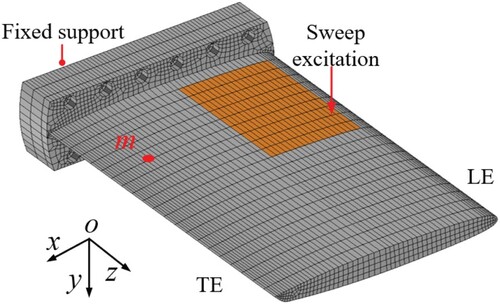
3.4.2. Resonance calculation in the case of hydrofoil
Regarding the resonance risk assessment method proposed in the present investigation, includes three parts: unsteady CFD, modal work approach, and harmonic response analysis. The first two steps have been extensively validated, but the reliability of harmonic response analysis by considering the hydrodynamic damping ratio is unclear. Therefore, an example of a hydrofoil is designed, to validate the accuracy of harmonic response analysis on the calculation of resonance amplitude. The calculation settings are shown in Figure . The hydrofoil featured a NACA0009 section profile, which is fixed on one side and free on the other side. A sweep excitation is applied on the hydrofoil near the leading edge, and a measuring point (m) near the trailing edge is adopted to obtain displacement. The locations of excitation and measurement are approximately consistent with those of the comparative experiments (Yao et al., Citation2014). Regarding the hydrodynamic damping ratio of the first bending mode, it obtained by the modal work approach and experiment (Yao et al., Citation2014) is 0.0481 and 0.0514, respectively, at the velocity of 7.03 m/s. The relative deviation is only 6.42% and verifies the reliability of the modal work approach.
Figure 5. Calculation set up for the harmonic response analysis of a hydrofoil.
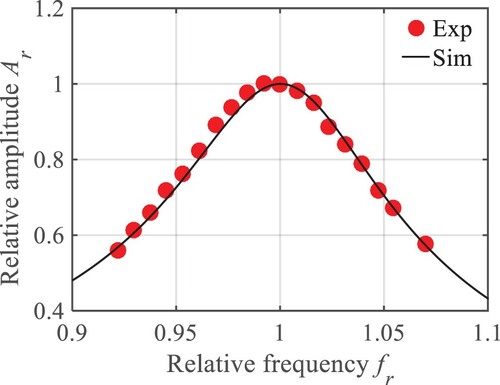
As for the harmonic response analysis, the hydrodynamic damping ratio is imported as the initial condition, in the form of the Rayleigh damping matrix. And then, the vibration amplitudes at different excitation frequencies are calculated, as shown in Figure . The excitation frequency is normalized by the natural frequency of the first bending mode, and the vibration amplitude is normalized by the displacement of the resonance condition. For the investigated mode, the natural frequencies obtained by simulation and experiment (Yao et al., Citation2014) are 134 and 127 Hz, respectively, with a relative deviation of 5.51%. For the resonance characteristics, both the vibration amplitudes obtained by simulation and experiment increase significantly when the excitation frequency is close to the natural frequency. And the relative amplitudes calculated by simulation are in good agreement with the experimental results. Which verifies the reliability of the harmonic response analysis in the prediction of resonance amplitude by considering the hydrodynamic damping ratio.
Figure 6. Comparison of resonance characteristics of a hydrofoil, experiment vs. simulation.
4. Vibration characteristics of the model and prototype impellers
4.1. Hydraulic excitation characteristics
4.1.1. Simulation of the rotational frequency
The time evolution of pressure pulsation during one rotation revolution is shown in Figure (a), at the vaneless region (P3) for the model pump, with a flow rate of 1.05Qd. The experimental results of the pressure pulsations come from previously published work of Zeng et al. (Citation2021b). Under the action of rotor-stator interaction (RSI) between the rotating impeller and stationary guide vane, there are 7 (blade number of the impeller) distinct peaks and valleys of pressure pulsation s in one rotation revolution.
Figure 7. Pressure pulsation characteristic, model pump, Q = 1.05Qd, at the location of P3 (a) Time evolution of pressure pulsation (b) Validation of the eccentricity distance of the pump shaft (c) Frequency domain of the pressure pulsation.
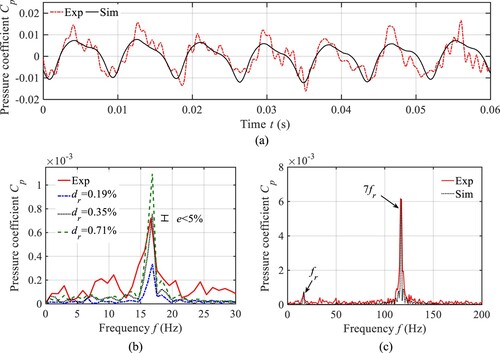
The experimentally measured pressure pulsation has a rotational frequency component, due to installation or processing flaws, as shown in Figure (b). To simulate the rotation frequency and the corresponding amplitude, the impeller is eccentric by a certain distance. A relative eccentricity distance normalized by the shaft diameter of the pump is defined (i.e. dr = d/Da, where d is the eccentricity distance of the pump shaft and Da is the diameter of the pump shaft.). In the present investigation, the dr adjusts from 0.19% to 0.71%. Regarding the amplitude of pressure pulsation with rotation frequency, the relative deviation between simulation and experimental results is within 5%, with dr = 0.35%. And this relative eccentricity distance of the impeller is adopted in the subsequent simulations.
In the case of the impeller blade passage frequency (7fr) of the pressure pulsation, the comparison of the simulation and experimental results is shown in Figure (c). The frequencies are almost the same, and the relative deviation of the amplitude is within 2%.
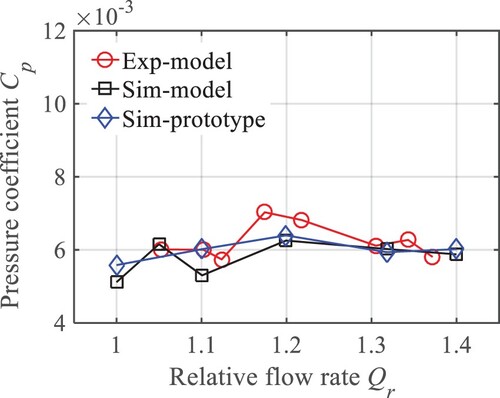
4.1.2. Influence of similarity conversion on the pressure pulsation
The similarity conversion presents the switching between the model and prototype pump. Regarding the pressure pulsation, the amplitudes at impeller blade passage frequency (7fr) are shown in Figure , for both model and prototype pumps. The simulation flow rates range from Qd to 1.4 Qd, and the monitoring location is in the vaneless region (P3). For the model pump, the relative deviations of simulation and experimental results are within 11%. By comparing the pressure pulsation s obtained by the model and prototype pumps, the relative deviations are between 1.45% and 13.5%. This indicates that the pressure pulsation level of a prototype pump can be roughly judged through the model experiment.
Figure 8. Amplitudes of pressure pulsation at blade passage frequency, under different flow rates.
4.1.3. Pressure pulsation characteristics inside the impeller
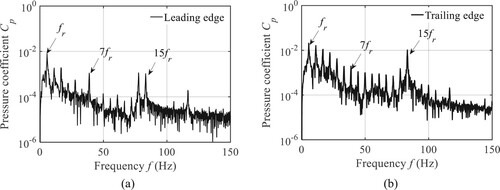
The frequency domains of pressure pulsation at the leading and trailing edges of the prototype pump are shown in Figure , at the flow rate of 1.1 Qd. The frequency components at leading and trailing edges are the same, including rotation frequency (fr), impeller blade passage frequency (7fr), guide vane blade passage frequency (15fr), and their harmonic frequencies. While the amplitudes of pressure pulsation at the trailing edge are greater than the corresponding values at the leading edge. It means that the flow at the discharge side of the impeller is more unstable. As the frequency increases, the amplitudes of harmonic frequency gradually decrease. And this indicates that hydraulic excitation with low frequency should be paid more attention to because it is easier to result in exceeding vibration level.
Figure 9. Pressure pulsation characteristic around the impeller (a) At leading edge (P1) (b) At trailing edge (P2).
4.2. Structural vibration characteristics
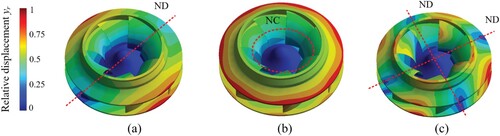
The mode shapes of the impeller for the first three modes are shown in Figure . The first and third modes contain one and two lines of zero displacements that cross the entire impeller, respectively, as shown in Figure (a) and (c). The line of zero displacements is named nodal diameter (ND). And first and third modes are the typical 1ND and 2ND modes, respectively. Regarding the second mode, there is a nodal cycle (NC) with zero displacements in the impeller, and it is the typical 1NC mode. The mode shapes for the model and prototype are the same because the structural shapes and fixed methods are consistent.
Figure 10. Mode shapes of the impeller for the low-order modes (a) First mode (b) Second mode (c) Third mode.
The natural frequencies of both the model and prototype impellers are shown in Table , all the results are obtained by the numerical simulation (modal analysis approach). For different mode shapes, the corresponding natural frequencies of the model impeller are significantly greater than those of the prototype.
Table 4. Natural frequencies of the impeller with typical modes, in Hz.
Though the infinite modes exist theoretically, only some low-order modes are interesting from the engineering point of view, because these are more prone to be excited (Egusquiza et al., Citation2009). Therefore, the 1ND mode is selected as the typical mode to carry out the resonance assessment, in the subsequent sections.
Table 5. Resonance check of the prototype impeller for the 1ND mode shape.
4.3. Hydrodynamic damping characteristics
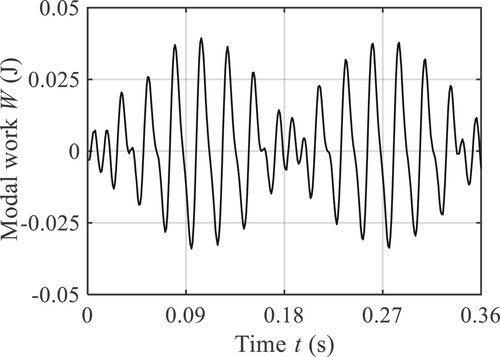
The hydrodynamic damping ratio is calculated, based on the averaged modal work of 10 rotation cycles of the impeller, to reduce the impact of the finite calculation cycles on the calculation accuracy. The time evolution of modal work that covers two rotation cycles is shown in Figure , at the design flow rate, for the prototype pump. The transient modal work is varied with time, and the behavior fitted the compound sine function. The amplitude of the modal work does not change with time, indicating that the numerical calculation is stable.
Figure 11. Time evolution of modal work, in the case of prototype impeller, Q = Qd.
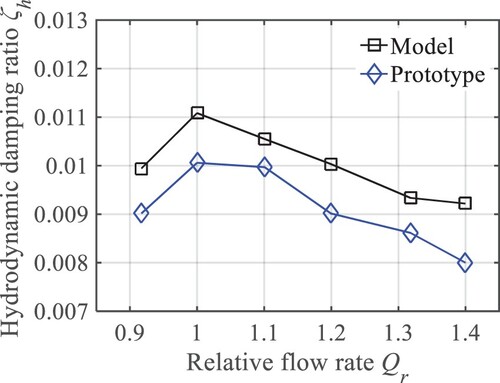
The hydrodynamic damping ratios at different flow rates are shown in Figure , for both model and prototype pumps. There are differences in the hydrodynamic damping ratio for the model and prototype, and it indicates that the hydrodynamic damping does not satisfy the similarity conversion criterion with a scale of 1. In particular, the hydrodynamic damping ratio for the prototype is slightly smaller than that of the model type, this may be due to the decrease in the vibration velocity and the increase in the structural modal mass when converting from model to prototype. In addition, although the impeller with the model and prototype satisfies the similarity law, the impeller rotational speed of the prototype (333.3 rpm) is significantly smaller than that of the model (1000 rpm). This may also result in a reduction in the hydrodynamic damping ratio of the prototype impeller. Comparing the prototype impeller with the model impeller, the behaviors that the hydrodynamic damping ratio varies with flow rate are the same. In particular, it is found that the hydrodynamic damping ratio is the largest at the design flow rate, while it gradually decreases as the flow rate deviates from the design one. The reduction can reach 20% if the flow rate increases from 1.0 Qd to 1.4 Qd. This implies that the vibration level will be more damaging if the resonance occurs under off-design conditions.
Figure 12. Hydrodynamic damping characteristics of the 1ND mode, at different flow rates.
As for the universal relationship between hydrodynamic damping ratio and flow rate, it may be explained as the flow characteristics in the impeller channel. Because there is an attack angle that occurs at the leading edge of the impeller blade under off-design conditions, the flow separation at the blade surfaces should disrupt boundary layers and reduce the overall shear stress on the impeller. Which in turn reduces energy dissipation in the vibrating system, and then reduces the hydrodynamic damping ratio. The more detailed flow mechanism of the relationship between hydrodynamic damping and flow rate will be discussed in our future work.
5. Implementation of the resonance risk assessment method
5.1. Resonance condition check
The resonance condition check is carried out by comparing the excitation frequencies and natural frequencies of the impeller. In the case of the 1ND mode shape of the prototype impeller, the natural frequency is very close to one of the excitation frequencies of pressure pulsation (7 fr = 38.82 Hz), only with a relative deviation of 0.84%, as shown in Table . Theoretically, the vibration level of 1ND will be amplified due to pressure pulsation at 7 fr. In addition, the excitation amplitude at this frequency is also considerable. In particular, at the design flow rate, the amplitudes of 7 fr at the leading and trailing edges are 847.7 and 1464 Pa, respectively.
5.2. Determination of vibration amplitude and equivalent stress
The resonance characteristic is calculated by harmonic analysis by considering the acoustic element, with excitation frequency sweeps from 0.8-1.2 times of natural frequency, as shown in Figure . The monitoring point is located at the position where the impeller has the maximum displacement. The excitation amplitudes of pressure pulsation (7 fr) at leading and trailing edges are set as the initial conditions. The damping ratio is imported in the form of a Rayleigh damping matrix, and two schemes are adopted to calculate the resonance amplitude (vibration amplitude at resonance condition).
Figure 13. Resonance characteristics of a prototype impeller, Q = Qd (a) Maximum displacements at different excitation frequencies (b) Distribution of equivalent stress.
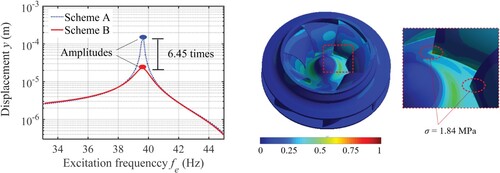
Scheme A: only structural damping (the value is 0.002 according to Seeley et al., 2012) is considered.
Scheme B: hydrodynamic damping is also considered, in addition to structural damping, and total damping is the superposition of structural damping and hydrodynamic damping.
As the excitation frequency closes to the natural frequency, the displacement of the impeller significantly increases for both schemes A and B, as shown in Figure (a). While the resonance amplitude of scheme A greater than that of scheme B. In particular, the overestimation of the resonance amplitude can be up to 6.51 times, if the hydrodynamic damping ratio is not considered. In the present investigation, the equivalent stress is adopted as a key indicator to assess the resonance risk for an impeller. At the resonance condition, the distribution of equivalent stress is shown in Figure (b). The maximum equivalent stress occurs at the junction of the leading edge of the blade and the hub of the impeller, and the value can reach 1.84 MPa for scheme B, at the design flow rate. Regarding Scheme A, the vulnerable position is the same, while the equivalent stress is overestimated by 3.09 times. Therefore, it can lead to an overly conservative design, if the hydrodynamic damping characteristic is not considered.
5.3. Discussion of the resonance risk assessment method
5.3.1. Evaluation of the calculation time
The calculation time of resonance analysis in the design stage is one of the key concerns in the field of hydraulic machinery. At the design flow rate, the record calculation times for the resonance analysis of an impeller are shown in Table , with 64 cores. The total calculation time is about 184.5 h. In particular, 59 h are used for the unsteady CFD, to extract the reliable hydraulic excitation after the amplitude of the pressure pulsation does not change with time. Regarding the modal work approach, the calculation time is 10 rotation cycles of the impeller (119 h). This duration is about 72 vibrating cycles of the impeller for the 1ND mode, in the present investigation. For the harmonic response analysis, the calculation time only needs 6.5 h.
Table 6. calculation times of the resonance analysis.
In addition to harmonic response analysis, the two-way and one-way FSI methods also have the potential to carry out resonance analysis. Regarding the two-way FSI method, there is no need to additionally import the hydrodynamic damping ratio in the form of a Rayleigh damping matrix. Because the hydrodynamic damping is simultaneously determined when the data of the flow field and the structural field are transferred to each other (Liaghat et al., Citation2014; Zeng et al., Citation2019). However, the two-way FSI method is rarely applied in practical engineering, because it involves a large demand for calculation resources. According to the previously published works, the one-way FSI method already had some applications in resonance analysis (He, Citation2018), if hydrodynamic damping is obtained. But this method also requires iterative calculation at each time step when the pressure of the flow field is transferred to the structure field. Therefore, the calculation time of the one-way FSI method is much greater than the harmonic response analysis. In the case of a plate, the calculation time of one-way FSI can reach about 100 times that of the harmonic response analysis (He, Citation2018). Indeed, there are some limitations to the harmonic response analysis. For example, only the resonance analysis of single-mode is conducted, because the imported hydrodynamic damping ratio is determined by a specific mode shape. In addition, only some important excitation frequencies are considered, instead of all the frequencies of pressure pulsation. However, if the designer only needs to focus on the resonance characteristics of a specific mode shape when performing the structural strength check, then these limitations are completely acceptable.
It should be pointed out that this paper is from a practical engineering point of view, and the goal is to obtain acceptable accuracy for resonance risk assessment within an industrial time frame. The harmonic response analysis overcomes the shortcomings of wasting calculation resources by comparing with the one-way or two-way FSI methods and also realizes the resonance analysis by considering the hydrodynamic damping ratio.
5.3.2. Influence of flow rate on the resonance risk
The impeller will inevitably work under off-design conditions, to satisfy the real-time regulation capacity demand of the storage pump. Therefore, the applicability of the resonance risk assessment method developed in the present investigation paper needs to be verified under off-design conditions.
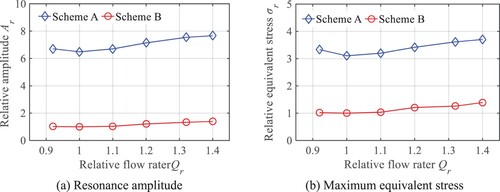
Indeed, the hydraulic excitation frequencies and natural frequencies of the impeller are the same at different flow rates, while the hydraulic excitation amplitude and hydrodynamic damping ratio are varied with flow rate. The relative amplitudes and relative maximum equivalent stresses at different flow rates are also quantitatively obtained, as shown in Figure (a) and (b), respectively (where the relative amplitude and relative maximum equivalent are normalized by corresponding values of scheme B under design flow rate). The amplitudes and maximum equivalent stress are gradually increasing, if the operation condition deviates from the design one, for both schemes A and B. In particular, at the flow rate of 1.4Qd, both the resonance amplitude and maximum equivalent stress are about 1.39 times that at Qd. Two reasons can explain this phenomenon: one is the hydrodynamic damping ratio is the largest at the design flow rate, and another is the hydraulic excitation (pressure pulsation) is increased when the flow rate deviates from the design one. This implies that the possibility of resonance under off-design conditions requires special attention.
Figure 14. Resonance characteristics at different flow rates (a) Resonance amplitude (b) Maximum equivalent stress.
5.3.3. Application prospects
The resonance risk can be assessed, based on the quantitative resonance amplitude and maximum equivalent stress of the prototype impeller. For example, the maximum displacement of the impeller for the 1ND modal is 0.03 m (at 1.4Qd), by considering the hydrodynamic damping ratio. Which is much smaller than the gap size (3 mm), and therefore, the friction between the rotating impeller and side wall will not happen for 1ND mode. In addition, the maximum equivalent stress is also quantitatively determined (2.74 MPa at 1.4Qd). It can use to assess structural strength and fatigue life by comparing it with allowable stress.
The lightweight mechanical structure with a thicker blade is attractive in the design of the hydraulic machinery, due to the requirement for high hydraulic efficiency. However, considering the vibration problems in the operation of hydraulic machinery, especially the resonance, it is forced to compromise and use a conservative design. According to the resonance assessment method implemented in the present investigation, the resonance operating point can be determined and the resonance risk can be quantitatively estimated. Therefore, this method even may have important guidance on the design of lighter and thinner hydraulic machines, under the premise that destructive resonance does not occur.
At present, the hydrodynamic damping ratios and resonance amplitudes of the prototype impeller are difficult to measure, due to the complex geometries and fluid environments. It may not be possible to validate the resonance risk assessment method developed in the present investigation, based on an impeller of a storage pump. In future work, an experiment on a rotating disc will be designed, to quantitatively measure the hydrodynamic damping ratio and resonance amplitude. And then, the validation of the resonance risk assessment method will be carried out.
6. Conclusion
A resonance risk assessment method on a centrifugal impeller is established in the present investigation, by coupling the unsteady CFD, modal work approach, and harmonic response analysis. The accuracy of numerical results, such as the pump energy performances and pressure pulsation characteristics, are in good agreement with the experiments, with relative deviations within 11%. The main conclusions are as follows:
The vibration behaviors of the pump are investigated, as it switches from model to prototype. For the prototype pump, the amplitudes of pressure pulsation at the blade passage frequency are almost identical to that of the model pump, with relative variations within 13.5%. While the natural frequency of the prototype impeller is significantly lower than that of the model impeller.
The hydrodynamic damping characteristics of a centrifugal impeller for the first nodal diameter mode are studied, under design and off-design conditions. It is found that the hydrodynamic damping ratio is the largest in the design flow rate, and is gradually decreased when the flow rate deviates from the design one. In particular, the reduction of the hydrodynamic damping ratio can reach 20%, if the flow rate increases from 1.0 Qd to 1.4 Qd.
A resonance risk assessment method is implemented on a centrifugal impeller by considering the hydrodynamic damping ratio, based on the harmonic response analysis. In particular, the natural frequency, resonance amplitude, and maximum equivalent stresses of the impeller are obtained quantitatively, which proves that the resonance risk assessment method has the potential to judge the resonance operating point and destructiveness in practical engineering.
Data availability statement
Some or all data, models, or codes that support the findings of this study are available from the corresponding author upon reasonable request.
Disclosure statement
No potential conflict of interest was reported by the author(s).
Additional information
Funding
References
- ANSYS Inc. (2012). ANSYS user manual 14.5.
- Bergan, C. W., Tengs, E. O., Solemslie, B. W., & Dahlhaug, O. G. (2018). Damping measurements on a multi-blade cascade with multiple degrees of freedom: A francis-99 test case. Journal of Physics Conference Series, 1296(1), 012003. https://doi.org/10.1088/1742-6596/1296/1/012003
- Bermúdez, M., Cea, L., Puertas, J., Conde, A., Martín, A., & Baztán, J. (2017). Hydraulic model study of the intake-outlet of a pumped-storage hydropower plant. Engineering Applications of Computational Fluid Mechanics, 11(1), 483–495. https://doi.org/10.1080/19942060.2017.1314869
- Celik, I. B., Ghia, U., Roache, P. J., Freitas, C. J., Coleman, H., & Raad, P. E. (2008). Procedure for estimation and reporting of uncertainty due to discretization in CFD applications. Journal of Fluids Engineering, 130(7), 078001. https://doi.org/10.1115/1.2960953
- Chen, J. F., Shi, W. D., & Zhang, D. S. (2021). Influence of blade inlet angle on the performance of a single blade centrifugal pump. Engineering Applications of Computational Fluid Mechanics, 15(1), 462–475. https://doi.org/10.1080/19942060.2020.1868341
- Crandall, S. H. (1970). The role of damping in vibration theory. Journal of Sound and Vibration, 11(1), 3–18. https://doi.org/10.1016/S0022-460X(70)80105-5
- Egusquiza, E., Valero, C., Liang, Q., Coussirat, M., & Seidel, U. (2009). Fluid added mass effect in the modal response of a pump-turbine impeller. ASME 2009 international design engineering technical conferences and computers and information in engineering conference, San Diego, CA, 715-724.
- Gauthier, J. P., Giroux, A. M., Etienne, S., & Gosselin, F. P. (2017). A numerical method for the determination of flow-induced damping in hydroelectric turbines. Journal of Fluids and Structures, 69, 341–354. https://doi.org/10.1016/j.jfluidstructs.2017.01.004
- He, L. Y. (2018). Dynamic Behavior Analysis and Resonance Prediction of Pump-turbine Runner. [Doctoral dissertation, Ph. D. thesis]. China Agricultural University, Beijing, People’s Republic of China.
- He, L. Y., Wang, Z. W., Kurosawa, S., & Nakahara, Y. (2014). Resonance investigation of pump-turbine during startup process. IOP Conference Series: Earth and Environmental Science, 22(3), 032024. https://doi.org/10.1088/1755-1315/22/3/032024
- IEC Standards 60193. (1999). Hydraulic turbines, storage pumps and pump-turbines-model acceptance tests (2 edition). International Commission.
- Kohtanen, E., & Davis, R. B. (2019). Hydroelastic damping of low aspect ratio cantilevered plates. Journal of Fluids and Structures, 90, 315–333. https://doi.org/10.1016/j.jfluidstructs.2019.06.015
- Kong, Y., Kong, Z., Liu, Z., Wei, C., Zhang, J., & An, G. (2017). Pumped storage power stations in China: The past, the present, and the future. Renewable and Sustainable Energy Reviews, 71, 720–731. https://doi.org/10.1016/j.rser.2016.12.100
- Liaghat, T., Guibault, F., Allenbach, L., & Nennemann, B. (2014). Two-Way fluid-structure coupling in vibration and damping analysis of an oscillating hydrofoil. Proceedings of the ASME 2014 international mechanical engineering congress and exposition, Quebec, Canada, November 14-20.
- Liang, Q. W., Lais, S., Gentner, C., & Braun, O. (2012). Efficient runner safety assessment during early design phase and root cause analysis. IOP Conference Series: Earth and Environmental Science, 15(5), 052009. https://doi.org/10.1088/1755-1315/15/5/052009
- Liang, Q. W., Rodr ıguez, C. G., Egusquiza, E., Escaler, X., Farhat, M., & Avellan, F. (2007). Numerical simulation of fluid added mass effect on a francis turbine runner. Computers & Fluids, 36(6), 1106–1118. https://doi.org/10.1016/j.compfluid.2006.08.007
- Liu, M., & Gorman, D. G. (1995). Formulation of Rayleigh damping and its extensions. Computers & Structures, 57(2), 277–285. https://doi.org/10.1016/0045-7949(94)00611-6
- Liu, X., Luo, Y. Y., & Wang, Z. W. (2016). A review on fatigue damage mechanism in hydro turbines. Renewable and Sustainable Energy Reviews, 54, 1–14. https://doi.org/10.1016/j.rser.2015.09.025
- REN21. (2021). Renewables 2021 global status report. REN21 Secretariat.
- Roth, S., Calmon, M., Farhat, M., Muench, C., Huebner, B., & Avellan, F. (2009). Hydrodynamic damping identification from an impulse response of a vibration blade. 3rd IAHR international meeting of the workgroup on cavitation and dynamic problems in hydraulic machinery and systems, Brno, Czech Republic, October 14-16.
- Schmidt, J., Kemmetmüller, W., & Kugi, A. (2017). Modeling and static optimization of a variable speed pumped storage power plant. Renewable Energy, 111, 38–51. https://doi.org/10.1016/j.renene.2017.03.055
- Seeley, C., Coutu, A., Monette, C., Nennemann, B., & Marmont, H. (2012). Characterization of hydrofoil damping due to fluid-structure interaction using piezocomposite actuators. Smart Materials and Structures, 21(3), 35027–35035. https://doi.org/10.1088/0964-1726/21/3/035027
- Smirnov, P., & Menter, F. (2009). Sensitization of the SST turbulence model to rotation and curvature by applying the spalart-shur correction term. Journal of Turbomachinery, 131(4), 041010. https://doi.org/10.1115/1.3070573
- Tanaka, H. (2011). Vibration behavior and dynamic stress of runners of very high head reversible pump-turbines. International Journal of Fluid Machinery and Systems, 4(2), 289–306. https://doi.org/10.5293/IJFMS.2011.4.2.289
- Tao, R., Xiao, R., & Wang, Z. (2018). Influence of blade leading-edge shape on cavitation in a centrifugal pump impeller. Energies, 11(10), 2588. https://doi.org/10.3390/en11102588
- Tengs, E. O. (2019a). Numerical simulation of Fluid-Structure Interaction in high head Francis turbine [Doctoral dissertation, Ph. D. thesis]. Norwegian University of Science and Technology, Trondheim, Norwegian.
- Tengs, E. O., Charrassier, F., Storli, P. T. S., & Holst, M. (2019b). Model order reduction technique applied on harmonic analysis of a submerged vibrating blade. International Journal of Applied Mechanics and Engineering, 24(1), 131–142. https://doi.org/10.2478/ijame-2019-0009
- Trivedi, C. (2017). A review on fluid structure interaction in hydraulic turbines: A focus on hydrodynamic damping. Engineering Failure Analysis, 77, 1–22. https://doi.org/10.1016/j.engfailanal.2017.02.021
- Wang, C., Zeng, Y., Yao, Z., & Wang, F. (2021). Rigid vorticity transport equation and its application to vortical structure evolution analysis in hydro-energy machinery. Engineering Applications of Computational Fluid Mechanics, 15(1), 1016–1033. https://doi.org/10.1080/19942060.2021.1938685
- Yao, Z. F., Wang, F. J., Dreyer, M., & Farhat, M. (2014). Effect of trailing edge shape on hydrodynamic damping for a hydrofoil. Journal of Fluids and Structures, 51, 189–198. https://doi.org/10.1016/j.jfluidstructs.2014.09.003
- Zeng, Y. S., Yao, Z. F., Tao, R., Liu, W. C., & Xiao, X. F. (2021b). Effects of lean mode of blade trailing edge on pressure fluctuation characteristics of a vertical centrifugal pump with vaned diffuser. Journal of Fluids Engineering, 143(11), 111201. https://doi.org/10.1115/1.4051386
- Zeng, Y. S., Yao, Z. F., Zhang, S. J., Wang, F. J., & Xiao, R. F. (2021a). Influence of Tip clearance on the hydrodynamic damping characteristics of a hydrofoil. Journal of Fluids Engineering, 143(6), 061202. https://doi.org/10.1115/1.4049675
- Zeng, Y. S., Yao, Z. F., Zhou, P. J., Wang, F. J., & Hong, Y. P. (2019). Numerical investigation into the effect of the trailing edge shape on added mass and hydrodynamic damping for a hydrofoil. Journal of Fluids and Structures, 88, 167–184. https://doi.org/10.1016/j.jfluidstructs.2019.05.006
- Zhao, H., Wang, F., Wang, C., Chen, W., Yao, Z., Shi, X., Li, X., & Zhong, Q. (2021). Study on the characteristics of horn-like vortices in an axial flow pump impeller under off-design conditions. Engineering Applications of Computational Fluid Mechanics, 15(1), 1613–1628. https://doi.org/10.1080/19942060.2021.1985615
- Zhao, J. T., Pei, J., Yuan, J. P., & Wang, W. J. (2022). Energy-saving oriented optimization design of the impeller and volute of a multi-stage double-suction centrifugal pump using artificial neural network. Engineering Applications of Computational Fluid Mechanics, 16(1), 1974–2001. https://doi.org/10.1080/19942060.2022.2127913