
 ?Mathematical formulae have been encoded as MathML and are displayed in this HTML version using MathJax in order to improve their display. Uncheck the box to turn MathJax off. This feature requires Javascript. Click on a formula to zoom.
ABSTRACT
Controlling pressure impact of water hammer is an important guarantee for safe and stable running of pipeline systems. Previously, we proposed a spring self-adaptive auxiliary control (SAC) system to improve the pressure control ability of a surge tank. However, the working efficiency of the SAC system is affected by various parameters. A reasonable designing strategy becomes an urgent need to properly determine the parameters of the SAC controller. In this study, based on our calibrated numerical model, various transient responses of a SAC system with different parameters were further investigated. The latency response threshold and the spring orifice coefficient were identified to be the two most sensitive parameters that determine the controller working efficiency. Based on the objectives of reducing the in-pipe extreme pressure and in-tank water level fluctuation, an analytical dual-objective optimizing Method was proposed for application. The results demonstrated that the pressure control capability of SAC controller can be optimized by the proposed method.
1. Introduction
In water delivering pipeline systems, water hammer is identified as an undesired hydraulic phenomenon accompanied by rapid changes in velocity of flow and pressure fluctuation (Wylie et al., Citation1993). It is usually caused by fast operation of the valves (Bettaieb & Taieb, Citation2020; Davies et al., Citation2021), startup and shutdown of the pumps (Triki & Essaidi, Citation2022), or a water turbine accident in pipeline systems (Elgammi & Hamad, Citation2022). Water hammer can bring many adverse effects to pipelines, such as vibration (Cao et al., Citation2020), cavitation (Zhu et al., Citation2023), and sometimes even pipe burst (Du et al., Citation2020). When water hammer occurs, its instantaneous pressure wave involves positive pressure impact and negative pressure. Extensive pressure impacts may cause pipe deformation, damage and leakage (Wan & Zhang, Citation2020; Zhang & Wan, Citation2022). Water hammer can cause cracks in hydraulic hoses. Cracks in hydraulic hoses (especially flexible hoses) can be caused by exceeding the failure pressure, fatigue cracking (with repeated hydraulic hammering) or abrasion of the walls of adjacent hoses due to vibration of the hoses. In such cases, repair couplings are used (Karpenko & Bogdevičius, Citation2020). However, the use of repair joints causes additional flow disturbance. On the other hand, with a negative water hammer, the pressure can be significantly less than the operating pressure. In-pipe negative pressure would generate cavitation and may lead to structural failure at the weak sections in system. To ensure long-term stable running of water deliverying pipeline systems, it is crucial to avoid generation of intensive water hammer as possible and control the intensity of pressure fluctuation if occurred.
In order to reduce these harmful impacts on pipeline systems, water hammer control becomes an issue of great concern to the design institutes. One of the common methods of water hammer control is optimizing the operations of pipeline systems, which include extending the valve closing time, adopting a reasonable valve closing law, and coordinating operation of the system components, etc. Tian et al. (Citation2008) presented a scheme to slow down the closing speed of the check valve by adding a damping torque, so as to mitigate the harm caused by water hammer. Bazargan-Lari et al. (Citation2013) developed an optimal valve-closing curve and validated its effectiveness in reducing the valve-induced water hammer pressure. Wan (Wan & Li, Citation2016) studied an optimal cooperative operating scheme of a series pump-valve system. It can not only prevent the inverse rotation of pumps, but also reduce the transient extreme pressure induced by pump start-up and stop. Lai (Hoeller & Jaberg, Citation2013) established a multi-objective optimization model to optimize the closing law of turbine guide vanes during load rejection, the results showed considerable advantages of the optimized closure law of guide vanes over the traditional one. However, the optimizing operation mode is often insufficient to meet the pressure control requirements in large-scale practice. Therefore, some protective devices are usually installed in pipeline systems to enhance the ability of water hammer control, such as surge tanks, air vessels (Stephenson, Citation2002), relief valve (Zong et al., Citation2022) and other devices (Bostan et al., Citation2019; Karney & Simpson, Citation2007; Liu et al., Citation2017). When the water hammer control device is designed correctly, it can protect the system from the hazards of transient extreme pressure and long-term pressure surge (Lizarraga-Raygoza et al., Citation2018). With the development of research and application, some new methods for controlling water hammer have been proposed by researchers. Kim (Kim et al., Citation2018) presented that the potential risk of water hammer can be effectively controlled by using a pressure relief valve with loaded spring in pipeline system. Triki (Triki & Chaker, Citation2019) proposed a strategy of replacing a part of the steel pipe with a small section of polymeric pipe, the numerical results showed that this approach can mitigate the impact of water hammer. Nonetheless, surge tank is still one of the most popular and stable water control device nowadays. It is widely used in water conveyance system, pump rising system, and hydropower station system (Yazdi et al., Citation2019; Yu et al., Citation2014). In recent years, researchers have made many studies in performance optimization of surge tanks. Kim (Citation2010) proposed to combine the impulse response method with the Genetic Algorithm to realize the optimal design of surge tanks. Fathi-Moghadam et al. (Citation2013) used a genetic algorithm technique to optimize some parameters such as the diameter of the surge tank, and the technique has been successfully applied to practical projects. Wan (Wan & Zhang, Citation2018) proposed an intelligent self-controlled surge tank (IST) and verifies that IST can control water hammer better than regular surge tanks.
However, surge tanks are greatly limited by the topography design and where they are located. In our previous work, a self-adaptive auxiliary control (SAC) system was proposed to improve the performance of normal surge tanks (Wan et al., Citation2019). It was demonstrated that the SAC system can reduce the amplitude of water level in surge tanks, making the required size of surge tanks smaller than normal ones. In this study, more quantitative investigation was carried out to find out the optimal design of SAC system. The working efficiency of the SAC system on surge tanks is affected by multiple parameters, among which the dominant two are the latency response threshold and the spring orifice coefficient. The latency response threshold is identified as a hydraulic head constant , determined as the pressure differential required for the regulating valve to respond to changes in water pressure, which can be typically set based on specific application scenarios. The latency response threshold plays a significant role in determining the response speed of the SAC system and maintaining stable water pressure within the system. Setting the latency response threshold too high or too low can lead to unstable water pressure within the system. However, the former will slow down the response speed of the SAC system, while the latter will accelerate it. Within the SAC system, the spring used to adjust the regulating valve is a critical component. The dominant physical characteristics to determine the real-time valve opening ratio based on the pressure differential is the spring orifice coefficient, which involves the influence of the spring stiffness and the spring aperture size. Increasing the spring orifice coefficient generally results in a faster spring response speed, but at the cost of reduced system stability, whereas decreasing the coefficient leads to a slower response speed but may compromise system accuracy. Therefore, in the SAC system, the latency response threshold and the spring orifice coefficient needs to be adjusted reasonably according to specific application scenarios to achieve the best water pressure regulation effect.
In addition, the objectives of improvement are multiple, including controlling the extreme in-pipe pressure and the in-tank water fluctuation. Therefore, the optimization of the SAC system is complex dual-objectives and multi-objectives subject. In order to optimize the design of the SAC system, a reliable numerical model was established for SAC surge tanks. Then the sensitivity of the latency response threshold and the spring orifice coefficient were studied. Dual-objectives optimizing strategy based on pressure control was proposed to realize the targets. The results showed that the optimized SAC surge tank can not only remarkably reduce the in-tank water level fluctuation, but also effectively limit the in-pipe extreme transient pressure.
2. Model establishment
2.1. Working modes of SAC
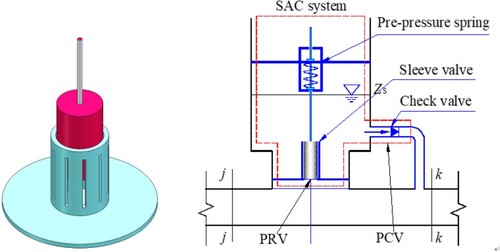
Surge tank is widely used to reduce transient pressure fluctuations in pressurized pipeline systems. A regular surge tank always immediately responses to the in-pipe appeared pressure fluctuation, without estimating the severity. As a result, the surge tank does not always work in a high efficient manner, and a large size is necessary to satisfy the continuous water exchange between main pipe and surge tank. The SAC system is an auxiliary device to improve the water hammer protects performance of a surge tank. A SAC system is normally composed of a pressure release valve and a pressure compensate valve with pre-pressure springs. The device will self-adaptively works in three modes, respectively the standby mode, the pressure-release mode and the pressure-compensate mode. As shown in Figure , a single sleeve spring self-adaptive auxiliary control system is proposed, composed of a pre-pressure spring, a sleeve valve and a check valve. As a common SAC system, it can also work with the aforementioned three response modes in a River-Pipe-Valve (RPV) system:
Standby mode (SM): the RPV system works in steady condition, the in-tank water level is initialized and maintains at a low status. Both the sleeve valve (SV) and the check valve (CV) stay inactivated.
Pressure release mode (PRM): when the pressure in main pipe increases and exceeds the threshold value (TV), the SV is activated to release the water from the main pipe into the surge tank for reducing the extreme pressure impacting the pipeline. The CV is inactivated in the mode.
Pressure compensate mode (PCM): in this mode, the transient pressure is lower than the in-tank water level, the CV is activated to compensate water back into the main pipe for preventing negative pressure occurring.
Figure 1. Schematic figure of the proposed Single Sleeve SAC system.
2.2. Working principles of SAC
Unlike a regular surge tank, the surge tank with SAC system can flexibly work in different modes dealing with the time-dependent pressure fluctuation to improve the controlling of water hammer. The dynamic working principles can be described as follow:
When pipe system is working at steady status, the CV will initialize the in-tank water level to the local in-pipe hydraulic head. It keeps the in-tank water level at a low status, reserving sufficient potential height and volume to satisfy the huge and rapid water exchange for water hammer protection.
When water hammer happens, if the transient pressure exceeds the predetermined pressure limit, the spring will be compressed, the SV will be activated to release the further pressure increase. During this period, the in-tank water level will be raising.
When the transient hydraulic pressure fluctuation in pipe becomes lower than the in-tank water level, the CV will be activated and water flows back to the pipe to prevent the negative pressure occurring and avoid cavitation.
When the transient pressure remains within the affordable pressure range, SAC system will maintain the standby mode.
2.3. Numerical solutions of SAC
The hydraulic transient process and transient flow in pressurized pipelines are essential factors to consider for the effective design and operation of hydraulic systems. Therefore, this study aimed to investigate these phenomena by selecting a set of equations and parameters as the theoretical foundation for developing a numerical model and theoretical solution for the SAC system. The numerical methods used in this study, including the MacCormack and finite difference methods, allowed for the real-time prediction of hydraulic variables throughout the pipeline system, including upstream reservoirs, downstream valves, and pressure regulating wells.
For a pressurized pipe flow, the system is considered as 1D model, the controlling equations includes the continuity and momentum equations, which can be expressed as: (Wylie et al., Citation1993)
(1)
(1) where
is hydraulic head,
is time,
is the velocity of flow,
is wave speed,
is pipe slope,
is gravity acceleration,
is pipe inner diameter. In addition, the unsteady friction factor can be estimated by: (Pezzinga, Citation2000)
(2)
(2) where
represents the quasi-steady friction factor, induced by the friction from pipe wall.
is the Brunone friction coefficient, which is approximated as: (Bergant et al., Citation2001)
(3)
(3) Hence, the controlling equations considering turbulent friction can be derived into:
(4)
(4) Figure shows the grid discretization considering boundary conditions of upstream, downstream and the surge tank.
Figure 2. Grid mesh of pipeline with a surge tank.
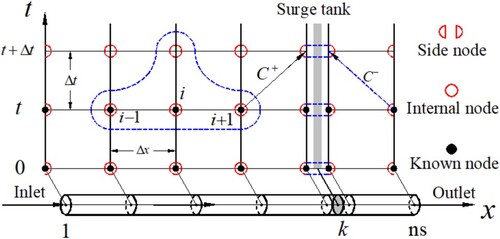
As a solution of Equation (4), MacCormack method, shown as Equation (5), can be applied by finite differences as Equation (6): (Wan & Huang, Citation2018)
(5)
(5)
(6)
(6) Combining Equations (4) and (6), the meshing nodes at next time step can be solved by an adjacent node:
(7)
(7)
(8)
(8) Accordingly, it can be further calibrated by the other adjacent node:
(9)
(9)
(10)
(10) In this way, all the internal nodes in Figure can be calculated introducing the time step from
to
. Combined with the boundary conditions including upstream reservoir, downstream valve, and the joint surge tank, the numerical approach can predict the real-time hydraulic variables within the whole pipeline system.
Based on the above contents and relevant research methods of hydraulic transition process and transient flow in hydraulic systems, the selected set of equations provides a comprehensive and integrated theoretical foundation to study the hydraulic behaviour of pressurized pipelines. The equations consider various critical factors, including friction coefficients, which affect the hydraulic behaviour of the system, especially in transient states. The numerical method proposed in this study can simulate hydraulic behaviour with reasonable accuracy, which is crucial for designing and optimizing the hydraulic system, and the results can contribute to the practical application of pressurized pipelines in the water conservancy industry. The afore-mentioned numerical model has been validated in our previous study with physical tests (Zhang et al., Citation2018), which was focusing on the investigation of in-pipe numerical methods.
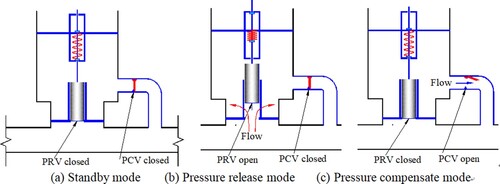
2.4. SAC integrated in surge tank
In a surge tank integrated with SAC system, the boundary condition of surge tank needs to be divided according to the three different response modes. Figure shows the three working modes including (a) standby mode (SM), (b) pressure release mode (PRM), and (c) pressure compensate mode (PCM). For SM, seen in Figure (a), the SV and the CV are both closed with no water exchange between the main pipe and surge tank. In PRM, as shown in Figure (b), the SV is opened when the pressure differential between the main pipe and surge tank exceeds the latency response threshold (LRT), represented by, while CV remains closed. In PCM, shown as Figure (c), the CV is activated when in-pipe pressure is lower than the in-tank pressure, while the SV will be closed.
Figure 3. The response modes of the SAC system.
To simplify the boundary condition of surge tank, the constraint equations between the surge tank and the main pipe were treated as Equation (11).
(11)
(11) In addition, the switching boundary conditions should be involved and discussed respectively. The standby mode works when
and
. The spring-sleeve valve and check valve both remain closed. The SAC does not actually work in this case, where the boundary condition remains the same as Equation (4). On the other hand, the pressure release mode takes charge when
, where
. Here, SAC works to reduce the in-pipe extreme pressure. During this period, liquid flows from the main pipe into the surge tank, which can be estimated as:
(12)
(12)
(13)
(13) where
is the spring coefficient,
,
is the spring constant,
is the height of the spring-sleeve valve,
is the cross area of sleeve piston. In addition, when
, the pressure compensate mode will be in charge, where
. The SAC will response to prevent the negative pressure. At this time, liquid flows from the surge tank back into main pipe, the discharge of which is:
(14)
(14)
3. Dual-objectives sensitivity analysis
3.1. Parameter analysis and optimization
To carry out the quantitative numerical study, a RPV system model was established, shown as Figure , mounting with a surge tank, whose detailed information is listed in Table .
Figure 4. The surge tank with SAC in river-pipe-valve (RPV) system.
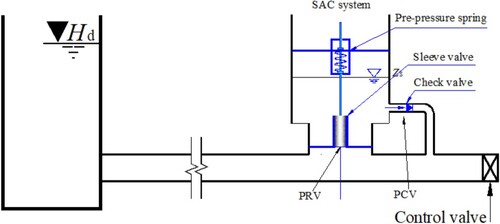
Table 1. Detailed information of the RPV system.
Based on the previous research, for the SAC system, the controlling objectives include: (1) the in-pipe maximum pressure; and (2) the in-tank water level fluctuation. In SAC surge tank, the control of in-pipe transient pressure and in-tank water level fluctuation are determined by a variety of parameters. The dominant effective parameters include: (1) the latency response threshold and (2) the spring orifice coefficient
. To quantitatively study the effects of these parameters, plenty of pressure fluctuation processes in RPV system with the SAC surge tank simulated for discussion.
3.1.1. Sensitivity analysis of latency response threshold and spring orifice coefficient
The appropriate parameters selection is significant to improve the SAC system. To optimize the parameters of the SAC system, the sensitivity of latency response threshold and spring orifice coefficient was analyzed in this section and the optimization approach of the SAC was subsequently established.
For water hammer analysis, reducing the in-pipe peak pressure and in-tank fluctuation amplitude are the primary purposes. Figure (a) (i) presents the effects of the latency response threshold on the in-pipe maximum pressure. In most cases, the maximum pressure increases along with the latency response threshold . Nevertheless, in some special cases with extremely small
approaching zero, the maximum pressure decreases first and then increases with the reduction of the latency response threshold. On the other hand, the water oscillation elevation serves as the second objective, since it directly determines the required height and size of surge tanks. Figure (a) (ii) shows the relationship between the maximum in-tank water level oscillation and
. It indicates that the maximum in-tank water level decreases with the increase of
.
Figure 5. Effects of critical latency response threshold and spring orifice coefficient on the in-pipe peak pressure and the maximum in-tank oscillation water level. (a) Effects of the critical latency response threshold. (i) The in-pipe peak pressure versus , (ii) the maximum in-tank oscillation water level versus
. (b) Effects of the spring orifice coefficient. (i) The in-pipe peak pressure versus
, (ii) the maximum in-tank oscillation water level versus
.
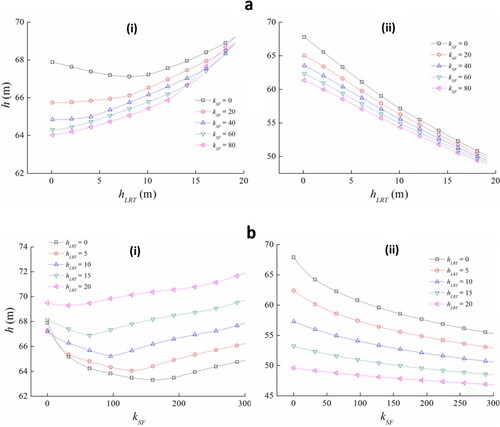
Meanwhile, Figure (b) (i) presents the sensitivity of the spring orifice coefficient on the first objective (peak pressure in the pipeline) under various latency response thresholds. For conditions with different latency response thresholds, the in-pipe peak pressure decreases first and then increases with the spring orifice coefficient, which indicates that, for any given latency response threshold, there is always an optimal matching spring orifice coefficient to reduce the peak pressure. Figure (b) (ii) analyzes the sensitivity relationship between the maximum in-tank water level and the spring orifice coefficient, under different latency response threshold conditions. For a given latency response threshold, the second objective (maximum in-tank water level) decreases with the increase of the
. From this point of view, a large
is beneficial to reduce the in-tank oscillation.
The above sensitivity analysis shows the latency response threshold and the spring orifice coefficient
are the most important parameters affecting the in-pipe transient pressure and the in-tank water level oscillation. However, considering both the parameters as independent variables, the relationships between them and the two objectives become complex nonlinear. To approach the optimization of the SAC system, an analytical dual-objectives analysis was proposed.
3.1.2. Sensitive analysis
To search for the optimal parameters, the sensitivity of dual-objectives was analyzed using the three-dimensional curved surface. In this analysis, the latency response threshold and the spring orifice coefficient were set as the independent variables, and the in-pipe pressure and water surface fluctuation control were seen as the target variables. In order to identify the optimal latency response threshold and spring orifice coefficient, the three-dimensional analysis diagram was presented in Figure . For any given latency response threshold, there is an unique optimal spring orifice coefficient to minimize the peak pressure in the pipeline. Targeting at the best control of peak pressure in the pipeline, the optimal combination curve of the latency response threshold and the spring orifice coefficient can be obtained, sketched as the thick solid red line in Figure (a), where the contour colour represents the maximum in-pipe pressure value. Similarly, the optimal designs of the latency response threshold and the spring orifice coefficient can be obtained for the second objective, shown as Figure (b), where the contour colour indicates the maximum in-tank water level.
Figure 6. The three-dimensional analysis of the optimal mapping parameters of the SAC system. (a) For the first objective: in-pipe peak pressure. (b) For the second objective: in-tank water level oscillation.
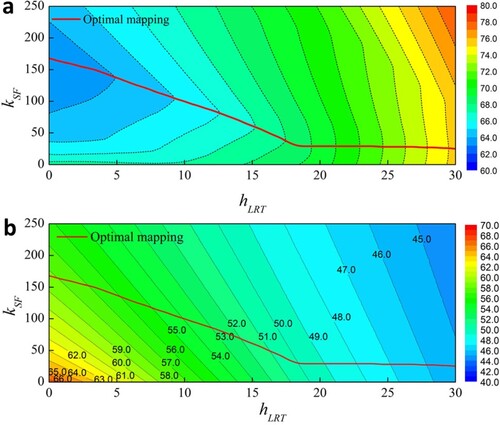
In real conditions, this mechanical system may perform poorer than the designed optimal condition due to corrosion and algae growth near the valve and orifice after a long time of working. More simulations based on different values of the latency response threshold and the spring orifice coefficient were conducted and the statistic extreme pressure results were presented in Table . It can be seen that there is little difference on the expected extreme pressure when a little bias occurs on these two parameters. For instance, if the was increased from 8 m (optimal designed) to 10 m (real condition) after a long term running, and
reduced from 160 to 150, the extreme pressure would be slightly increased from 65.47 m to 66.06 m.
Table 2. Extreme pressures of the pipeline for various parameters of the SAC (m).
4. Optimization and feasibility analysis
4.1. Parameters selecting strategy
According to the optimal mapping curve of latency response threshold and spring orifice coefficient, Figure presents the global mapping results of the in-pipe peak pressure and the maximum in-tank water level oscillation versus all the featured combinations sketched in Figure .
Figure 7. The results of dual-objectives selection strategy of the SAC system.
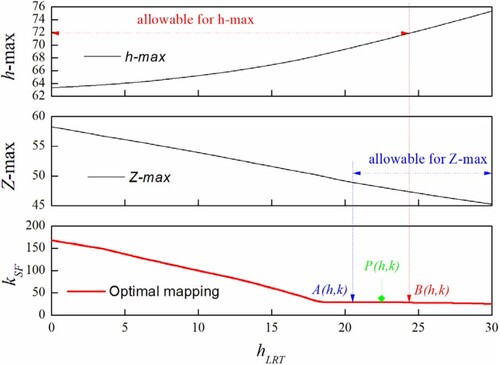
Focusing at the in-pipe pressure control, the acceptable latency response threshold range is:
(15)
(15) As for the in-tank water level control, the acceptable latency response threshold range is:
(16)
(16) When both are satisfied, the selected latency response threshold range is:
(17)
(17) The selected latency response threshold range is shown in Figure . Considering the same weight for the two objectives, the optimal parameters combination can be identified as:
(18)
(18) According to the featured combination curve, the optimal latency response threshold and the spring orifice coefficient can be obtained as follow:
(19)
(19) A normal surge tank requires large volume to store and supply water, which depends on the estimated amplitude of water mass oscillation and the extreme transient pressure that the pipeline can endure. How to reduce the required size and height of the surge tank has always been the priority of designing. In a SAC surge tank, both the latency response threshold and the spring orifice coefficient can improve its working performance. With the same geometric scale, compared with traditional surge tank, mechanical auxiliary equipment can reduce both the in-tank water mass oscillation and the in-pipe extreme transient pressure. In general, for a multi-objectives case, the parameters can only be optimized based on some additional constraints. For example, in the above case study, if given the upper height limit of surge tank as 54 m and the allowable in-pipe pressure as 68.5 m, then the spring orifice coefficient and latency response threshold should be valued as
= 10 m and
= 150.
4.2. Results and verification
The purpose of mounting the SAC system mainly underlines improving the pressure control performance of the surge tank, and secondly reducing the required size of it. To verify the performance of SAC surge tank after parameters optimization, Figures compared the transient response processes with a SAC surge tank and a normal surge tank of the same geometrical scale.
Figure 8. Pressure evolution at downstream valve.
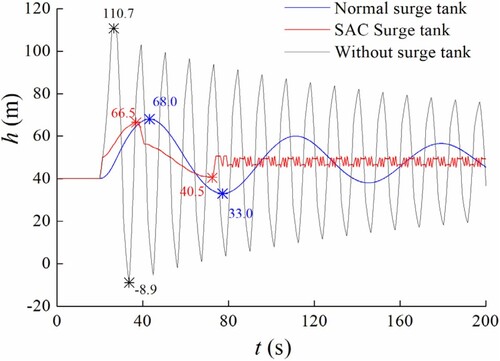
Figure 9. Extreme pressure curves along the pipeline.
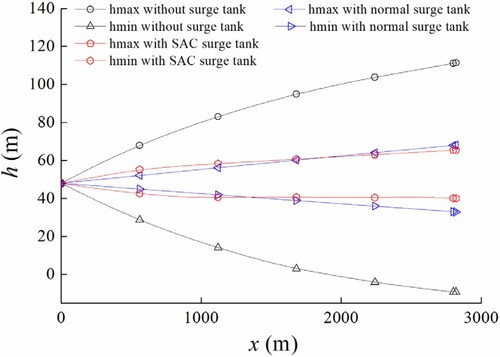
Figure 10. Water exchange process between the SAC surge tank and main pipe.
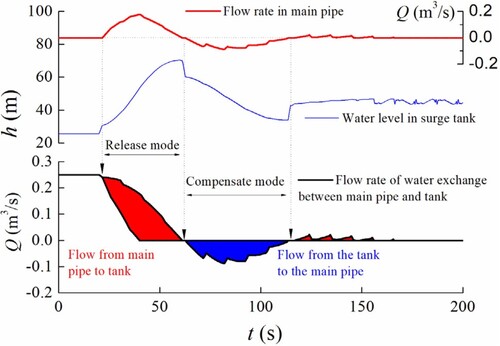
Figure 11. In-tank water level oscillations in SAC surge tank and normal surge tank.
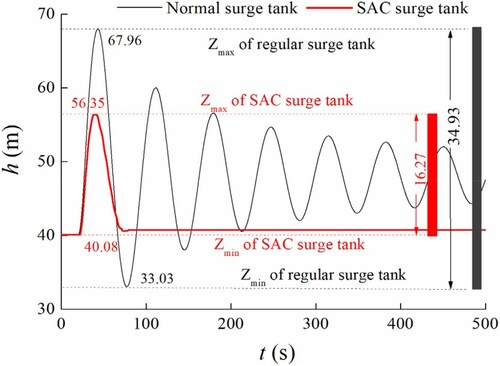
Figure shows the transient pressure evolutions at the valve (the most severe point) under three conditions: without surge tank, with a normal surge tank and with a SAC surge tank. It can be seen that, the maximum transient pressure without surge tank is 110.7 m, which decreases to 68 m in the case of normal surge tank and 66.5 m for SAC surge tank. In contrast, the SAC surge tank controls the amplitude of transient pressure fluctuation better, the pressure fluctuation range of the pipeline decreased from 35 m to 20 m. In addition, the devices also cut down the duration of high-intensity oscillations. Figure shows the global extreme pressure curves under these three conditions. The SAC surge tank can better limit the extreme pressure along the whole pipeline within the allowable range, compared to the regular surge tank.
Figure shows the water exchange process of the SAC surge tank with optimized parameters. When the in-pipe pressure exceeds the upper threshold value, the SAC pressure release mode starts working. The sleeve valve opens and the water is pushed from the main pipe into the SAC surge tank. Until the pressure reduces back below the threshold, pressure releasing stops. Subsequently, the in-pipe pressure drops below the in-tank water level, where the pressure compensate mode take charge. The check valve opens and water is released from surge tank back into main pipe. Until the pressure raises above the in-tank water level again, the check valve closes. After several times of the above response process, the pipe pressure will be effectively controlled within the allowable pressure range. Compared with the regular surge tank, the water exchange volume between the main pipe and the SAC surge tank turns out to be smaller, also presents a shorter period.
Figure compares the in-tank water level oscillations between normal surge tank and SAC surge tank. The maximum surge in the SAC surge tank decreases from 68 m (normal surge tank) to 56 m, and the minimum water level rises from 33 m (normal surge tank) to 40 m. Therefore, for the same cross area, SAC surge tank requires only 16 m in height, while the normal surge tank requires 35 m. It indicates that SAC surge tank can be significantly helpful when facing strict terrain restrictions, especially when the pipeline is shallow buried. Otherwise the construction of tank above the ground may become another challenge.
The results clearly show that the optimized SAC surge tank perform better than the regular surge tank in the controlling the in-pipe transient pressure and in-tank the water level oscillation. After parameters optimization with the proposed strategy, the SAC surge tank not only improved the water hammer control performance, but also reduced its required geometrical scale.
5. Discussion
The SAC system has been demonstrated to be able to significantly improve the performance of surge tanks. Two major objectives were identified to be the maximum in-pipe transient pressure and the in-tank water mass oscillation. It was demonstrated that the performance of SAC system is primarily depended on appropriate designing of the geometrical and system parameters. If the parameters were designed improperly, the SAC system may even reduce the pressure control ability of the surge tank. Therefore, it is of great significance to identify the suitable latency response threshold and the spring orifice coefficient. However, the influence of parameters on the SAC system appeared to be a complex nonlinear relationship, as there are at least two objectives to be considered. Therefore, the optimization of the SAC system is actually a complex dual-objectives and multi-objectives problem.
In this paper, a dual-objectives optimizing method was proposed for the searching the optimal design of the SAC system. Two dominant parameters that affect its performance, namely the latency response threshold and the spring orifice coefficient, were respectively studied. Through dual-objectives analysis, the optimal combination curve of the optimal latency response threshold and the spring orifice coefficient was obtained. Then the acceptable range of parameters was split based on the dual control objectives. Finally, the optimal latency response threshold and the spring orifice coefficient were identified according to the optimal combination curve. The feasibility of the dual-objectives optimizing strategy was discussed with the verification results. The results showed that the optimal SAC system remarkably improved the in-pipe pressure control. In addition, it also reduced the required size of the surge tank by better controlling the in-tank water level oscillation amplitude. The SAC system can also be applied in pressure vessels, as the volume of pressure vessel can be regarded as its limitation of pressure control capacity, which can be better used in a reorganized process. Nevertheless, this technique is not applicable for pressure release valve, since there is no limitation on the volume of released liquids.
It has to be claimed that the slide valve carries the risk of the valve hanging up. Valves of this type are sensitive to contamination. If contamination gets between the spool and the sleeve, it can lead to immobilization of the spool. Besides, solid particles will also harm the running of upstream pump. What we can do to prevent this threat is to make sure the income delivered water free of large solid particles. It requires an additional filter grid before the inlet pipe of the upstream pump, and also monitoring of SAC system working condition is needed for prompt check. Therefore, the further study underlines solving the problems in practical application, such as the valves contamination threat, the real-time monitoring and rapid detection of failure.
6. Conclusions
In this paper, the working strategy of a single sleeve spring SAC system was designed and realized in numerical simulation. The dominant parameters to optimize the in-pipe transient pressure control and in-tank water level control were identified to be the latency response threshold and the spring orifice coefficient. Sensitive analysis was conducted to find out the optimal design strategy of the two dominant parameters in a single pipe case study. Given the upper height limit of surge tank as 54 m and the allowable in-pipe pressure as 68.5 m, the optimized spring orifice coefficient and latency response threshold were determined as = 10 m and
= 150. With the optimized SAC system, a normal surge tank was demonstrated to perform much better pressure control capacity. Facing an intensive water hammer generated by rapid valve closing in 8s at the end of a 2820 m pipeline, the maximum surge in the SAC surge tank decreases from 68 m (normal surge tank) to 56 m, and the minimum water level rises from 33 m (normal surge tank) to 40 m.
Nomenclature
| = | Hydraulic head (m) | |
| = | Time (s) | |
| = | Velocity of flow (m/s) | |
| = | Distance along pipe from the inlet (m) | |
| = | Wave speed of water hammer (m/s) | |
| = | Acceleration of gravity (m/s2) | |
| = | Pipe slope | |
| = | Darcy–Weisbach friction factor | |
| = | Main pipe diameter (m) | |
| = | Quasi-steady friction factor | |
| = | Brunone friction coefficient | |
| = | Constant | |
| = | Reynolds number | |
| = | Serial number of nodes | |
| = | Serial number of nodes | |
| = | Serial number of nodes | |
| = | Time interval step (s) | |
| = | Space interval step (s) | |
| = | Water level (m) | |
| = | Discharge in section (m3/s) | |
| = | Known constant in compatibility equations | |
| = | Known constant in compatibility equations | |
| = | The cross-sectional area of the surge tank (m2) | |
| = | Opening ratio | |
| = | Flow coefficient of valve | |
| = | Spring orifice coefficient | |
| = | Density of water (kg/m3) | |
| = | Height of the spring-sleeve valve (m) | |
| = | Cross area of sleeve piston (m2) | |
| = | Water level of the upstream reservoir (m) | |
| = | Length of pipe (m) | |
| = | Discharge of normal running condition (m3/s) | |
| = | Time of valve closing (s) | |
| = | Latency response threshold (m) |
Abbreviation
| SAC | = | Self-adaptive Auxiliary Control |
| PCV | = | Pressure Compensation Valve |
| PRV | = | Pressure Release Valve |
Disclosure statement
No potential conflict of interest was reported by the author(s).
Data availability
Data will be made available on request.
Additional information
Funding
References
- Bazargan-Lari, M. R., Kerachian, R., Afshar, H., & Bashi-Azghadi, S. N. (2013). Developing an optimal valve closing rule curve for real-time pressure control in pipes. Journal of Mechanical Science and Technology, 27(1), 215–225. https://doi.org/10.1007/s12206-012-1208-7
- Bergant, A., Ross Simpson, A., & Vìtkovsk, J. (2001). Developments in unsteady pipe flow friction modelling. Journal of Hydraulic Research, 39(3), 249–257. https://doi.org/10.1080/00221680109499828
- Bettaieb, N., & Taieb, E. H. (2020). Assessment of failure modes caused by water hammer and investigation of convenient control measures. Journal of Pipeline Systems Engineering and Practice, 11(2), 04020006. https://doi.org/10.1061/(ASCE)PS.1949-1204.0000446
- Bostan, M., Akhtari, A. A., Bonakdari, H., & Jalili, F. (2019). Optimal design for shock damper with genetic algorithm to control water hammer effects in complex water distribution systems. Water Resources Management, 33(5), 1665–1681. https://doi.org/10.1007/s11269-019-2192-9
- Cao, H., Mohareb, M., & Nistor, I. (2020). Finite element for the dynamic analysis of pipes subjected to water hammer. Journal of Fluids and Structures, 93, 102845. https://doi.org/10.1016/j.jfluidstructs.2019.102845
- Davies, W., Wolf, M., Barry, M., O’Hern, S., & Morse, T. (2021). The effect of valve closure time on water hammer. In ASME international mechanical engineering congress and exposition (Vol. 85666, pp. V010T10A026). American Society of Mechanical Engineers.
- Du, X.-x., Lambert, M. F., Chen, L., Jing Hu, E., & Xi, W. (2020). Pipe burst detection, localization, and quantification using the transient pressure damping method. Journal of Hydraulic Engineering, 146(11), 04020077. https://doi.org/10.1061/(ASCE)HY.1943-7900.0001810
- Elgammi, M., & Hamad, A. A. (2022). A feasibility study of operating a low static pressure head micro pelton turbine based on water hammer phenomenon. Renewable Energy, 195, 1–16. https://doi.org/10.1016/j.renene.2022.05.131
- Fathi-Moghadam, M., Haghighipour, S., & Vali Samani, H. M. (2013). Design-variable optimization of hydropower tunnels and surge tanks using a genetic algorithm. Journal of Water Resources Planning and Management, 139(2), 200–208. https://doi.org/10.1061/(ASCE)WR.1943-5452.0000243
- Hoeller, S., & Jaberg, H. (2013). A contribution to water hammer analysis in pumped-storage power plants. WasserWirtschaft-Hydrologie, Wasserbau, Hydromechanik, Gewässer, Ökologie, Boden, 103(1/2), 78–84.
- Karney, B. W., & Simpson, A. R. (2007). In-line check valves for water hammer control. Journal of Hydraulic Research, 45(4), 547–554. https://doi.org/10.1080/00221686.2007.9521790
- Karpenko, M., & Bogdevičius, M. (2020). Investigation of hydrodynamic processes in the system – “pipeline-fittings”. In TRANSBALTICA XI: Transportation science and technology: Proceedings of the international conference TRANSBALTICA, May 2-3, 2019, Vilnius, Lithuania (pp. 331–340). Springer International Publishing.
- Kim, H., Kim, S., Kim, Y., & Kim, J. (2018). Optimization of operation parameters for direct spring loaded pressure relief valve in a pipeline system. Journal of Pressure Vessel Technology, 140(5), 051603. https://doi.org/10.1115/1.4040361
- Kim, S.-H. (2010). Design of surge tank for water supply systems using the impulse response method with the GA algorithm. Journal of Mechanical Science and Technology, 24(2), 629–636. https://doi.org/10.1007/s12206-010-0108-y
- Liu, J., Zhang, J., Chen, S., & Yu, X. (2017). Investigation on maximum upsurge and air pressure of air cushion surge chamber in hydropower stations. Journal of Pressure Vessel Technology, 139(3), 031603. https://doi.org/10.1115/1.4035790
- Lizarraga-Raygoza, A., Delgado-Aguiñaga, J., & Begovich, O. (2018). Steady state algorithm for leak diagnosis in water pipeline systems. IFAC-PapersOnLine, 51(13), 402–407. https://doi.org/10.1016/j.ifacol.2018.07.312
- Pezzinga, G. (2000). Evaluation of unsteady flow resistances by quasi-2D or 1D models. Journal of Hydraulic Engineering, 126(10), 778–785. https://doi.org/10.1061/(ASCE)0733-9429(2000)126:10(778)
- Stephenson, D. (2002). Simple guide for design of air vessels for water hammer protection of pumping lines. Journal of Hydraulic Engineering, 128(8), 792–797. https://doi.org/10.1061/(ASCE)0733-9429(2002)128:8(792)
- Tian, W., Su, G. H., Wang, G., Qiu, S., & Xiao, Z. (2008). Numerical simulation and optimization on valve-induced water hammer characteristics for parallel pump feedwater system. Annals of Nuclear Energy, 35(12), 2280–2287. https://doi.org/10.1016/j.anucene.2008.08.012
- Triki, A., & Chaker, M. A. (2019). Compound technique-based inline design strategy for water-hammer control in steel pressurized-piping systems. International Journal of Pressure Vessels and Piping, 169, 188–203. https://doi.org/10.1016/j.ijpvp.2018.12.001
- Triki, A., & Essaidi, B. (2022). Investigation of pump failure-induced waterhammer waves: A case study. Journal of Pressure Vessel Technology, 144(2), 021403. https://doi.org/10.1115/1.4051512
- Wan, W., & Huang, W. (2018). Water hammer simulation of a series pipe system using the MacCormack time marching scheme. Acta Mechanica, 229(7), 3143–3160. https://doi.org/10.1007/s00707-018-2179-2
- Wan, W., & Li, F. (2016). Sensitivity analysis of operational time differences for a pump–valve system on a water hammer response. Journal of Pressure Vessel Technology, 138(1), 011303. https://doi.org/10.1115/1.4031202
- Wan, W., & Zhang, B. (2018). Investigation of water hammer protection in water supply pipeline systems using an intelligent self-controlled surge tank. Energies, 11(6), 1450. https://doi.org/10.3390/en11061450
- Wan, W., & Zhang, B. (2020). The intermittent leakage phenomenon of incipient cracks under transient conditions in pipeline systems†. International Journal of Pressure Vessels and Piping, 186, 104138. https://doi.org/10.1016/j.ijpvp.2020.104138
- Wan, W., Zhang, B., Chen, X., & Lian, J. (2019). Water hammer control analysis of an intelligent surge tank with spring self-adaptive auxiliary control system. Energies, 12(13), 2527. https://doi.org/10.3390/en12132527
- Wylie, E. B., Streeter, V. L., & Suo, L. (1993). Fluid transients in systems (Vol. 1). Prentice Hall.
- Yazdi, J., Hokmabadi, A., & JaliliGhazizadeh, M. (2019). Optimal size and placement of water hammer protective devices in water conveyance pipelines. Water Resources Management, 33(2), 569–590. https://doi.org/10.1007/s11269-018-2120-4
- Yu, X., Zhang, J., & Zhou, L. (2014). Hydraulic transients in the long diversion-type hydropower station with a complex differential surge tank. The Scientific World Journal, 2014, Article id 241868. https://doi.org/10.1155/2014/241868
- Zhang, B., & Wan, W. (2022). A transient-features-based diagnostic method of multi incipient cracks in pipeline systems. International Journal of Pressure Vessels and Piping, 199, 104701. https://doi.org/10.1016/j.ijpvp.2022.104701
- Zhang, B., Wan, W., & Shi, M. (2018). Experimental and numerical simulation of water hammer in gravitational pipe flow with continuous air entrainment. Water, 10(7), 928. https://doi.org/10.3390/w10070928
- Zhu, J., Wu, G., Duan, X., Li, X., & Tang, X. (2023). Numerical studies on applications of cavitation models in water hammer-induced cavitating flows in pipelines. Physics of Fluids, 35(9), 095129. https://doi.org/10.1063/5.0158788
- Zong, C., Li, Q., Li, K., Song, X., Chen, D., Li, X., & Wang, X. (2022). Computational fluid dynamics analysis and extended adaptive hybrid functions model-based design optimization of an explosion-proof safety valve. Engineering Applications of Computational Fluid Mechanics, 16(1), 296–315. https://doi.org/10.1080/19942060.2021.2010602