
 ?Mathematical formulae have been encoded as MathML and are displayed in this HTML version using MathJax in order to improve their display. Uncheck the box to turn MathJax off. This feature requires Javascript. Click on a formula to zoom.
ABSTRACT
In 2015, the Programme for International Student Assessment (PISA) introduced multiple changes in its study design, the most extensive being the transition from paper- to computer-based assessment. We investigated the differences between German students’ text responses to eight reading items from the paper-based study in 2012 to text responses to the same items from the computer-based study in 2015. Two response features – information quantity and relevance proportion – were extracted by natural language processing techniques because they are crucial indicators for the response process. Showcasing potential differential relationships, we additionally examined gender differences. Modelling effects of the round of assessment, gender, and response correctness on the response features, we analysed responses from 15-year-olds and ninth-graders in Germany. Results revealed differences in the text responses between the rounds of assessment in that students included more information overall in 2015, and the proportions of relevance varied substantially across items. As the study investigated the mode change in PISA’s natural (not experimental) setting, the differences could mirror cohort trends or design changes. However, with the evidence reported, we conclude that the differences could indicate mode effects.
1. Introduction
In 2015, the Programme for International Student Assessment (PISA) changed from paper- to computer-based assessment (OECD, Citation2016). Constituting a necessary innovation, this change also introduced uncertainty with respect to the comparability to former PISA rounds. Are trend results still interpretable? And does the change affect subgroups differentially? This study provides a new perspective for answering these questions.
The questions refer to what is commonly called mode effect. A mode effect is defined as
the “difference between the latent competencies of a test taker for two tests administered in different modes” (Kröhne & Martens, Citation2011, p. 174). On the basis of contradictory findings about mode effects, Kolen and Brennan (Citation2014) concluded that they are specific to each testing program and that mode equivalence must be proven for every test that is to be administered in multiple modes. For PISA, this is not only important with respect to trend reporting, but also because there are still a few countries that stick to the paper-based assessment (OECD, Citation2016). Thus, it is important to note that each new implementation comes with the risk of harming equivalence.
While our study analysed text responses, other studies on the effect of assessment modes usually investigate test scores (e.g. Wang, Jiao, Young, Brooks, & Olson, Citation2007), sometimes inspect their relation to test taker characteristics (e.g. Clariana & Wallace, Citation2002) or single items (e.g. Choi & Tinkler, Citation2002), or they make use of process data (e.g. Piaw, Citation2011; White, Kim, Chen, & Liu, Citation2015). Though text responses are a product, our study is associated with process data and additionally gives insights into a new source of information for large-scale assessments.
Text responses to open-ended questions constitute one of the final empirical observations during item completion. Thus, they fall under a broader interpretation of the definition of process data sensu Goldhammer and Zehner (Citation2017, p. 128): “empirical information about the cognitive […] states and related behavior that mediate the effect of the measured construct(s) on the task product (i.e. item score).” Although text responses do not give fine-grained temporal or spatial information on the evolution of the product, they do carry abundant information on the test taker’s judgement of what to express about their comprehension of the question and retrieval during the response process (Graesser & Clark, Citation1985; Graesser & Franklin, Citation1990; Tourangeau, Rips, & Rasinski, Citation2009). Process data are related to the task product (Goldhammer, Naumann, Rölke, Stelter, & Tóth, Citation2017) and can be used for validating test score interpretation (Ercikan & Pellegrino, Citation2015) or scoring for process-oriented constructs (e.g. collaborative problem solving; OECD, Citation2017a). Open-ended text responses, on the other hand, are the very basis for deriving an item score and, hence, are as closely related to the construct as the instrument itself. Therefore, meaningful differences in text responses between conditions map back to meaningful differences in the response process.
Making use of this relation, this study compared short text responses collected in the computer-based PISA 2015 to transcribed responses from the paper-based PISA 2012. For this, linguistic features of the text responses informed on the differences of the two response sets. While the mode of responding – keyboarding opposed to handwriting – is likely to have its distinct impact on the outcome, the reading process itself – in the form of decoding and comprehending – can be influenced by the assessment mode, too. For example, a literature review on digital and print reading reported an interaction between length of the text to be read and mode (Singer & Alexander, Citation2017). In this study, we argue that such effects can leave their imprint on the product and can, thus, be identified in linguistic response features.
PISA is initiated by the Organisation for Economic Co-operation and Development (OECD). Every three years since 2000, the study assesses reading, mathematical, and scientific literacy in 15-year-olds around the world. In 2008, its governing board declared the measurement of temporal trends to become the top priority (Mazzeo & von Davier, Citation2008). Now and then, this endeavour conflicts with the OECD’s necessary drive for innovation, given the natural development that a viable long-term study like PISA undergoes over 20 years. As PISA is not the only educational large-scale assessment shifting from paper- to computer-based assessment (e.g. Trends in International Mathematics and Science Study [TIMSS] and Progress in International Reading Literacy Study [PIRLS]), the question of instruments’ invariance across administration modes is omnipresent these days.
The OECD acknowledges the possibility of potential small to medium mode effects for PISA 2015 (OECD, Citation2016). For Germany indeed, Robitzsch et al. (Citation2017) found a small mode effect. In line with the literature (e.g. Wang et al., Citation2007), computer-based tasks turned out to be slightly more difficult at the aggregate level than their paper-based equivalents. While the OECD notes that their investigation of differential mode effects relied on preliminary field trial data (OECD, Citation2016), the present study additionally distinguished boys’ and girls’ responses as a showcase for potential differential relationships.
Given the data availability for reading literacy, this study illuminated the differences of text responses in Germany between PISA 2012 and 2015 in this domain. It is crucial to note that the results obtained from such a between-subject and non-experimental design, using non-equivalent groups, can be largely biased – for example, by cohort effects. Obviously, the study did not experimentally manipulate the mode for observing mode effects, but instead inspected relations accompanying a mode change in the natural setting of PISA. Thus, the reported differences in text responses across assessment rounds might be due to mode or cohort effects or even other study design changes. This is why we refer to round effects in our method and result reporting. Irrespective of the debate around the interpretability of PISA trends after the mode change, this study provides unique insights into how the response process is influenced across different rounds and modes of assessments.
The paper first depicts related works on mode effects, the reading gender gap, and response features. Then, it formulates the research hypotheses, which concern differences in selected response features between PISA 2012 and 2015 as well as across genders. The Methods section describes how software automatically extracted response features for informing Generalised Linear Mixed Models (GLMMs). Wrapping up, the paper contextualises the results in light of previous findings, the study’s strengths, and limitations.
2. Theoretical approach and related works
Text responses, opposed to scores, are abundant in information. This study embraces this information richness. As stated before, mode effects constitute differences in the testee’s latent competencies for two tests administered in different modes (Kröhne & Martens, Citation2011). While such shifts in the measured construct can be masked in test scores or process data, text responses now constitute an additional data point with the potential to reflect mode effects. This is particularly important because mode effects can be mediated through different components of the assessment – for example, at the perceptual level when reading on screen opposed to paper and then also during response production when typing opposed to writing. With text responses being close to the final response process, they constitute attractive data for capturing effects of the response modality change from handwriting to keyboarding.
The following theoretical sections work out the relevant components for spotting mode effects when analysing text responses. We proceed with (i) a brief description on what needs to be known about the assessment mode in PISA and the reading gender gap, then (ii) the identification of sources that can entail and the components that reflect mode effects, and finally, (iii) a brief description of the cognitive processes involved in answering a reading question and, on the basis of this, the identification of response features that are sensitive to the response process in a meaningful way.
2.1. PISA: assessment mode and the reading literacy gender gap
From 2000 to 2012, PISA assessed 15-year-olds in the main domains of reading, maths, and science using pen and paper. In 2015, the OECD decided to switch to a computer environment (OECD, Citation2016). Before, PISA had had a few extension studies in which it also used computer-based assessment, such as in the PISA 2009 electronic reading assessment (OECD, Citation2010). For the mode change, PISA countries conducted a randomised between-subjects mode effect study in the field trial. This experiment showed that some items’ functioning was dependent on the mode, but for most items, this was not the case. The employed statistical model took care of the affected items (OECD, Citation2017b).
The present study analyses German PISA data from the reading test in 2012 and 2015. The overall figure for Germany shows a steady improvement in reading literacy from below average performance from 2000 on, with 484 points, up to above average in 2012, with 508 points. With 509 points in 2015, this remained steady (Weis et al., Citation2016). The PISA scale’s mean is 500 points, and its standard deviation 100 points. Another monotone trend interrupted by PISA 2015 is the stable reading literacy gender gap in Germany, ranging from 40–44 points between 2003 and 2012 in favour of girls (2000: 34 points). In 2015, the gap in Germany decreased to 21 points (OECD, Citation2016). The OECD average gap also dropped slightly to 28 points, from 37 points in 2012.
At first sight, the mode change appears to be a likely cause for the rapid shift of a stable finding. However, the literature contains several contradicting findings. For example, Naumann and Sälzer (Citation2017) reported on the performance of students in Germany in digital reading literacy, an additional PISA domain in 2012. While the print-reading assessment revealed the 508 points mentioned above, the digital reading literacy in Germany was found to be 494 points with a gender gap of 40 points, in line with the print-reading gender gap. Another relevant point here is that other large-scale assessments – which were all paper-based so far – also find a consistent reading literacy gender gap, but with somewhat smaller effect sizes; for example, 16 points difference in the Progress in International Reading Literacy Study (PIRLS, ; Mullis, Martin, Foy, & Drucker, Citation2012) or the National Assessment of Educational Progress with
for fourth graders (National NAEP; NCES, Citation2015).
With all these slightly contradictory findings put together, no clear pattern has emerged so far of what the changes in PISA 2015 actually reflect – either the results represent true adverse effects in the population, or some changes in the assessment design led to a shift of the assessed construct. This study will not be able to give a definite answer, but it brings another source of information to the table that had not been accessible before. Something that can be learned from the recap above is that assessments are strongly dependent on certain design features (i.a. in line with Lafontaine & Monseur, Citation2009; Schwabe, McElvany, & Trendtel, Citation2015), leading us to the next section.
2.2. Components and sources of mode effects
Kröhne and Martens (Citation2011) identified two broad categories of sources of mode effects: properties of test administration (i.a. medium of administration and item layout) and test taker characteristics as interacting factor (i.a. test motivation). Therefore, both the item and the test taker level must be considered as moderating effects of a generic mode effect. PISA took mode effects at the item-by-country level in its scaling methodology into account, but explicitly aims to be sensitive to overall mode effects at the country level, because the ability to use ICT tools (information and communication technology) is considered to be part of the measured constructs (OECD, Citation2016).
One example of a test administration effect at the instrument level comes from Bridgeman, Lennon, and Jackenthal (Citation2001). They found a quarter standard deviation of difference in reading performance for different screen resolutions. Other effect sources at the test administration level comprise the necessary adaptation of the item layout, different response modes and input devices, the need for splitting texts onto multiple screens or scrolling, as well as speeding (Kröhne & Martens, Citation2011). For the PISA adaptation, the adaptation of item layouts was an especially crucial point – sometimes, texts were set in small font sizes in order to fit the screen or they were split onto multiple pages.
On the other side, Kröhne and Martens (Citation2011) emphasised effects on the test taker level that can introduce differential mode effects: different levels of motivation for different test takers (e.g. Goldhammer, Martens, & Lüdtke, Citation2017), induced by the different forms of assessments (e.g. Eklöf & Knekta, Citation2017); familiarity with computers; and demographics. As described in the previous section, for PISA, the genders are an obvious start for investigations as there are first hints that something has changed for the two subgroups alongside the two last rounds of assessment.
Given the large amount of equivalence studies, the literature also offers several meta analyses. An early one by Mead and Drasgow (Citation1993) found only small effects for power tests, but remarkable effects for speeded tests. A more recent meta analysis systematises the contradicting findings of mode effect studies further by explaining the entire variance in effect sizes by study design (random vs. non-random), sample size, test assembly (linear vs. adaptive), and test takers’ computer practice (Wang et al., Citation2007). Most interesting for the present study is the meta analysis by Noyes and Garland (Citation2008), who focussed on several facets of reading. While some studies provide inconsistent results, screen reading is still found to be slower, compared to paper reading, while text comprehension is equivalent, just like eye movement patterns appear to be.
Briefly summarising potential sources for changes between PISA 2012 and 2015, the assessment mode is not the only candidate, but is the most promising one, including on-screen reading, computer navigation, and keyboarding. Besides this, changes can also reflect true changes in the population or further study design changes. For example, PISA 2015 substantially increased the number of test booklets. Also, it re-introduced a compulsory break for students after having completed the first half of the assessment. The following section derives linguistic text response features that have the potential of indicating changes in the response process like described so far.
2.3. The response process and its indicative features
In this subsection, we first briefly sketch the cognitive processes taking place during answering a reading test question Zehner, Goldhammer, and Sälzer (Citation2018). Then, we derive two response features that relate crucially to the response process on the basis of this. In the PISA reading test, the stimulus text exposes the test taker to a representative reading opportunity (e.g. reading a newspaper article), and the question (often called item) then asks for information from or reflection on the stimulus text.
When students are asked to read a stimulus text, they build – on basis of the text – a mental representation, which consists of propositions. It is called the situation model (Kintsch & van Dijk, Citation1978). According to the theoretical framework compiled by Zehner et al. (Citation2018), the next phase in answering a reading test question is described by the QUEST model (Graesser & Franklin, 1990). The QUEST model states that respondents would first identify three aspects: (i) the question category (e.g. WHY- or WHO-question; Graesser & Clark, Citation1985), (ii) the semantic focus (Is a state, action, or event at the centre of the question?), and (iii) the question focus (Which propositions of the question are most relevant?). Next, the respondent recalls knowledge from memory according to the question focus; for this, the just built situation model serves as one (episodic) memory structure (Zehner et al., Citation2018). The retrieved propositions are then winnowed down by relevance, determined by the previously identified question category and semantic focus. This means, the entire set of candidate propositions are filtered so that only relevant propositions are left that fit the question category and semantic focus (e.g. WHO<event>: Who cries?). The final set of propositions serves as the respondent’s solution. At last, the respondent concatenates the final propositions for crafting the response (Graesser & Murachver, Citation1985), then writes or types it.
In contrast to previous PISA rounds, the students now type their response. This new input modality is prone to making a difference in the responses. A recent meta-analysis showed (Feng, Lindner, Ji, & Malatesha Joshi, Citation2017) that writing fluency is (only) moderately related between handwriting and keyboarding as was the writing speed; the accuracy of the writing, however, was not significantly correlated across the modes. A NAEP study (White et al., Citation2015) found that American eighth graders wrote twice as much in a writing task on a computer than using pen and paper.
The entire response process is iterative, and the phases interact with each other. For example, while writing the response, the respondents can experience memory interferences (e.g. forget what they actually intended to respond, when struggling with the spelling of a word), or they start to reconsider their solution while writing.
This study extracted two linguistic response features. Both are based on what we call Proposition Entities. This concept is based on a theory called situation model. By means of this model, Kintsch and van Dijk (Citation1978) could predict the probabilities of information recall. Also, reading literacy relates to how easily readers can access propositions from memory and how successful they are in reconstructing missing information. In this study, we use linguistic product features as dependent variables, considering them to be imprints of the response process. The Proposition Entity Count (PEC), serving as the first response feature, captures the number of proposition elements that are incorporated into a response. For this, words of selected parts of speech are regarded as proposition elements that genuinely refer to parts of the situation model. For example, verbs and nouns (e.g. bullied, school) are considered proposition entities, whereas auxiliary verbs and articles (e.g. can, the) are not, because they do not add crucial information to what is being referred to. The measure is strongly related to response length, which has been used as a measure for mode effects before (Horkay, Bennett, Allen, Kaplan, & Yan, Citation2006), but it is not as superficial and cleans the measure for construct-irrelevant, linguistic artefacts. This kind of atomic proposition extraction has similarly been employed in another system called CPIDR, which computes a text’s proposition density (Brown, Snodgrass, Kemper, Herman, & Covington, Citation2008).
A second central key in the process is the winnowing down of relevant propositions according to the QUEST model. Our second measure Relevance Proportion (Rel) captures the proportion of relevant information in a response for responding correctly. The Method Section specifies how the two measures are engineered.
3. Research questions and hypotheses
Based on the idea that differences in the response features mirror differences in the response process, the analysis tests the following hypotheses – or answers exploratory research questions, respectively – for each of the two features PEC (information quantity) and Rel (relevance proportion) acting as dependent variables, respectively. The research questions and hypotheses are denoted as P1–3a/b for PEC and R1–3a/b for Rel.
P1|R1 Response Correctness Effect. According to previous findings (Zehner et al., Citation2018), we expect PEC to be positively related to response correctness (P1). It lies in the nature of Rel that the very same is true for the second response feature (R1).
P2a|R2a Round Effect. According to previous findings (Horkay et al., Citation2006; White et al., Citation2015), we expect responses from PISA 2015 to show a higher PEC than those from PISA 2012 if the assessment mode affects the response process. Considering the possibility of differing response processes across the rounds of assessment, we also expect Rel to differ between responses from 2012 and 2015.
P2b|R2b Item-specific Round Effect. Since items differ strongly in the kind of response processes they evoke, we expect the round effect on PEC and on Rel to vary across items.
P3a|R3a Gender Effect. According to previous findings (Zehner et al., Citation2018), we expect girls to show a higher PEC and higher Rel than boys.
P3b|R3b Gender-Specific Round Effect. Exploratorily checking for differential relationships, we examine whether the round effects on PEC and Rel vary across the genders. Also, in the sense of Kröhne and Martens (Citation2011), we consider item-specific variations of this differential relationship.
4. Method
4.1. Participants, procedure, and materials
The study made use of two German samples from different rounds of PISA. In 2012, students from
schools received paper-based tests (details at Prenzel, Sälzer, Klieme, & Köller, Citation2013).Footnote1 In 2015,
students from
schools received computer-based tests (details at Reiss, Sälzer, Schiepe-Tiska, Klieme, & Köller, Citation2015). Both samples comprise 15-year-olds, representative of the PISA population in Germany, and ninth graders, drawn from the German modal grade for 15-year-olds. Since
transcribed responses to eight dichotomous reading literacy items were available from the paper-based assessment in 2012,
responses to the same items from the computer-based assessment in 2015 were used, resulting in a total of
observations. The sample sizes between the rounds of assessment differ largely because of different test designs. Due to missing gender information, one student with five responses had to be excluded from the analysis. Empty responses were included in the analysis as their linguistic features could still be computed.
shows a sample PISA reading stimulus text and item as it would appear in the paper- and the computer-based modes (adapted from OECD, Citation2006, p. 59f.). Due to confidentiality, neither the actual units, nor the responses can be disclosed. An exemplary correct response to the sample item would be “To show how far bullying can go.” (OECD, Citation2006, p. 60). We need to stress that the eight items included in the study resemble perfectly traditional items; there is always a text that the students read, followed by several questions about the text.
Figure 1. Sample PISA stimulus and item in computer- (top) and paper-based mode (bottom; adapted from OECD, Citation2006, p. 59f.)
4.2. Linguistic feature extraction
For extracting features of the students’ text responses, the program ReCo (Automatic Response Coder) was used with its pre-built vector space models for the eight PISA items (Zehner, Sälzer, & Goldhammer, Citation2016). The methodological approach described in Zehner et al. (Citation2018) was followed, which should be referred to for any details on what is described in this subsection. Each vector space model was built in a Latent Semantic Analysis (Deerwester, Dumais, Furnas, Landauer, & Harshman, Citation1990) and constitutes a dictionary-like database in which each word of a text corpus (here, the German Wikipedia) has a 300-dimensional vector, representing the word’s semantics. The most important point about the approach is that words with vectors pointing into similar directions are considered semantically similar. The student responses were first preprocessed (i.a. split into words), normalised (i.a. spelling correction, stemming), and annotated with their parts of speech (e.g. can as auxiliary verb; cf. Schiller, Teufel, Stöckert, & Thielen, Citation1999).
For measuring information quantity, the Proposition Entity (PE) Count was used (PEC). It selects and counts words, determined by their part of speech, that genuinely add to what is being referred to in the situation model (i.a. nouns, pronouns, non-auxiliary verbs, adjectives, and linguistic answer particles).
As the second central response feature, the proportion of relevant information was assessed (Rel). For this, (i) each PE in the response is compared to all PEs in correct reference responses in the item’s coding guide, (ii) relevance is computed as the maximum cosine similarity between these, (iii) entities with a similarity value ranging within the distribution’s lower 25 percent are classified as irrelevant, and finally, (iv) the relative frequency of relevant PEs in the response, compared to the total count, is computed.
4.3. Generalised linear mixed models with crossed random effects
While responses were the observational unit of interest in this study, they were nested within students and items, whereas different students had completed different test assemblies. Students had either received a computer- or paper-based test, and they were nested within schools. For modelling the relations between the rounds of assessment, genders, the response correctness, and the response feature Rel, Linear Mixed Models (LMMs) with fixed effects were specified, taking the nested and crossed structure of the data through crossed random effects into account (Baayen, Davidson, & Bates, Citation2008). The same models were specified for PEC, but estimated as Generalised Linear Mixed Models (GLMMs) with a Poisson distribution due to its count nature (cf. Stroup, Citation2012).
Briefly sketched, (G)LMMs allow to model linear relationships between at least one independent (here, round of assessment among others) and one dependent variable (here, PEC or Rel), while the impact of the independent variables can be set to be estimated as a constant (called fixed effects) or to allow variation at different units of observation (called random effects). The different units of observation could, for example, correspond to test takers, assessment mode, or schools. While, for example, one model could be estimated that assumes a constant impact of the mode on the test score across all participants (fixed effect), another model could be computed allowing to estimate the mode’s impact differently across items (random by-item effect). Another methodological highlight of GLMMs is the inclusion of a link function for taking specific distributional properties into account.
For the sake of simplicity of the following, the dependent variables PEC and Rel are both described as , whereas
.
Four models with increasing complexity were specified for both response features. The models’ goodness of fit are reported on the basis of the -distributed Likelihood Ratio test statistic (LRT), Akaike Information Criterion (AIC), and Bayesian Information Criterion (BIC). Marginal and conditional
are reported where available (Nakagawa, Schielzeth, & O’Hara, Citation2013); similarly to
for simple linear models, the conditional
indicates the proportion of explained variance by both the fixed and random effects, and marginal
gives the proportion of explained variance by the fixed effects only. Model (1) served as the baseline, only modelling the structure of the data.
In this model, the response feature (either PEC or Rel) was estimated for student
from school
, who responded to item
. It was decomposed into the following components:
fixed intercept
random by-student intercept
: a student’s tendency to include, for PEC, more pieces of information or, for Rel, relatively more relevant information
random by-item intercept
random by-school intercept
Model (2) tested Hypothesis 1 and added one fixed effect of response correctness
to Model (1).
Testing Hypotheses 2a and 2b, Model (3) added to Model (2):
fixed effect
random by-item effect of round of assessment
The final Model (4) tested Hypothesis 3a and helped to explore research question 3b by adding onto Model (3):
fixed effect
fixed effect
random by-item effect of gender
The distribution of the random effects was modelled as a multivariate normal distribution;
with
as the covariance matrix of the random effects. PEC’s probability distribution was modelled as a Poisson distribution (cf. Stroup, Citation2012), PEC
, with
as the mean. Likewise, Rel’s probability distribution was modelled as a normal distribution, Rel
, with
as the mean and
as the variance. The coefficients were estimated using Maximum Likelihood (ML) Estimation (Laplace approximation) for the GLMM and Restricted Maximum Likelihood (REML) Estimation for the LMM.
4.4. Software
ReCo (Zehner et al., Citation2016), with its many software components, extracted the response features: DKPro Core (Gurevych et al., Citation2007), DKPro Similarity (Bär, Zesch, & Gurevych, Citation2013), JWPL (Zesch, Müller, & Gurevych, Citation2008), S-Space (Jurgens & Stevens, Citation2010), Snowball (Porter, Citation2001), Stanford NLP Parser (Rafferty & Manning, Citation2008).
The statistical analyses were carried out in R 3.4.3 (R Core Team, Citation2017), using snow for parallel computations (Tierney, Rossini, Li, & Sevcikova, Citation2016), lme4 (Bates, Mächler, Bolker, & Walker, Citation2015) for GLMM estimation, and r2glmm (Jaeger, Citation2017)as well as MuMIn (Barton, Citation2017) for computing .
5. Results
5.1. Proposition entity count
displays the results for the four GLMMs on information quantity in the responses (PEC). Among others, the table displays the marginal , which is the portion of variance explained only by the fixed effects in the model.Footnote2 While response correctness explains some more variance of PEC (
), including the fixed round effect adds 1.5 percent of explained variance, and including gender and their interaction adds another 1.4 percent. This shows a small level of contribution of the fixed effects. Note that the random effects are not included in the coefficient. This means that relationships that vary across items are not captured as systematic variance in
. Proposition Entity Count (PEC): Generalised Linear Mixed Models (1)–(4)
Table 1. Proposition entity count (pec): generalised linear mixed models (1)–(4)
In Model (4), comprising all effects of interest, the estimates for the fixed effects all differ significantly from 0. Hypothesis P1 can be confirmed as the response correctness has a significant influence; indeed, it has the largest impact on information quantity, Footnote3 (
). Hypothesis P2a can also be confirmed as the round of assessment (possibly, cohort and/or mode) has a significant, the second largest, impact;
(
). As for P2b, the round’s impact does additionally vary across items,
, and correlates highly with the item intercept,
. The comparison of this model with a restricted version – excluding the random round effect – mirrors a significant gain in the model fit;
. That is, items that generally evoke a higher information quantity were doing so even more in PISA 2015 than in 2012. A closer look reveals that this correlation is heavily influenced by one item acting as an outlier compared to the other item effects, but the coefficient still remains moderate after omitting the outlier,
. Confirming Hypothesis P3a, the fixed effect of gender is just as much related to PEC as the round of assessment;
(
). Again, the random effect – here, gender – correlates significantly and highly with the item intercept;
,
. This means, items that generally evoke higher information quantity in responses are also affected more strongly by the gender effect (higher information quantity by girls). With respect to the exploratory Research Question P3b, the variation of the gender effect across items is smaller
, but its correlation with the random round effect is high,
. That is, items with a larger round effect also tended to show a correspondingly larger gender effect. Finally, the fixed interaction of these two,
, is significant (
), though hardly of any practical importance considering the low estimate. For Model (4), all estimates of fixed effects as well as the variance of random effects and their correlations can be found in the Appendix .
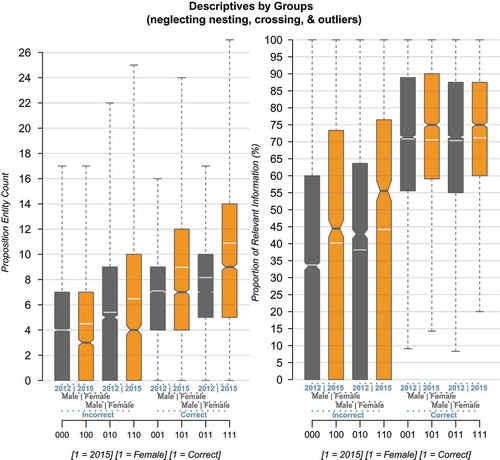
For providing a better understanding of the pertinence and the magnitude of the differences between the groups and conditions, shows the descriptives for the data scale, opposed to the non-interpretable model scale of the GLMM coefficients. Note that these descriptives are flawed and possibly misleading, because they neglect the nesting and crossing (of students and items). But to give an impression of the differences, the figure shows for example that, on average, correct girl responses from 2015 contained about two more PEs than in 2012 as well as the general tendency of including more PEs in 2015 than in 2012 within groups.
Figure 2. Descriptives (without outliers) of the response features PEC (information quantity, left) & Rel (relevance proportion, right). The descriptive differences provide a coarse impression of the differences’ magnitudes. The transparent white line indicates the mean in addition to the median for each group
5.2. Relevance
depicts the results for the four LMMs on the proportion of relevant information in the responses (Rel); among others, the conditional (including fixed and random effects) and marginal
(including only fixed effects). The random effects in the baseline Model (1) explain 38 percent of the relevance proportion’s variance, while the inclusion of further fixed, and also random, effects increases
to 44 percent of explained variance in Model (4). Opposed to this, the marginal
shows that the fixed effect of response correctness alone explains 21 percent more of the dependent variable’s variance, whereas the effects of interest – round and gender – contribute significantly, but not substantially to explaining the variance in Rel overall. The odd decrease in
might be due to a slight increase of the variance components through the addition of further variables to the model. On the other hand, the restricted models’ conditional
shows that the round effect really comes into play at the item level as the inclusion of its random effects increases
by 2 percent (cf. line w/o | Round in ).
Table 2. Relevance measure (Rel): linear mixed models (1)–(4)
Similar to the information quantity model, the most important fixed effect in Model (4) for the relevance measure is response correctness, , confirming hypothesis R1. But in contrast to PEC, all other fixed effects on relevance do not differ significantly from 0. The largest coefficient is the fixed round effect with
, followed by gender,
, and the interaction between the two without any impact,
. Therefore, R2a and R3a – hypothesising aggregated effects – had to be rejected.
The random by-item effect of round of assessment on relevance does show a large variation with . The estimates range from
, corresponding to a reduced proportion of 7 percent relevance for this item in 2015, to
, corresponding to an increased proportion of 18 percent relevance for this item in 2015. These effects were masked at the aggregated level. Worth noting is also the significant, moderate, negative correlation between the random by-item effect of round and random by-item intercept,
. That is, items generally evoking a larger proportion of relevant information in responses tended to have a smaller or negative round effect and vice versa. This relationship is displayed in , confirming hypothesis R2b. On the other hand, while the item-specific variation of the gender effect is somewhat lower but still practically relevant,
, evidence for the exploratory Research Question R3b comes from the moderate correlation between the item-specific gender effect and the item-specific round effect,
. The latter indicates that the effect of gender and round of assessment on the proportion of relevant information go hand in hand – similar to PEC, items showing a larger gender effect analogously show a larger round effect. For Model (4), all estimates of fixed effects as well as the variance of random effects and their correlations can be found in the Appendix Table A2.
Figure 3. Relationship of the random by-item round effect and item intercepts: items evoking relatively less relevant responses are more likely to have this compensated in 2015
6. Discussion
The study adds a new perspective to the debate on the impact of the mode of test administration in large-scale assessments. While text responses, as largely unstructured information, were an inaccessible source of information beyond scoring hitherto, modern natural language processing techniques can help to show whether response processes differ across different rounds of assessment, possibly induced by study design changes. Hence, this study brings us closer to answering the two big introductory questions: Can we still interpret the PISA (reading) trend? And might subgroups be differentially affected?
In this study, we compared German text responses to reading items from PISA 2012 to 2015. These PISA rounds came with several changes in the study design – the shift from paper- to computer-based assessment being a dominant one. As different PISA rounds assess different students, the reported findings can possibly be biased by true cohort effects. That would be the case if the level of students in Germany indeed changed substantially in reading literacy and related processes from 2012 to 2015. Because of this, we use the generic term round effects rather than mode effects in this study. Two response features, constituting crucial indicators for the response process, were compared across rounds of assessment and genders, the latter showcasing potential differential trends for subgroups. Since the analysed text responses were observed in a nested and crossed structure across students, schools, items, and the round of assessment, (Generalised) Linear Mixed Models (GLMMs) were used to show the relationship between the round of assessment and (i) the text responses’ amount of genuine information (PEC; Proposition Entity Count) as well as (ii) their proportion of relevance (Rel).
The results showed that, for the analysed items, the response processes differed substantially between PISA 2012 and 2015. In purely descriptive terms, responses in 2015 contained 1.8 more proposition entities and a proportion of relevant proposition entities larger by 3 percent. This constitutes a small difference from a practical point of view, but the GLMMs disentangle these coarsely aggregated figures and show that differences in the response process between the rounds of assessment vary across items and can be masked in the aggregated scheme. Therefore, changes in the study design, possibly the switch from paper- to computer-based assessment, might have impacted the response process and, hence, altered the assessed construct.
The remaining doubt about the most prominent potential bias of this interpretation is the cohort change. However, this doubt is diminished by considering the findings of the German IQB National Assessment Study 2015 in paper-based reading (Stanat, Böhme, Schipolowski, & Haag, Citation2016). It addressed the same population and found a slightly increased gender gap in reading compared to 2012, running counter to the decreased gender gap reported by PISA 2015. With this additional thought in mind, PISA’s reading gender gap decrease should not be a cohort effect in Germany, which reduces the pool of potential sources.
The changes in the response process indicated by text responses go largely unnoticed so far in assessment research and, hence, constitute unattended consequences of changes in the study design. The findings are in line with those of the few previous studies (Horkay et al., Citation2006; White et al., Citation2015), showing that adolescents write more on the computer than on paper. On top, our study shows that this is not only a linguistic artefact, but the additional words also add genuine information to the response. And while students write longer responses on the computer, these show slightly higher percentages of relevant information on average.
At first sight, the finding of longer and more relevant responses seems contradictory to previous findings that tasks become more difficult on the computer (Kolen & Brennan, Citation2014; Robitzsch et al., Citation2017). However, a more detailed look at the variation of the effects across items puts this in a different light, in line with the inconsistent findings of mode effect studies. With respect to the percentage of correct responses, there might be a negative trend for computer-based assessment, but there is a strong item dependency of whether a computer-based item is more or similarly difficult or even easier. This is also true for PISA (cf. Annex 6 in OECD, Citation2016). Obvious in findings from reading research, several components of mode effects might come into play with the shift from paper to computer: Screen reading is assumed to be slower, but overall comprehension is similarly accurate (Noyes & Garland, Citation2008), whereas the new input mode of typing has only a moderate correlation to handwriting with respect to writing fluency and speed, but none to writing accuracy (Feng et al., Citation2017). Particularly the latter can serve as a plausible explanation for differences found in text responses across test modes.
The discussed item specificity also plays a central role for summarising the study's key findings. Briefly put, response correctness has the expected large impact on information quantity and relevance. On the aggregated level, round and gender only showed an impact on quantity, but not on relevance, although the data revealed substantial effects on both quantity and relevance at the item level. This means, characteristics of single items can moderate mode effects. For both response features, gender and round effects were positively related to the items’ general tendency of evoking more or less relevant information or quantity. That is, if there is a larger round effect, the gender effect is more likely to be larger, too, and vice versa. Thus, there seem to be specific items that are sensitive to differential effects that need to be addressed. The good news is that these effects are largely balanced in the analysed item subset and seem to be so in PISA’s item pool. Nevertheless, further knowledge about item characteristics’ relations to such effects are essential for guaranteeing equivalence between PISA countries assessing in paper- and computer-based mode as well as for further stable trend reporting, if the current balance at the scale level is to be retained. This is of particular importance because differential effects are easily overseen or even intentionally ignored (OECD, Citation2016, Annex 6). And the gender effects are only one showcase for a typical split, whereas educational monitoring relies tremendously on the reporting of outcomes by plain group splitting.
In conclusion, the study aids in answering the posed questions. On the aggregated level, there seem to be small changes that might not harm PISA trend interpretation too much. However, the virtual balance seems to be the result of chance, since different trends could be observed across items and subgroups. This shows that trend interpretation for subgroups requires careful contextualisation with further fixed data points because design changes – such as mode or item selection – entail unattended consequences. This study cannot give a definitive answer as to whether the mode is the origin for the observed trends, but it shows a development of relevant features in a new data source.
The limitations of this study are the between-subject design without an experimental manipulation, the temporal delay with multiple design changes between the assessments, and the small sample size of the second round of assessment, which reduced the power to detect round effects. Also, the response features are yet to be validated. The conclusions drawn are constrained to the PISA reading assessment and the German subpopulation. The study results are only one further indication of mode effects in PISA, and the necessary experimental mode effect study is being conducted in Germany together with PISA 2018. Overall, the results clearly show how innovative processing of text responses can provide new insights beyond the common reduced score information in educational large-scale assessments.
Disclosure statement
No potential conflict of interest was reported by the authors.
Additional information
Notes on contributors
Fabian Zehner
Fabian Zehner is a senior psychometrician at the German Institute for International Educational Research (DIPF), Centre for Technology Based Assessment (TBA). He received his PhD from the Technical University of Munich, Germany, for a dissertation centering around the automatic processing of open-ended text responses in educational large-scale assessments. His major research focuses include the application of natural language processing techniques and machine learning in assessments, assessment instruments employing innovative technologies, and the construction of psychological and educational assessments.
Frank Goldhammer
Frank Goldhammer is head of the Centre for Technology Based Assessment (TBA) at the German Institute for International Educational Research (DIPF) and professor for Educational and Psychological Assessment (Technology-Based Assessment and Instruction) at the Goethe University Frankfurt a. M. and the Centre for International Student Assessment (ZIB). His research interests include technology-based assessment (e.g., validation), the analysis of process data from cognitive assessments, modelling response times, as well as digital skills and motivational context variables.
Emily Lubaway
Emily Lubaway holds a Master of Education from the Technical University of Munich, Germany, in Research on Teaching and Learning. She is currently a Senior Research Assistant at Educational Testing Service (ETS) in the work-group that oversees the design and evaluation of international large-scale assessments, including the Programme for International Student Assessment (PISA) and the Programme for the International Assessment Adult Competencies (PIAAC).
Christine Sälzer
Christine Sälzer is a professor in education at the University of Stuttgart, Germany. Having been the national project manager for PISA in Germany over seven years, professor Sälzer focuses on making large scale student assessments accessible to future teachers. Her main research interests are large scale assessments, competence modelling, school absenteeism and students with special educational needs.
Notes
1. Note that both sample sizes refer to the subsets of students for which text responses to the investigated items were available.
2. The conditional , which includes both fixed and random effects, could not be computed for the non-Gaussian model. For making sure the model is worth investigating, we computed the Gaussian equivalent of the final model, which shows identical
for all fixed effects and an
of
.
3. The brackets indicate 95% confidence intervals.
Related Research Data
References
- Bär, D., Zesch, T., & Gurevych, I. (2013). DKPro Similarity: An open source framework for text similarity. In Proceedings of the 51st Annual Meeting of the Association for Computational Linguistics: System Demonstrations (pp. 121–126). Sofia, Bulgaria: Association for Computational Linguistics.
- Baayen, R. H., Davidson, D. J., & Bates, D. M. (2008). Mixed-effects modeling with crossed random effects for subjects and items. Journal of Memory and Language, 59(4), 390–412.
- Barton, K. (2017). MuMIn: Multi-model Inference. Retrieved from https://CRAN.R-project.org/package=MuMIn
- Bates, D., Mächler, M., Bolker, B., & Walker, S. (2015). Fitting linear mixed-effects models using lme4. Journal of Statistical Software, 67(1), 1–48.
- Bridgeman, B., Lennon, M. L., & Jackenthal, A. (2001). Effects of screen size, screen resolution, and display rate on computer-based test performance (RR-01-23 ed.). Princeton, NJ: Educational Testing Service.
- Brown, C., Snodgrass, T., Kemper, S. J., Herman, R., & Covington, M. A. (2008). Automatic measurement of propositional idea density from part-of-speech tagging. Behavior Research Methods, 40(2), 540–545.
- Choi, S. W., & Tinkler, T. (2002). Evaluating comparability of paper-and-pencil and computer- based assessment in a K-12 setting. In Annual meeting of the national council on measurement in education. New Orleans, LA: NCME.
- Clariana, R., & Wallace, P. (2002). Paper-based versus computer-based assessment: Key factors associated with the test mode effect. British Journal of Educational Technology, 33(5), 593–602.
- Deerwester, S., Dumais, S. T., Furnas, G. W., Landauer, T. K., & Harshman, R. (1990). Indexing by latent semantic analysis. Journal of the American Society for Information Science, 41(6), 391–407.
- Eklöf, H., & Knekta, E. (2017). Using large-scale educational data to test motivation theories: A synthesis of findings from Swedish studies on test-taking motivation. International Journal of Quantitative Research in Education, 4(1/2), 52.
- Ercikan, K., & Pellegrino, J. W. (2015). Validation of score meaning for the next generation of assessments: The use of response processes. London: Taylor and Francis.
- Feng, L., Lindner, A., Ji, X. R., & Malatesha Joshi, R. (2017). The roles of handwriting and keyboarding in writing: A meta-analytic review. Reading and Writing, 85, 1–31.
- Goldhammer, F., Martens, T., & Lüdtke, O. (2017). Conditioning factors of test-taking engagement in PIAAC: An exploratory IRT modelling approach considering person and item characteristics. Large-Scale Assessments in Education, 5(1), 18. Retrieved from https://doi.org/10.1186/s40536-017-0051-9.
- Goldhammer, F., Naumann, J., Rölke, H., Stelter, A., & Tóth, K. (2017). Relating product data to process data from computer-based competency assessment. In D. Leutner, J. Fleischer, J. Grünkorn, & E. Klieme (Eds.), Competence assessment in education: Research, models and instruments (pp. 407–425). Cham: Springer International Publishing. Retrieved from https://doi.org/10.1007/978-3-319-50030-0_24
- Goldhammer, F., & Zehner, F. (2017). What to make of and how to interpret process data. Measurement: Interdisciplinary Research and Perspectives, 15(3–4), 128–132.
- Graesser, A. C., & Clark, L. F. (1985). Structures and procedures of implicit knowledge (Vol. 17). Norwood, N.J.: Ablex.
- Graesser, A. C., & Franklin, S. P. (1990). QUEST: A cognitive model of question answering. Discourse Processes, 13(3), 279–303.
- Graesser, A. C., & Murachver, T. (1985). Symbolic procedures of question answering. In A. C. Graesser & J. Black (Eds.), The psychology of questions (pp. 15–88). Hillsdale, N. J: Erlbaum.
- Gurevych, I., Mühlhäuser, M., Müller, C., Steimle, J., Weimer, M., & Zesch, T. (2007). Darmstadt knowledge processing repository based on UIMA. In Proceedings of the First Work- shop on Unstructured Information Management Architecture at Biannual Conference of the Society for Computational Linguistics and Language Technology. Tübingen, Germany.
- Horkay, N., Bennett, R. E., Allen, N., Kaplan, B., & Yan, F. (2006). Does it matter if I take my writing test on computer? An empirical study of mode effects in NAEP. Journal of Technology, Learning, and Assessment, 5 (2).
- Jaeger, B. (2017). r2glmm: Computes R squared for mixed (multilevel) models. Retrieved from https://CRAN.R-project.org/package=r2glmm
- Jurgens, D., & Stevens, K. (2010). The S-Space package: An open source package for word space models. In Association for Computational Linguistics (Ed.), 48th Annual Meeting of the Association for Computational Linguistics (pp. 30–35).
- Kintsch, W., & van Dijk, T. A. (1978). Toward a model of text comprehension and production. Psychological Review, 85(5), 363–394.
- Kolen, M. J., & Brennan, R. L. (2014). Test equating, scaling, and linking: Methods and practices. (3rd. ed.). New York, NY: Springer.
- Kröhne, U., & Martens, T. (2011). Computer-based competence tests in the National educational panel study: The challenge of mode effects. Zeitschrift für Erziehungswissenschaft, 14(S2), 169–186.
- Lafontaine, D., & Monseur, C. (2009). Gender gap in comparative studies of reading compre- hension: To what extent do the test characteristics make a difference? European Educational Research Journal, 8(1), 69–79.
- Mazzeo, J., & von Davier, M. (2008). Review of the Programme for International Student Assessment (PISA) test design: Recommendations for fostering stability in assessment results. Education Working Papers EDU/PISA/GB (2008), 28, 23–24.
- Mead, A. D., & Drasgow, F. (1993). Equivalence of computerized and paper-and-pencil cognitive ability tests: A meta-analysis. Psychological Bulletin, 114(3), 449–458.
- Mullis, I. V. S., Martin, M. O., Foy, P., & Drucker, K. T. (2012). PIRLS 2011 international results in reading. Chestnut Hill, MA: Boston College.
- Nakagawa, S., Schielzeth, H., & O’Hara, R. B. (2013). A general and simple method for obtaining R2 from generalized linear mixed-effects models. Methods in Ecology and Evolution, 4(2), 133–142.
- Naumann, J., & Sälzer, C. (2017). Digital reading proficiency in German 15-year olds: Evidence from PISA 2012. Zeitschrift für Erziehungswissenschaft, 20(4), 585–603.
- NCES. (2015). The nation’s report card: 2015 mathematics and reading assessments. Retrieved 16.01.2016, from http://www.nationsreportcard.gov/reading_math_2015
- Noyes, J. M., & Garland, K. J. (2008). Computer- vs. paper-based tasks: Are they equivalent? Ergonomics, 51(9), 1352–1375.
- OECD. (2006). PISA released items - reading. Retrieved 18.02.2016, from http://www.oecd.org/pisa/38709396.pdf
- OECD. (2010). PISA 2009 assessment framework: Key competencies in reading, mathematics and science. Paris: OECD Publishing.
- OECD. (2016). PISA 2015 results (volume I). Paris: OECD Publishing.
- OECD. (2017a). PISA 2015 assessment and analytical framework: Science, reading, mathematic, financial literacy and collaborative problem solving. Paris: OECD Publishing.
- OECD. (2017b). PISA 2015 technical report. Paris: OECD Publishing.
- Piaw, C. Y. (2011). Comparisons between computer-based testing and paper-pencil testing: Testing effect, test scores, testing time and testing motivation. In Proceedings of the Informatics Conference (pp. 1–9).
- Porter, M. (2001). Snowball: A language for stemming algorithms. Retrieved from http://snowball.tartarus.org/texts/introduction.html
- Prenzel, M., Sälzer, C., Klieme, E., & Köller, O. (Eds.). (2013). PISA 2012: Fortschritte und Herausforderungen in Deutschland. Münster: Waxmann.
- R Core Team. (2017). R: A language and environment for statistical computing. Vienna. Retrieved from http://www.R-project.org/
- Rafferty, A. N., & Manning, C. D. (2008). Parsing three German treebanks: Lexicalized and unlexicalized baselines. In Proceedings of the Workshop on Parsing German (pp. 40–46).
- Reiss, K., Sälzer, C., Schiepe-Tiska, A., Klieme, E., & Köller, O. (Eds.). (2016). PISA 2015: Eine Studie zwischen Kontinuität und Innovation. Münster: Waxmann.
- Robitzsch, A., Lüdtke, O., Köller, O., Kröhne, U., Goldhammer, F., & Heine, J.-H. (2017). Herausforderungen bei der Schätzung von Trends in Schulleistungsstudien [Challenges for Trend Estimation in Educational Assessments]. Diagnostica, 63(2), 148–165.
- Schiller, A., Teufel, S., Stöckert, C., & Thielen, C. (1999). Guidelines für das Tagging deutscher Textkorpora mit STTS. University of Stuttgart and University of Tübingen.
- Schwabe, F., McElvany, N., & Trendtel, M. (2015). The school age gender gap in reading achievement: Examining the influences of item format and intrinsic reading motivation. Reading Research Quarterly, 50(2), 219–232.
- Singer, L. M., & Alexander, P. A. (2017). Reading on paper and digitally: What the past decades of empirical research reveal. Review of Educational Research, 87(6), 1007–1041.
- Stanat, P., Böhme, K., Schipolowski, S., & Haag, N. (Eds.). (2016). IQB-Bildungstrend 2015: Sprachliche Kompetenzen am Ende der 9. Jahrgangsstufe im zweiten Ländervergleich. Münster and New York: Waxmann.
- Stroup, W. W. (2012). Generalized Linear Mixed Models: Modern concepts, methods and applications. Hoboken: CRC Press.
- Tierney, L., Rossini, A. J., Li, N., & Sevcikova, H. (2016). Snow: Simple network of workstations. Retrieved from https://CRAN.R-project.org/package=snow
- Tourangeau, R., Rips, L. J., & Rasinski, K. A. (2009). The psychology of survey response (10th print ed.). Cambridge: Cambridge Univ. Press.
- Wang, S., Jiao, H., Young, M. J., Brooks, T., & Olson, J. (2007). Comparability of computer- based and paper-and-pencil testing in K–12 reading assessments. Educational and Psychological Measurement, 68(1), 5–24.
- Weis, M., Zehner, F., Sälzer, C., Strohmaier, A., Artelt, C., & Pfost, M. (2016). Lesekompetenz in PISA 2015: Ergebnisse, Veränderungen und Perspektiven. In K. Reiss & C. Sälzer, A. Schiepe-Tiska, E. Klieme, & O. Köller (Eds.), PISA 2015: Eine Studie zwischen Kontinuität und Innovation (pp. 249–283). Münster: Waxmann.
- White, S., Kim, Y. Y., Chen, J., & Liu, F. (2015). Performance of fourth-grade students in the 2012 NAEP computer-based writing pilot assessment: Scores, text length, and use of editing tools. Working Paper Series, NCES 2015–119.
- Zehner, F., Goldhammer, F., & Sälzer, C. (2018). Automatically analyzing text responses for exploring gender-specific cognitions in PISA reading. Large-scale Assessments in Education, 6(7). Retrieved from https://doi.org/10.1186/s40536-018-0060-3.
- Zehner, F., Sälzer, C., & Goldhammer, F. (2016). Automatic coding of short text responses via clustering in educational assessment. Educational and Psychological Measurement, 76(2), 280–303. Retrieved from https://doi.org/10.1177/0013164415590022.
- Zesch, T., Müller, C., & Gurevych, I. (2008). Extracting lexical semantic knowledge from Wikipedia and Wiktionary. In Proceedings of the 6th International Conference on Language Resources and Evaluation. Marrakech and Morocco.
Appendix A. Model Estimates
Table A1. Fixed and random proposition entity count (PEC) effects as of Model (4)
Table A2. Fixed and random relevance (Rel) effects as of Model (4)