
Abstract
The aim of this study was to produce a Finnish version of the FACE-Q scales Satisfaction with Forehead and Eyebrows, Adverse effects: Forehead, Eyebrows and Scalp, and Adverse effects: Cheeks, Lower face and Neck, and assess the performance of these scales and the Satisfaction with Facial Appearance, Satisfaction with Outcome and Appearance-related Psychosocial Distress in patients who had undergone surgery for functional problems or malignancy affecting the forehead or cheeks. The general health-related outcomes instrument 15 D was used as a reference. Patients who had undergone a frontal lift, a direct brow lift, a facelift or an excision of a facial tumor in Helsinki University Hospital plastic surgery department in 2009–2019 were identified. A postal survey study was conducted with 305 patients, of whom 135 (44%) responded. Diagnoses included facial nerve dysfunction (53%), brow ptosis (21%) and skin, mucosal or salivary gland tumor (20%). The FACE-Q scales displayed high internal consistency (Cronbach’s alphas ≥0.80) and good reliability on repeat administration. The exploratory factor analysis revealed unifactorial influences for all scales except the Adverse effects: Forehead, Eyebrows and Scalp. Weak correlations with 15 D dimensions were detected. The FACE-Q scales evaluated here are suitable for use in patients with functional problems or malignancy.
Introduction
Surgery on the face can have long-lasting and visible effects that influence the patient’s quality of life [Citation1–3]. Increasing emphasis on involving the patient perspective in clinical decision-making and medical research has created the need for validated tools that reliably capture the relevant aspects of the patient experience [Citation4,Citation5]. The FACE-Q is a patient-reported outcomes instrument developed to assess the health-related quality of life in patients undergoing facial surgery. The instrument has undergone rigorous psychometric testing during its development [Citation6–9]. It is modular in design with components addressing specific aesthetic units and those evaluating the general facial appearance and its psychosocial effects.
The FACE-Q instrument was originally developed with aesthetic surgical patients. However, its components have since been shown to be valid in assessing the outcomes of patients undergoing procedures for nonaesthetic reasons such as surgery for facial trauma, orthognathic surgery and nasal reconstruction [Citation10–12]. Recently, the FACE-Q Craniofacial module has been psychometrically validated for use in patients with facial paralysis [Citation13]. There is a need for further study on the performance of the FACE-Q scales in non-aesthetic patient populations to guide its future use. In addition, studies examining the test-retest reliability of the FACE-Q components are sparse [Citation12,Citation14].
The aim of this study was to assess the performance of the FACE-Q scales addressing the forehead region and cheeks in patients undergoing surgery for functional reasons or malignancy. We evaluated the general FACE-Q scales Satisfaction with Facial Appearance, Satisfaction with Outcome and Appearance-related Psychosocial Distress previously translated and validated in Finnish [Citation14]. In addition, we set to produce, and validate in this population, the Finnish versions of the FACE-Q Appearance scale Satisfaction with Forehead and Eyebrows, and the FACE-Q Adverse effects scales for the Forehead, Eyebrows and Scalp, and the Cheeks, Lower face and Neck.
Methods
The study design was approved by the ethical review board of Helsinki University Hospital, and it adhered to the ethical principles outlined in the Declaration of Helsinki [Citation15]. Permission for the translation and use of the FACE-Q scales was sought form the copyright owner. The study was supported by funding from the Helsinki University Musculoskeletal and Plastic Surgery Research Center.
Translation of the FACE-Q scales
Finnish versions of the FACE-Q Appearance scale for the Satisfaction with Forehead and Eyebrows, and the FACE-Q Averse effects scales for the Forehead, Eyebrows and Scalp, and the Cheeks, Lower face and Neck were produced for this study. They were translated to Finnish following the International Society for Pharmacoeconomics and Outcomes Research (ISPOR) guidelines and the COSMIN checklist for the assessment of cross-cultural validity [Citation16,Citation17].
Two independent Finnish versions were produced by authors SPH and JPR, and compared to create the initial Finnish translation. This was then translated back to English by a professional translator. The original FACE-Q scales and the back translation were compared by SPH and AJL, a native English speaker, to identify any discrepancies and, where necessary, make changes to the Finnish translation. The final Finnish translation was reviewed by the authors SPH, JPR, AJL and PL.
The scales underwent pilot testing to discover any potential linguistic or cultural issues. Patients for the pilot testing were recruited at the plastic surgery outpatient clinic. A total of thirteen patients participated; seven patients for the Satisfaction with Forehead and Eyebrows and the Adverse effects: Forehead, Eyebrows and Scalp, and six patients for Adverse effects: Cheeks, Lower face and Neck. The Q-portfolio team checked and approved the final translations of the scales.
Translation of the FACE-Q scales Satisfaction with Facial Appearance, Satisfaction with Outcome and Appearance-related Psychosocial Distress to Finnish has been previously described [Citation14].
Postal survey study
Finnish-speaking patients aged 18–85 years old, who had undergone facial surgery in Helsinki University Hospital Department of Plastic Surgery between 2009 and 2018, were identified using the operating theatre records. A total of 248 patients formed a target group that included patients who had undergone a frontal lift, a direct brow lift or a facelift. These patients formed the group for the validation of the FACE-Q scales Satisfaction with Forehead and Eyebrows, and the Adverse effects: Forehead, Eyebrows and Scalp. An additional 57 patients with an excision or a repair of a cheek tumor or defect were identified and, together with 46 facelift patients that did not reply to the initial approach, formed the group for the validation of the FACE-Q scale Adverse effects: Cheeks, Lower face and Neck.
A questionnaire package was mailed to the patients. The package contained the group-specific FACE-Q scales and the general FACE-Q scales Satisfaction with Facial Appearance, Satisfaction with Outcome and Appearance-related Psychosocial Distress. A general health-related quality of life instrument 15 D, the question ‘How normal do you think your forehead is/cheeks are?’, demographic data and a consent form were also included [Citation18]. Information on the study and a prepaid envelope were provided. A repeat of the FACE-Q scales was sent upon receipt of the completed questionnaire.
Statistical methods
Each FACE-Q scale was analysed independently. The total scores for each FACE-Q scale were converted to a 0 (worst outcome) to 100 (best outcome) scale using the non-linear Rasch transformation described for the original scales [Citation6–9]. Patients with more than 50% of the responses missing to a particular scale were excluded from the analysis of that scale. Otherwise, any missing data was replaced with the mean of the answers to the other questions on that scale.
The score distributions were assessed for the median result and interquartile range (IQR). The performance of the scale at the extremes of options was evaluated through exploring the presence of a floor or a ceiling effect. A floor effect was defined as more than 15% of the responders receiving the minimum possible score while a ceiling effect involved more than 15% of the responders receiving the maximum score.
Cronbach’s alphas with 95% confidence intervals were calculated to assess the internal consistency of the scales, or how well the scales perform at measuring the intended concept. Values over 0.70 were interpreted to represent acceptable internal consistency. Values over 0.95 were interpreted to reflect redundancy of questions in the scale.
The internal structure of the scales was analysed to discover the number of conceptual factors influencing answers to each scale, and to assess how well the questions represent the measured factors. Since the factor structure of the FACE-Q has not previously been established, exploratory factor analysis was used instead of confirmatory factor analysis to investigate the number of factors needed to reflect the data. Parallel analysis was conducted and the simulated 95th percentile eigenvalues were compared with the eigenvalues obtained from the observe data to determine the number of factors to be included in the factor analysis. The exploratory factor analysis was conducted using the maximum likelihood method with 50 iterations and the Promax-rotation method. Only factors with eigenvalues above 1 were considered significant in the final analysis. A loading value over 0.4 was interpreted as that question item representing the underlying measured factor sufficiently. A communality value over 0.5 was interpreted as the measured factor accounting for the variance of the item, while a value under 0.5 was taken to imply the influence of an additional factor.
The baseline and repeated administration scores of the FACE-Q scales were used to assess the reliability and repeatability of the instrument. The median scores of the two administrations were compared with the Mann–Whitney U-test with a p-value <0.05 taken to suggest a significant difference in the scores. The intraclass correlation coefficient (ICC) was calculated and a value over 0.7 was interpreted to reflect sufficient reliability. The standard error of measurement (SEM) was estimated as the square root of the ANOVA error variance of the two administrations. The SEM was compared with the IQR of the baseline measurement and the variance was interpreted high if the SEM value approached half or the IQR. The repeatability coefficient (R) with 95% confidence intervals (CI) was calculated using a generalised mixed-effects model fitted by restricted maximum likelihood with bootstrapping of 1000 repetitions.
Answers to the FACE-Q scales were compared with the answers to the general health-related quality of life instrument 15 D to assess the criterion validity and the discriminant validity of the FACE-Q instrument. 15 D is used as the reference instrument as it is already validated in Finnish. The criterion validity represents the extent to which the FACE-Q scale scores correlate with the 15 D domains that they are conceptually expected to correlate with. The discriminant validity reflects the lack of a correlation between two conceptually different aspects in the two questionnaires. Convergence of the FACE-Q scale scores with the 15 D dimensions and the question ‘How normal do you think your forehead is/cheeks are?’ were assessed through calculating Spearman correlation coefficients. Coefficient values over 0.7 were interpreted as high, 0.5–0.7 moderate, 0.3–0.5 weak, and less than 0.3 negligible.
R (4.0.3) statistical software with ‘psych’, ‘rptR’, ‘rel’, ‘GPArotation’, ‘ltm’ and ‘tidyverse’ packages, were used for statistical analysis and visualization [Citation19–25].
Results
Translation
The FACE-Q scales Satisfaction with Forehead and Eyebrows, Adverse effects: Forehead, Eyebrows and Scalp, and Adverse effects: Cheeks, Lower face and Neck translated readily into Finnish. Comparison of the original English version and the back translation resulted in a change in translation for the phrase ‘show expression’. The pilot testing was done with thirteen patients (nine women and four men) with a median age of 75 (29–85) years. No further changes to the wording in the questions were required.
Postal survey study
The questionnaire package including the FACE-Q scales Satisfaction with Forehead and Eyebrows, and Adverse effects: Forehead, Eyebrows and Scalp was returned by 106 of the 248 patients (43%). Of these participants, 81 (76%) returned the repeat questionnaire. The questionnaire package including the Adverse effects: Cheeks, Lower face and Neck was returned by 29 of the 103 patients (28%). Of these participants, 26 (90%) returned the repeat questionnaire. Thus, a total of 136 patients out of the 305 patients approached (44%), responded. Overall, the repeat questionnaire was returned by 107 participants (79%).
The median age of the participants was 65 (range 18–84) years. The majority of the patients had undergone either a forehead lift (41%) or a facelift (31%). However, also patients with extensive microvascular reconstructions were included (5%). Patients with skin, mucosal or salivary gland malignancy comprised 20% of the study population. The median time from surgery was 6 (0–10) years. Further details of the participants are outlined in . The delay between the completion of the first questionnaire and sending of the repeat questionnaire was a median 18 (7–65) days.
Table 1. Characteristics of the included patients.
Performance of the FACE-Q subscales
Most of the FACE-Q scales performed well with no floor or ceiling effect observed (). Appearance-related Psychosocial Stress scale was the only subscale to display a floor effect with 19% of the patients scoring the minimum possible points. All the scales displayed high internal consistency with Cronbach’s alphas 0.80–0.97 (), implying that the scales perform well at measuring the intended concept. However, Cronbach’ alpha 0.97 for the scale Satisfaction with Facial Appearance suggested item redundancy.
Table 2. Assessment of the internal consistency of the FACE-Q subscales.
Table 3. Exploratory factor analysis for the FACE-Q subscales.
Internal structure of the FACE-Q subscales
The Satisfaction with Facial Appearance and the Satisfaction with Outcome scales performed well in the patient population with only one factor provided by the parallel analysis, and with high loading and communality values for each question ().
The Appearance-related Psychosocial Distress scale items all demonstrated strong loading on the identified factor. The item ‘I have little interest in doing things’ had both the lowest factor loading at 0.62 and a communality factor 0.39 that suggested an unidentified influence on the variance of the item.
Most items in the Satisfaction with Forehead and Eyebrows scale had acceptable loading and communality values for the factor suggested by the parallel analysis. However, the communality value 0.45 of the item ‘how smooth your forehead looks’ implied that the identified factor did not explain sufficiently the variance in the answers.
Both adverse effects scales – Forehead, Eyebrows and Scalp as well as Cheeks, Lower face and Neck – had questions with a communality value less than 0.5, implying the influence of one or more factors not captured by the scale. For the Cheek, Lower face and Neck scale, the parallel analysis suggested only one underlying factor. However, items addressing smoothness of the face and the appearance of the scars had low loading values for this factor (0.33 and 0.21, respectively). The communality values were over 0.5 only for the items: sensitivity to touch (0.90), tingling senstation (0.72), painful scars (0.66), discomfort (0.67) and swelling (0.50). For the Forehead, Eyebrows and Scalp scale, the parallel analysis provided four factors, all with eigenvalue above 1. Factor loadings suggested four separate item groupings addressing (i) forehead sensations (items 2–4, loading values 0.55–0.77), (ii) facial expressions (items 7 and 6, loading values 0.88 and 0.98), (iii) eyebrow position (items 8 and 9, loading values 0.66 and 0.87), and (iv) scar quality and pain (items 1, 11 and 12, loading values 0.51–0.65). The communality values for these itemas were 0.51 and over ().
Reliability and repeatability of the FACE-Q subscales
The median scores did not differ significantly for the baseline and repeat administrations of the FACE-Q subscale scores assessed: Satisfaction with Facial Appearance (58 vs. 48, p = 0.23), Appearance-related Psychosocial Distress (31 vs. 26, p = 0.96), Satisfaction with Outcome (52 vs.52, p = 0.47), Satisfaction with Forehead and Eyebrows (72 vs 72, p = 0.98), Adverse effects: Forehead, Eyebrows and Scalp (17 vs. 17, p = 0.78), and Adverse effects: Cheeks, Lower face and Neck (19 vs. 18, p = 0.73).
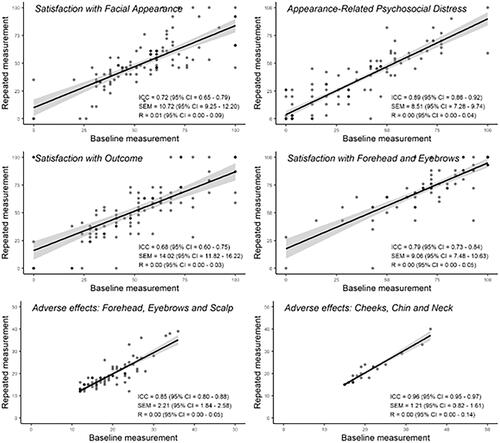
The subscales Satisfaction with facial appearance, Appearance-related Psychosocial Distress, Satisfaction with Forehead and Eyebrows, Adverse effects: Forehead, Eyebrows and Scalp and Adverse effects: Cheeks, Lower face and Neck displayed good reliability on repeat administration with ICC 0.72–0.96, R 0.00–0.01 and SEM values below half of the original score SEM (). The ICC for Satisfaction with Outcome was 0.68 (95% CI 0.60–0.75), suggesting a degree of variation in the answers between the two administrations. However, the SEM was acceptable (14 with original administration IQR 35–66) and the R 0.00 (95% CI 0.00–0.04).
Figure 1. Reliability of the FACE-Q subscales on repeat administration. ICC: Intraclass correlation coefficient; SEM: standard error of measurement; R: repeatability coefficient.
Criterion validity and discriminant validity of the FACE-Q subscales
No correlation was detected between FACE-Q subscale scores and 15 D domains for mobility, breathing, excretion and mental function. Negative correlation was observed with conceptually opposing concepts. For most domains and subscales, the correlation was weak (Spearman correlation coefficient −0.41–0.48, p < 0.05). The self-perceived ‘normality’ of the forehead or cheeks correlated moderately to strongly with the scores for Satisfaction with Facial Appearance (0.53, p < 0.001), Adverse effects: Forehead, Eyebrows and Scalp (−0.56, p < 0.001) and Adverse effects: Cheeks, Lower face and Neck (−0.78, p < 0.001). ()
Table 4. Correlation between the FACE-Q subscale scores and the 15 D domains and the self-perceived normality of the forehead or cheeks.
Discussion
Patient-reported outcomes instruments can provide valuable information in clinical studies and be used to guide day-to-day decision-making in the surgical practice [Citation26]. However, when used inappropriately, these questionnaires can provide misleading data [Citation5]. Reliable application of an instrument requires that it has been validated, or shown to perform reliably, in the target language and culture [Citation16]. Another aspect to consider is the suitability of the questionnaire for the particular patient group [Citation17]. Here we have produced a Finnish version of the FACE-Q scales Satisfaction with Forehead and Eyebrows, and Adverse effects: Forehead, Eyebrows and Scalp, and Adverse effects: Cheeks, Lower face and Neck. We then psychometrically evaluated the newly translated scales and the FACE-Q scales Satisfaction with Facial Appearance, Satisfaction with Outcome and Appearance-related Psychosocial Distress in a patient group having functional or aesthetic concerns in their forehead and cheek regions. The scales performed well and displayed high test-retest reliability.
The patient population of this study was diverse to enable psychometric assessment of the FACE-Q scales in a mixed group of patients other than those seeking surgery for only aesthetic reasons. Patients with facial nerve paralysis represented 38% of the participants. Together with patients with the Meretoja amyloidosis syndrome that involves bilateral progressive facial paralysis and cutis laxa, they formed 53% of the study population. Brow ptosis was an isolated issue in 21% of the patients. Skin cancer, mucosal tumor or salivary gland tumor was the cause for surgery in 20% of the participants. In addition, a minority of the patients, 5%, had undergone a major microvascular reconstruction following tumor resection.
All the scales performed well in measuring the concept addressed by the questions, reflected in a high internal consistency of the scales with Cronbach’s alphas 0.80 and above. However, the exploratory factor analysis revealed four underlying factors for the Adverse effects: Forehead, Eyebrows and Scalp. Based on the factor loadings and communality values, conceptual groups were formed by questions on the ability to make facial expressions, position of the eyebrows, any abnormal forehead sensations, and the scar quality. The detection of multiple factors influencing the answers implies that the scales may not fully capture the experience of these patients, especially if evaluated as sum scores without any further analysis.
Recently, a FACE-Q module for facial nerve paralysis patients was published, and in that, the appearance scales for the face and the forehead were assessed relevant and valid in this patient group [Citation13]. In our study, 53% of the patients had a degree of facial nerve paralysis while the others represented various pathologies. Thus, the multiple factors observed for the Satisfaction with Forehead and Eyebrows scale and the Adverse effects: Forehead, Eyebrows and Scalp scales in our study may reflect the mixed pathology in the patient population used, rather than an unsuitability of the scales for use in patients with functional problems in the face.
The median score for the Satisfaction with Facial Appearance scores observed here, 58, is similar to that previously recorded for patients undergoing surgery in the periorbital or nasal region in our institute, 55 for both patient groups [Citation12,Citation14]. It is worse than the satisfaction reported for postoperative facial trauma patients, 66, or facelift patients, 74, but better than that observed for preoperative facelift patients, 44 [Citation10,Citation27]. A minimum important difference of 7 points has been proposed for this scale [Citation27]. Thus, the patients in our study appear to be generally not very satisfied with their facial appearance. This trend is reflected also in the Satisfaction with Outcome score, with a median of 52 falling below the mean scores reported for facial trauma and facelift patients, 68 and 63, respectively, with a minimum important difference of 11 points [Citation8,Citation10].
The Appearance-related Psychosocial Distress scale was, surprisingly, the only scale demonstrating a floor effect in our patient population with 19% of the participants reporting no distress. No ceiling effect was observed and the Cronbach’s alpha for the scale was high, 0.95. These data imply that the scale may miss subtle aspects of concern in the generally non-distressed patients but, in general, performs well in this population. Inclusion of this scale in the FACE-Q module for facial nerve paralysis patients supports this view [Citation13]. The median score in our population, 31, is higher than that previously observed in patients seeking facial aesthetic surgery, 24 [Citation7].
Convergence assessment of the FACE-Q scale scores with the general health-related quality of life instrument 15 D dimensions implied good criterion validity and discriminant validity of the FACE-Q scale scores. While all the scale scores correlated with the 15 D depression dimension, the scores for the Satisfaction with Facial Appearance, the Appearance-related Psychosocial Distress and the adverse effects scales correlated also with selected functional dimensions such as vision and speech. Most of the correlations detected were, however, weak. A moderate to strong correlation was detected between the self-perceived normality of the forehead or cheeks and the scores for the adverse effects scales and the Satisfaction with Facial Appearance. While the convergence of the scale scores support the psychometric validity of the FACE-Q scales in the study population, the weakness of the correlations with 15 D highlights the need for a patient-reported outcomes instrument that better captures the concepts relevant for patients undergoing facial surgery.
The main limitation of our study is its cross-sectional nature which meant that we were unable to gather any preoperative responses on the FACE-Q scales or assess the minimum important difference in the scale scores in our population. In addition, the response rate was relatively low, 44%, and the number of patients in some of the individual diagnosis groups was small. The overall sample size of 135 patients was, however, acceptable. An exception to this is the Adverse effects: Cheeks, Lower face and Neck scale, which was returned completed by only 27 patients.
In conclusion, the Finnish versions of the FACE-Q scales Satisfaction with Facial Appearance, Satisfaction with Outcome, Appearance-related Psychosocial, Distress, the Appearance scale Satisfaction with Forehead and Eyebrows, and the Adverse effects scales for the Forehead, Eyebrows and Scalp, and the Cheeks, Lower face and Neck, perform well in assessing patient-related outcomes in patients undergoing surgery for functional reasons or malignancy. The reliability of all the scales on repeat administration is high. Our findings suggest that these FACE-Q scales are psychometrically valid for use in facial surgical patients, also outside of the aesthetic surgery setting.
Acknowledgements
The authors thank members of the Q-Portfolio team for their contribution to the translation process. The translated FACE-Q scales are available free of charge for clinical and research use at the Q-portfolio website [Citation28].
Disclosure statement
No potential conflict of interest was reported by the author(s).
Additional information
Funding
References
- Klassen AF, Cano SJ, Scott AM, et al. Measuring outcomes that matter to Face-Lift patients: development and validation of Face-Q appearance appraisal scales and adverse effects checklist for the lower face and neck. Plast Reconstr Surg. 2014;133(1):21–30.
- Lee EH, Klassen AF, Cano SJ, et al. Face-Q skin cancer module for measuring patient-reported outcomes following facial skin cancer surgery. Br J Dermatol. 2018;179(1):88–94.
- Kamran R, Longmire NM, Rae C, et al. Concepts important to patients with facial differences: a qualitative study informing a new module of the Face-Q for children and young adults. Cleft Palate Craniofac J. 2020;58(8):1020–1031.
- Sharma K, Steele K, Birks M, et al. Patient-reported outcome measures in plastic surgery: an introduction and review of clinical applications. Ann Plast Surg. 2019;83(3):247–252.
- Santesso N, Barbara AM, Kamran R, et al. Conclusions from surveys may not consider important biases: a systematic survey of surveys. J Clin Epidemiol. 2020;122:108–114.
- Pusic AL, Klassen AF, Scott AM, et al. Development and psychometric evaluation of the Face-Q satisfaction with appearance scale: a new patient-reported outcome instrument for facial aesthetics patients. Clin Plast Surg. 2013;40(2):249–260.
- Klassen AF, Cano SJ, Alderman A, et al. Self-report scales to measure expectations and appearance-related psychosocial distress in patients seeking cosmetic treatments. Aesthet Surg J. 2016;36(9):1068–1078.
- Klassen AF, Cano SJ, Schwitzer JA, et al. Face-Q scales for health-related quality of life, early life impact, satisfaction with outcomes, and decision to have treatment: development and validation. Plast Reconstr Surg. 2015;135(2):375–386.
- Klassen AF, Cano SJ, Schwitzer JA, et al. Development and psychometric validation of the Face-Q skin, lips, and facial rhytids appearance scales and adverse effects checklists for cosmetic procedures. JAMA Dermatol. 2016;152(4):443–451.
- Elegbede A, Mermulla S, Diaconu SC, et al. Patient-Reported outcomes in facial reconstruction: assessment of Face-Q scales and predictors of satisfaction. Plast Reconstr Surg Glob Open. 2018;6(12):e2004.
- Su Y-Y, Denadai R, Ho C-T, et al. Measuring patient-reported outcomes in orthognathic surgery: linguistic and psychometric validation of the mandarin Chinese version of Face-Q instrument. Biomed J. 2020;43(1):62–73.
- Homsy SP, Uimonen MM, Lindford AJ, et al. Application of the Face-Q rhinoplasty module in a mixed reconstructive and corrective rhinoplasty population in Finland. J Plast Surg Hand Surg. 2021:1–7. doi:10.1080/2000656X.2021.1898973
- Klassen AF, Rae C, Gallo L, et al. Psychometric validation of the Face-Q craniofacial module for facial nerve paralysis. Facial Plast Surg Aesthet Med. 2021. doi:10.1089/fpsam.2020.0575
- Homsy SP, Uimonen MM, Lindford AJ, et al. Finnish translation and validation of the Face-Q eye module. Scand J Surg. 2020:1457496920982767. doi:10.1177/1457496920982767
- Association WM. World medical association declaration of Helsinki: Ethical principles for medical research involving human subjects. Jama. 2013;310:2191–2194.
- Wild D, Grove A, Martin M, et al. Principles of good practice for the translation and cultural adaptation process for patient-reported outcomes (pro) measures: report of the ISPOR Task Force for translation and cultural adaptation. Value Health. 2005;8(2):94–104.
- Mokkink LP, Prinsen CAC, Patrick DL, et al. Cosmin Study Design Checklist for patient-reported outcome measurement instruments. 2019. https://www.cosmin.nl/wp-content/uploads/COSMIN-study-designing-checklist_final.pdf
- Sintonen H. The 15d instrument of health-related quality of life: properties and applications. Ann Med. 2001;33(5):328–336.
- Team RC. R: a language and environment for statistical computing. Vienna (Austria): R Foundation for Statistical Computing; 2020.
- Revelle W. Psych: procedures for personality and psychological research. Evanston (IL): Northwestern University; 2018. https://CRAN.R-project.org/package=psychVersion=1.8.12.
- Stoffel MA, Nakagawa S, Schielzeth H. Rptr: repeatability estimation and variance decomposition by generalized linear mixed-effects models. Methods Ecol Evol. 2017;8(11):1639–1644.
- LoMartire R. Rel: reliability coefficients. R Package Version 1.4.2. 2020. https://rdrr.io/cran/rel/
- Bernaards CA, Jennrich RI. Gradient projection algorithms and software for arbitrary rotation criteria in factor analysis. Educ Psych Meas. 2005;65(5):676–696.
- Rizopoulos D. Ltm: an R package for latent variable modeling and item response analysis. J Stat Soft. 2006;17:25.
- Wickham H. Tidyverse: easily install and load the 'Tidyverse'. R Package Version 1.2.1. 2017. https://cran.r-project.org/web/packages/tidyverse/index.html
- Ioannidis JP, Greenland S, Hlatky MA, et al. Increasing value and reducing waste in research design, conduct, and analysis. Lancet. 2014;383(9912):166–175.
- Klassen AF, Cano SJ, Pusic AL. Face-Q satisfaction with appearance scores from close to 1000 facial aesthetic patients. Plast Reconstr Surg. 2016;137(3):651e–652e.
- http://Qportfolio.Org/. [cited 2020 Jul 15].