
ABSTRACT
Extracellular vesicles (EVs) are intercellular communicators with key functions in physiological and pathological processes and have recently garnered interest because of their diagnostic and therapeutic potential. The past decade has brought about the development and commercialization of a wide array of methods to isolate EVs from serum. Which subpopulations of EVs are captured strongly depends on the isolation method, which in turn determines how suitable resulting samples are for various downstream applications. To help clinicians and scientists choose the most appropriate approach for their experiments, isolation methods need to be comparatively characterized. Few attempts have been made to comprehensively analyse vesicular microRNAs (miRNAs) in patient biofluids for biomarker studies. To address this discrepancy, we set out to benchmark the performance of several isolation principles for serum EVs in healthy individuals and critically ill patients. Here, we compared five different methods of EV isolation in combination with two RNA extraction methods regarding their suitability for biomarker discovery-focused miRNA sequencing as well as biological characteristics of captured vesicles. Our findings reveal striking method-specific differences in both the properties of isolated vesicles and the ability of associated miRNAs to serve in biomarker research. While isolation by precipitation and membrane affinity was highly suitable for miRNA-based biomarker discovery, methods based on size-exclusion chromatography failed to separate patients from healthy volunteers. Isolated vesicles differed in size, quantity, purity and composition, indicating that each method captured distinctive populations of EVs as well as additional contaminants. Even though the focus of this work was on transcriptomic profiling of EV-miRNAs, our insights also apply to additional areas of research. We provide guidance for navigating the multitude of EV isolation methods available today and help researchers and clinicians make an informed choice about which strategy to use for experiments involving critically ill patients.
Introduction
A multitude of isolation methods for extracellular vesicles (EVs) has been developed and commercialized in the last decade. Many methods claim rapid, reliable and highly efficient isolation from serum, yet there is no consensus on each method’s suitability for scientific and clinical applications. Comparative data on methods for isolating EVs from patient biofluids are scarce, despite clear interest in utilizing EVs and their miRNA cargo for biomarker studies. Further, few attempts have been made to comprehensively analyse vesicular miRNAs in biofluid samples from critically ill patients, a population highly relevant to many clinical situations. This work compares five different methods of EV isolation and their suitability for miRNA-based biomarker discovery. We isolated serum EVs from sepsis patients and healthy volunteers, sequenced their small RNA cargo and performed differential miRNA expression analysis. Additional experiments assessed method-specific differences in vesicle composition and morphology. Our data reveal that precipitation and membrane affinity are highly suitable for both small RNA-Seq and patient classification based on cell-free miRNAs. Comparative evaluation demonstrates that miRNA yield correlates with robust separation of sepsis patients and healthy individuals, while vesicle purity seems less relevant for RNA-based biomarker applications. Differences in size, quantity and composition of isolated vesicles indicate that each method captures distinctive, but partially overlapping EV populations accompanied by varying degrees of contamination with non-EV material.
EVs are intercellular communicators with key functions in physiological and pathological processes and have recently garnered significant interest as potential diagnostic and therapeutic agents. Rapidly increasing research in this field is accompanied by the demand for reproducible, time-efficient and economic isolation methods. A recent survey conducted by Gardiner et al. revealed that although ultracentrifugation (UC) remains the most commonly used isolation method, other approaches have gained preference when starting volume is limited [Citation1]. Capturing EVs from blood-based biofluids such as serum and plasma is of particular interest for clinical applications. As a consequence, manufacturers offer a wide array of commercial isolation kits. These rely on principles ranging from filtration, precipitation and sedimentation to size-exclusion chromatography (SEC) and immunocapture.
One of the most important aspects of EV research is analysing their nucleic acid cargo, particularly small RNAs. These are commonly quantified by RT-qPCR or, increasingly, comprehensive transcriptomic profiling by next-generation sequencing (NGS, small RNA-Seq). Applications of EV transcriptomics range from basic research to biomarker discovery and drug development, making use of EVs as an easily accessible, enriched sampling fraction [Citation2,Citation3]. Inferring credible information from the transcriptome relies on precise quantification of target RNA, which in turn requires samples of high quality and integrity [Citation4]. Additionally, methods for RNA extraction itself influence downstream analyses by yielding non-identical, kit-specific isolates [Citation5]. This holds true particularly for extracellular RNA, which bears additional challenges such as low concentrations, diminished RNA integrity and high variability between individuals. Indeed, recent publications have highlighted the impact of cell-free RNA extraction strategies on small RNA-Seq, reporting quantitative and qualitative differences in resulting sequencing libraries [Citation6,Citation7].
Similarly, the impact of EV isolation strategies on RNA quantification assays has been demonstrated for cell culture supernatant [Citation8], urine [Citation9,Citation10], milk [Citation11] and serum [Citation12]. Depending on the respective isolation principle, different populations of EVs with varying degrees of contamination seem to be isolated, resulting in only partially overlapping RNA profiles. Being able to detect specific RNA patterns in bulk populations of blood-derived EVs is challenging due to the vesicular secretome’s complexity. Although most EVs in blood are secreted by erythrocytes, platelets and endothelial cells, various other tissues also secrete vesicles into the circulation, further complicating analysis [Citation13,Citation14]. Multiple classes of EVs are secreted from even one specific cell type, each carrying its individual RNA signature [Citation15]. Beyond RNA profiles, kit-specific isolates also differ in EV composition, size, concentration, purity and functionality [Citation16–Citation20]. Selecting appropriate isolation methods is therefore a critical step in all areas of EV research.
There are excellent publications comparing different strategies of isolating EVs from human serum for RNA analyses. Rekker et al., Andreu et al. and Crossland et al. relied on RT-qPCR to profile vesicular miRNAs, comparing isolation based on UC, precipitation and filtration [Citation12,Citation21,Citation22]. Helwa et al. isolated EVs from different starting volumes by precipitation and UC and quantified associated miRNAs by droplet digital PCR [Citation23]. Analysing EV miRNAs using PCR-based assays is an important and well-established approach supported by excellent protocols and methods [Citation24–Citation26].
However, as NGS has become an increasingly popular downstream application to study miRNAs in EVs, it is crucial to define the EV isolation method most suitable for this particular technique. Several previous publications reported the feasibility and utility of sequencing small RNA in EVs isolated from serum, plasma, urine, and cell culture supernatant [Citation2,Citation27–Citation30]. Small RNA-Seq experiments often focus on valuable applications such as liquid biopsy-based diagnostics and, consequently, clinical samples. Screening potential isolation methods should therefore include samples from healthy individuals as well as diseased patients, who often display severe anomalies in blood parameters. These matrix effects could conceivably interfere with EV isolation and hamper the transfer of methodologies from healthy to diseased subjects. Prime examples of critically ill patients are individuals suffering from sepsis and septic shock. This complex, life-threatening disease comes along with various clinical complications such as multiple organ failure, dysregulated coagulation and altered blood lipid profiles [Citation31,Citation32]. Findings derived from comparing EV isolation strategies for healthy donors, however, might not be readily transferred to such challenging samples. We therefore believe it is important to verify each method’s applicability in samples relevant for the respective clinical situation.
The objective of the current study was to compare several methods of isolating EVs from healthy and septic sera and to identify the one most suitable for biomarker-focused small RNA-Seq in this population of critically ill patients. Routine biomarker applications call for time-efficient, simple and streamlined procedures, ideally provided to clinical laboratories as one-box solutions. We did therefore not screen all potential combinations of EV isolation and RNA extraction methods but focused on either recommended RNA kits by the same manufacturer or combinations commonly used in the EV field. Additionally, isolates from each method were comparatively characterized in order to assess method-specific differences in captured EV populations and potential contaminating material.
Material and methods
Ethics approval and consent to participate
The study was approved by the Ethics Committee of the Medical Faculty of the University of Munich (protocol #551-14). Written informed consent and approval of a patient’s legal representative was obtained when the patient lacked capacity to give informed consent for participation in the study. The study was carried out in accordance with approved guidelines, and all study samples were anonymized during analysis. Written informed consent for publication of blinded individual person’s data was obtained from each participant or the patient’s legal representative.
Patient recruitment
Four patients with sepsis and five patients in septic shock were included in the study and sex-matched to 10 healthy volunteers (Supplemental Table 1). Patients included in the study were >18 years of age and within 24 h of admission to the intensive care unit (ICU). Exclusion criteria were pregnancy, immunosuppression, leukopenia, haematological malignancies or the initiation of palliative care. Healthy volunteers were recruited from hospital personnel and by advertisement. Only volunteers with a Charlson Comorbidity Index [Citation33] of ≤1 were included.
Sample collection
Blood was drawn from 20G catheters within the radial artery of sepsis patients on the day of admission to the ICU (day 0) and 24 h later (day 1). Healthy volunteers were sampled by venipuncture using 20G needles. In order to prevent haemolysis, aspiration was performed slowly and evenly for both procedures. Blood was collected in 9 ml serum tubes (S-Monovette, Sarstedt AG&Co) and centrifuged at 3400 g for 10 min at room temperature (RT) within 10 min of sampling. Resulting serum was aliquoted and stored at −80 °C.
Isolation of extracellular vesicles
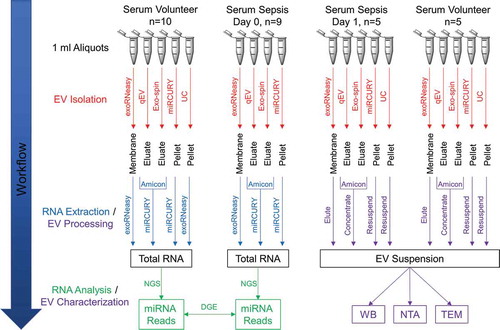
EVs were isolated from serum using four commercially available isolation kits as well as differential UC (). One millilitre serum from each patient and volunteer was used as starting material for all isolation methods. EV isolation was performed as detailed below, following manufacturer’s recommendations for pre-clearing of serum and subsequent steps. For all commercial isolation methods, we sequenced vesicular RNA from both patients and volunteers. Small RNA-Seq was performed for all samples except in the case of UC-derived EVs where it was only performed for healthy volunteers, but not for sepsis patients, as serum availability was limited. Serum EVs from day 0 were used for RNA extraction and small RNA-Seq.
Table 1. EV isolation methods and RNA extraction kits utilized in this study.
Five septic shock patients and five matched volunteers from our small RNA-Seq cohort were selected for additional biological characterization of EVs. In these supplemental experiments, we isolated EVs from 1 ml serum sampled on day 1 of intensive care therapy in patients with sepsis. These day 1 EVs were isolated as described below, concentrated to 50 µl using Amicon Ultra-4 30 kDa NMWL spin filters (Merck Millipore) and split into separate aliquots for protein analysis and particle characterization, respectively. A schematic diagram that summarizes all steps of the EV isolation and characterization workflow is provided in .
Figure 1. Schematic summary of EV isolation, RNA extraction and downstream analyses. EVs were isolated from human serum using five (healthy donors) or four (sepsis patients) different methods. After extracting total RNA from EV isolates, small RNA species were profiled by NGS. Differential expression of miRNAs between volunteers and patients was assessed to identify potential biomarker candidates. Sera from a subset of volunteers and patients were used to additionally characterize isolates from each method by Western blot (WB), nanoparticle tracking analysis (NTA) and transmission electron microscopy (TEM).
Precipitation
EVs were precipitated from 1 ml serum using the miRCURY Exosome Isolation Kit (Exiqon) according to the manufacturer’s instructions. For RNA extraction, EV pellets were lysed with the provided miRCURY biofluid lysis solution. Pellets for biological characterization were resuspended in phosphate-buffered saline (PBS).
Size-exclusion chromatography
For Exo-spin (Cell Guidance Systems), EVs from 1 ml serum were purified on the provided columns and eluted in 3 ml particle-free PBS according to the manufacturer’s quick start protocol. For qEV (Izon Science), columns were equilibrated, overlaid with 1 ml serum and flushed with particle-free PBS, collecting sequential fractions of 0.5 ml. Fractions 7–9 were pooled to maximize EV yield.
Membrane affinity
Pre-cleared serum was applied to exoEasy columns (Qiagen) as per the manufacturer’s protocol. EVs were captured and washed using reagents provided in the kit. For RNA extraction, EVs bound to the membrane were lysed by adding QIAzol (Qiagen). Intact EVs for biological characterization were eluted from the column by addition of the provided buffer XE (analogous to the procedures in Qiagen’s exoEasy kit).
Sedimentation
Serum was diluted 1:4 in PBS and subjected to low-speed centrifugation (12,000 g, 1 h, k-factor: 1401.3). EVs from the pre-cleared supernatant were then pelleted at 120,000 g for 14 h (k-factor: 139.7). All centrifugation steps were carried out at 4°C using an Optima LE-80K ultracentrifuge (Beckman Coulter) and a SW60 rotor. Pellets were lysed in QIAzol for RNA extraction or resuspended in PBS for EV characterization.
RNA extraction and characterization
Total RNA was extracted from day 0 serum EVs using commercial column-based kits listed in . For all extraction methods, RNA eluates were reapplied to the membrane for a second elution.
Precipitation
RNA was extracted from EV lysates using the corresponding miRCURY RNA Isolation Kit for biofluids. Procedures were carried out according to the manufacturer’s protocol, and RNA was eluted in 30 µl nuclease-free water.
Size-exclusion chromatography
Eluted EVs (Exo-spin: 3 ml; qEV: 1.5 ml) were concentrated to 200 µl on Amicon Ultra-4 30 kDa NMWL spin filters. RNA was subsequently extracted from the concentrate using the miRCURY biofluids kit as described above.
Membrane affinity
RNA was extracted from EVs lysed in QIAzol using reagents provided in the exoRNeasy kit. Procedures were carried out according to the manufacturer’s protocol, and RNA was eluted in 14 µl nuclease-free water.
Differential UC
Following lysis of pellets in QIAzol, RNA was extracted using the exoRNeasy kit as described above.
In order to compensate for the varying elution volumes, all RNAs were gently dried in a centrifugal evaporator and resuspended in 10 µl nuclease-free water. Yield and size distribution of EV-RNA were assessed by capillary electrophoresis on the 2100 Bioanalyzer (Agilent Technologies). We used the RNA 6000 Pico Assay (Agilent Technologies) to assess the total RNA profile including potential contaminations with cellular RNA.
Next-Generation Sequencing
EV-RNA from sepsis patients and healthy volunteers was profiled by small RNA-Seq. For all isolation methods, we used 60% (6 µl) of eluted total RNA as starting material. Library preparation was performed as described in Reithmair et al. [Citation34], using the NEBNext Multiplex Small RNA Library Prep Set for Illumina (New England BioLabs Inc.). To compensate for the low RNA input, all adaptors and primers were diluted 1:2 in nuclease-free water. Size selection of PCR products was performed by high-resolution 4% agarose gel electrophoresis, selecting bands of 130–150 base pairs. Fragment sizes of purified libraries were assessed using capillary electrophoresis prior to 50 cycles of single-end sequencing on the HiSeq2500 (Illumina Inc.).
Data analysis
Sequencing data were processed as described elsewhere [Citation35]. Briefly, FastQC (version 0.10.1) [Citation36] was used to assess sequence length distribution and quality. Adaptor sequences were trimmed using Btrim [Citation37], and all reads without adaptors were discarded. Additionally, reads shorter than 16 nt, probably degradation products from longer coding and non-coding RNA species, were excluded from the data set before proceeding to alignment [Citation4]. To avoid false-positive hits during miRNA analysis, reads that mapped to sequences from human rRNA, tRNA, snRNA and snoRNA (obtained from RNAcentral) were initially removed from the data set [Citation38]. Remaining reads were then aligned to human miRNA sequences in the most recent version (21) of miRBase [Citation39]. Mapping was performed using Bowtie [Citation40] and the “best” alignment algorithm, allowing one mismatch for alignment to both RNAcentral and miRBase. For all RNA classes, final read count tables were generated directly from Bowtie output by summing up all hits per sequence. Differential gene expression (DGE) analysis was subsequently performed via the Bioconductor Package DESeq2 (version 1.8.1) [Citation41] using the included normalization strategy based on median ratios of mean miRNA expression and the Benjamini–Hochberg method to correct for false discovery. A log2 fold change ≥|1| and an adjusted p-value of ≤0.05 were set as thresholds to identify significantly regulated miRNAs. Only transcripts with a baseMean ≥50 were included in the analysis. Hierarchical clustering (Euclidean distances, Ward’s method), principal component analysis (regularized log-transformed, sizefactor-corrected counts obtained from DESeq2) and visualization of significantly regulated miRNAs in Venn diagrams were carried out in R (version 3.4.0) using the packages gplots, ggplots2, RColorBrewer, dendextend, ggfortify and VennDiagram [Citation42–Citation48]. Trimmed sequence reads were deposited in the European Nucleotide Archive under accession number PRJEB24913 (http://www.ebi.ac.uk/ena/data/view/PRJEB24913).
Nanoparticle tracking analysis
EV suspensions were diluted in particle-free PBS (prepared by a 120,000 g spin at 4°C for 14 h, k-factor: 231.6) and analysed using a NanoSight LM10 (Malvern Instruments GmbH) equipped with a 405-nm laser and a high-sensitivity sCMOS camera. Samples were introduced manually, and six videos of 45 s each were captured at a frame rate of 25 frames/second. With sample temperatures monitored manually, individual particles were tracked using NTA 3.0 software (Malvern Instruments GmbH) at camera level 10 and the Finite Track Length Adjustment (FTLA) algorithm. For analysis, we used a conservative detection threshold with blur and minimum track length set to auto and only considered captures with at least 2000 completed tracks. Starting from concentrations measured by NTA, initial particle concentrations in serum were calculated using the respective dilution factors for each sample as described elsewhere [Citation49].
Transmission electron microscopy
EVs were adsorbed onto formvar/carbon-coated 200-mesh nickel grids (Electron Microscopy Sciences) for 20 min at RT. Next, grids were fixed with 2% paraformaldehyde for 20 min, washed with PBS three times and fixed with 1 % glutaraldehyde for 5 min. After six washing steps with distilled water, grids were negative stained with 4 % uranyl acetate for 5 min. Finally, grids were embedded in 0.4 % uranyl acetate / 0.2 % methyl cellulose for 10 min on ice in the dark and air-dried overnight. Images were acquired on a Zeiss EM900 (Carl Zeiss Microscopy GmbH) with a wide-angle dual-speed 2K-CCD camera at 80 kV.
Western blot
EV samples were lysed in ice-cold Radioimmunoprecipitation Assay (RIPA) buffer on ice for 15 min intermitted by three bouts of sonication in a water bath. After centrifugation at 13,000 g for 10 min, protein concentration in the supernatant was analysed using Bicinchoninic Acid (BCA) assay (Sigma Aldrich). Input for exoRNeasy, Exo-spin, miRCURY and UC was normalized to 25 µg total protein. Due to very low protein concentrations, maximum volumes were loaded on the gel for qEV. For electrophoresis, samples were reduced in Laemmli buffer and heated at 70 °C for 10 min. Protein lysates for analysis of CD63 were incubated with non-reducing sample buffer at RT for 20 min. Proteins were separated using NuPAGE 4–12% Bis-Tris Gels (Invitrogen) prior to transfer to a 0.45 µm nitrocellulose membrane (GE Healthcare Life Sciences). Membranes were blocked with 1% non-fat milk powder in Phosphate Buffered Saline with Tween (PBST) for 1 h at RT and incubated with primary antibodies at 4°C overnight. Secondary antibodies were added for 1 h at RT. After washing with blocking buffer, blots were developed using the Clarity Western ECL Blotting Substrate Kit (Bio-Rad). Primary antibodies were from Abcam (mouse anti-TSG101 clone 4A10, ab83, 1:800, rabbit anti-Syntenin clone EPR8102, 1:5000, ab57113, 1:250, mouse anti-CD63, clone TS63, ab59479, 1:500, mouse anti-Human Serum Albumin clone 1A9, ab37989, 1:250), OriGene (rabbit anti-CD81, TA343598, 1:500) and Biomol (goat anti-Calnexin, WA-AF1179a, 1:2500). All marker proteins except CD63 were analysed using reducing conditions. HRP-conjugated secondary antibodies were purchased from Abcam (goat anti-Mouse, ab97040, 1:10,000, goat anti-Rabbit, ab97080, 1:10,000, rabbit anti-Goat, ab97105, 1:10,000).
Results
Analysis of isolation-specific EV-RNA composition by small RNA-Seq
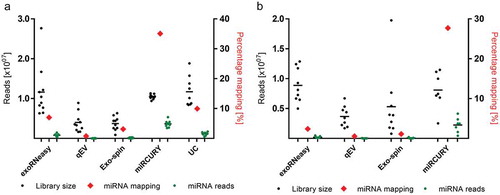
Total EV-RNA was characterized by capillary electrophoresis, revealing major differences in quantity and size distribution across EV isolation strategies (Supplemental Figure 1). Similarly, sequencing of small RNA resulted in vastly differing total library sizes, ranging from 3.68E6 ± 1.72E6 reads (qEV sepsis) to 1.17E7 ± 3.76E6 reads (UC volunteer). Two EV samples precipitated from sepsis patients did not properly amplify during sequencing and were excluded from subsequent analyses. Method-dependent capture of miRNAs was assessed by aligning reads to miRBase and expressing mapped miRNAs as percentages of library size (). miRNA enrichment was highest for precipitation-based EV isolation, followed by UC, membrane affinity and SEC. Even though library sizes were similar for UC, exoRNeasy and miRCURY, the latter displayed a 3.5–5-fold higher percentage of mapped miRNAs, respectively. For all isolation methods, relative frequencies of mapped miRNAs for sepsis patients were slightly lower than for volunteers (). The top 10 most highly expressed miRNAs for each method are provided in Supplemental Table 2.
Figure 2. Mean library size and mapped miRNAs for EVs isolated from healthy volunteers (a) and sepsis patients (b). miRNA mapping frequencies (red diamonds) are expressed as percentages of total library size and plotted against the right x-axes. Enrichment of miRNA reads was highest for miRCURY (35.08% and 27.56% for volunteers and patients, respectively) and lowest for qEV (0.79% for volunteers and 0.57% for patients). All data are mean ± SD for 10 volunteers and 9 sepsis patients.
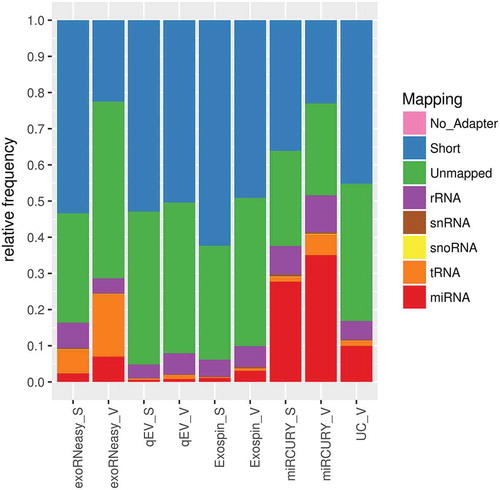
Similar differences were found when mapping reads to further classes of small non-coding RNA (). Expressed as the ratio of non-target reads to miRNA reads, both SEC-based methods tended to isolate more rRNA fragments than other methods (Supplemental Figure 2). Increased frequencies of rRNA reads were also observed in sepsis EVs isolated by membrane affinity. Additionally, membrane affinity captured significantly more tRNA fragments than other methods from both septic and healthy EVs. SEC-based methods, particularly qEV, also isolated large numbers of fragments shorter than 15 nt. Mean library sizes, mapped miRNAs and results from DGE are provided in Supplemental Table 3.
Figure 3. Mapping statistics for various classes of small non-coding RNA. Highest frequencies of miRNA mapping were observed in isolates from precipitation, sedimentation and membrane affinity. Both SEC-based methods were prone to capture short sequences, while libraries from membrane affinity-derived samples contained an increased share of tRNA fragments. Short: sequence is shorter than 15 nt; unmapped: sequence did not align to human rRNA, snRNA, snoRNA, tRNA or miRNA. Data are expressed as mean mapping percentages for 10 volunteers (V) and 9 sepsis patients (S).
EV-miRNAs from precipitation and membrane affinity separate volunteers and patients
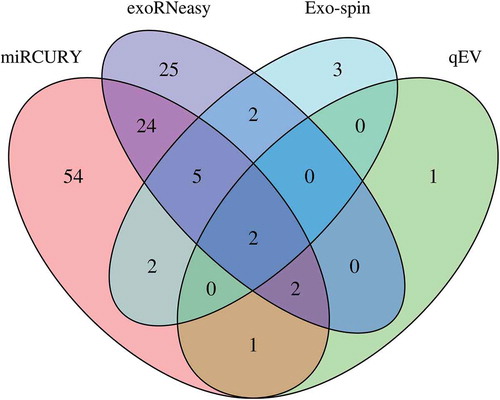
DESeq2 was used to assess differential regulation of miRNA levels between sepsis patients and volunteers for commercial isolation kits. After applying stringent filtering criteria (baseMean ≥50, log2 fold change ≥|1|, adjusted p-value ≤0.05), we found 6 (qEV), 14 (Exo-spin), 60 (exoRNeasy) and 90 (miRCURY) miRNAs to be significantly regulated. While there was minimal overlap between all EV isolation strategies, most regulated miRNAs were unique for a specific isolation method (). A common set of two significantly regulated miRNAs was detected for all EV isolation methods. Data for unfiltered differential expression analysis are provided in Supplemental Figure 3.
Figure 4. Differential expression of miRNAs in EVs isolated by commercial methods. Precipitation and membrane affinity yielded high numbers of differentially regulated miRNAs (miRCURY: 90; exoRNeasy: 60). Far fewer regulated miRNAs were detected in SEC-derived samples (Exo-spin: 14; qEV: 6). Two differentially regulated miRNAs were detected in EVs isolated by all methods. Data are filtered for baseMean ≥50, log2 fold change ≥|1| and adjusted p-value ≤0.05.
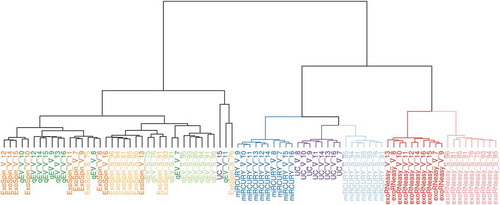
Similarities between miRNA patterns from each patient and isolation method were assessed by hierarchical clustering analysis (HCA) (). Based on all miRNA reads, HCA separated isolation by precipitation, UC and membrane affinity from both SEC-based methods. Within these principal clusters, precipitation and membrane affinity flawlessly separated sepsis patients from healthy volunteers. Even though samples from precipitation and UC showed a high degree of similarity, UC volunteers were more closely related to miRCURY sepsis patients. Clustering of miRNAs from SEC isolation revealed substantial heterogeneity within and overlap between qEV and Exo-spin. Subsequently, these methods did not accurately distinguish volunteers from patients. This was also demonstrated by principal component analysis (Supplemental Figure 4), where separation of patient groups was achieved exclusively by miRCURY and exoRNeasy.
Figure 5. Hierarchical clustering analysis of miRNAs in EVs isolated by commercial methods. Samples split up into two clusters, separating precipitation and membrane affinity from both SEC-based methods. miRCURY (blue) and exoRNeasy (red) accurately distinguished between healthy volunteers (darker shades, V) and sepsis patients (lighter shades, S). miRNAs isolated from SEC-EVs (Exo-spin, qEV) showed noticeable heterogeneity and were less capable of separating volunteers and patients.
The number of differentially regulated miRNAs detected in DESeq2 analysis varied significantly between isolation methods (). Differentially expressed miRNAs as well as corresponding log2 fold changes and adjusted p-values for each method are provided in Supplemental Table 4. As predicted by sequencing output, methods yielding larger libraries also tended to result in more dysregulated miRNAs and greater fold changes. A common set of two miRNAs was found to be differentially expressed in EVs isolated by all methods. In EVs from sepsis patients, miR-122-5p was upregulated with log2 fold changes of 1.86 (Exo-spin) to 4.53 (exoRNeasy). miR-151a-3p, on the other hand, was downregulated in septic EVs, displaying log2 fold changes of −1.18 (miRCURY) to −1.65 (exoRNeasy) ().
Table 2. Common set of miRNAs differentially regulated between sepsis and healthy controls for all EV isolation methods.
EV populations isolated by divergent methods differ in size, concentration and purity
EVs captured by all isolation methods were analysed by NTA. Mean and mode particle diameters ranged from 104.46 ± 11.96 nm and 80.02 ± 10.12 nm (miRCURY volunteer) to 202.86 ± 10.70 nm and 174.48 ± 18.20 nm (exoRNeasy volunteer), respectively ()). Size distributions for sepsis patients were slightly broader for all isolation methods except qEV, but no significant differences in particle diameter were detected between volunteers and patients. The total number of particles isolated from 1 ml serum was highest for miRCURY, followed by Exo-spin, qEV, UC and exoRNeasy ()). Additional plots for particle diameter and concentration are provided in Supplemental Figure 5.
Figure 6. Analysis of EVs by NTA demonstrates differences in size distribution (a). Whiskers indicate 1st and 99th percentiles; line: mean diameter; dot: modal diameter; V: volunteer; S: sepsis patient. Precipitation- and membrane affinity-based methods isolated the smallest and largest EVs, respectively. Concentration and purity of isolated EVs differed depending on isolation strategies (b). Black bars indicate the absolute number of vesicles isolated from 1 ml serum; red diamonds plotted against the right x-axis represent vesicle purity defined as the particle to protein ratio. While precipitation most efficiently isolated EVs from serum, SEC-based isolation yielded fewer but highly pure vesicles. Asterisks indicate significant differences in particle numbers compared to miRCURY. *p < 0.05; **p < 0.01; NS: not significant. All data are mean ± SD for five volunteers and five sepsis patients.
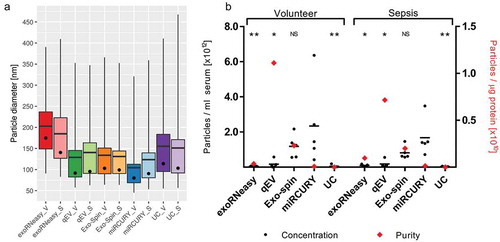
Estimates for sample purity were calculated as ratios between NTA particle counts and protein concentrations [Citation50]. While calculating these ratios does not necessarily help characterize a sample’s EV fraction and their homogeneity, it provides a useful metric for assessing to which degree a sample is contaminated with non-EV protein. SEC-based isolation yielded isolates with significantly higher particle to protein ratios than all other methods, indicating less co-isolation of soluble protein ()). Isolates derived from precipitation and UC, on the other hand, displayed the lowest ratios due to increased protein contamination. Additional data on particle size, concentration and purity are included in Supplemental Table 5.
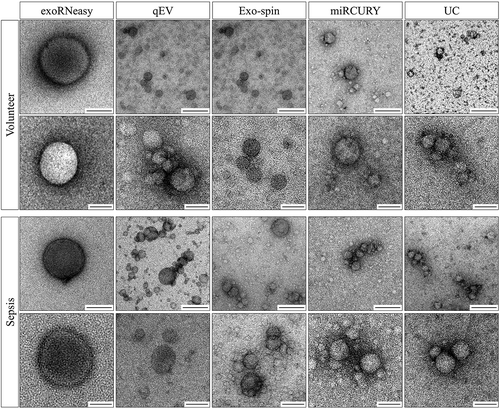
Next, we assessed particle morphology by TEM. Confirming our findings from NTA, we detected particles with EV morphology and size for all isolation methods (). While the majority of vesicles were less than 200 nm in diameter for all methods, precipitation-derived EVs seem to be additionally enriched for particles smaller than 100 nm.
Figure 7. Morphology of serum EVs by transmission electron microscopy. Images are representative for three separate biological replicates for both volunteers (top panel) and sepsis patients (bottom panel). Scale bars are 500 nm (top row) and 100 nm (bottom row).
Enrichment of contaminating soluble protein in EVs isolated by precipitation and UC
Prior to immunoblotting, total protein in EV lysates from each method was quantified by BCA assay. Similar to initial RNA concentrations and sequencing library sizes, striking differences in protein yield were observed (Supplemental Table 6). The amount of total protein in EV isolates ranged from 11.73 ± 5.18 µg (qEV, volunteer) to 26,202.95 ± 3904.31 µg (precipitation, volunteer). On average, precipitation and UC captured 50–80 times the amount of protein derived from SEC and membrane affinity isolations. Protein recovery from volunteer samples was significantly higher (p < 0.05) for exoRNeasy, miRCURY and UC, but failed to reach significance for Exo-spin (p = 0.87). Isolation by qEV captured significantly more (p = 0.01) protein from sepsis patients.
EV-specific proteins as well as negative markers were assessed by Western blot (). CD63, a commonly used vesicle marker, was detected as a broad smear between 30 and 60 kDa, indicating differentially glycosylated forms of the protein. EVs isolated by membrane affinity showed high signal intensities for CD63, while both SEC-based methods resulted in weaker bands. No CD63 was detected for isolation by precipitation and UC. A similar pattern was observed for syntenin, showing clear signals for exoRNeasy, qEV and Exo-spin, but not for miRCURY and UC. EV markers CD81 and TSG101 were not detected for any isolation strategy.
Figure 8. Analysis of marker proteins in EVs from volunteers (left) and sepsis patients (right). EV markers CD63 and syntenin were detected in vesicles isolated by membrane affinity (exoRNeasy) and SEC (qEV, Exo-spin), but not precipitation (miRCURY) and UC. All EV isolates were negative for TSG101, CD81 and calnexin. Significant albumin contamination of EVs was found for non-SEC isolation methods. Results are representative for three separate biological replicates for both volunteers and sepsis patients.
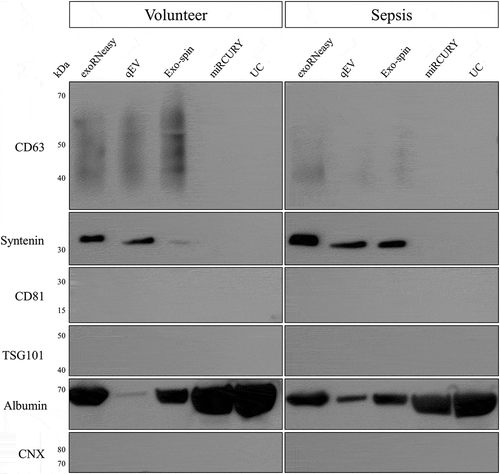
Nonspecific staining of total EV protein by Ponceau S revealed a very prominent band at 60–70 kDa for Exo-spin, miRCURY and UC (Supplemental Figure 6), potentially indicating co-isolation of non-vesicular material. Human serum albumin (HSA), the most abundant blood protein, was selected as a likely candidate for protein contamination in EV preparations. Indeed, Western blot analysis revealed extraordinarily high HSA levels for miRCURY and UC, but also exoRNeasy and Exo-spin (). Only minor amounts of HSA were detected for qEV isolations.
Protein lysates were also analysed for contamination with cellular fragments as indicated by the endoplasmic reticulum protein calnexin. In contrast to HSA, no calnexin signal was detected for any of the isolation methods. These findings hint at a contamination with soluble proteins, but not with non-vesicular membrane fragments. None of the detected protein markers showed significant enrichment for either volunteers or sepsis patients.
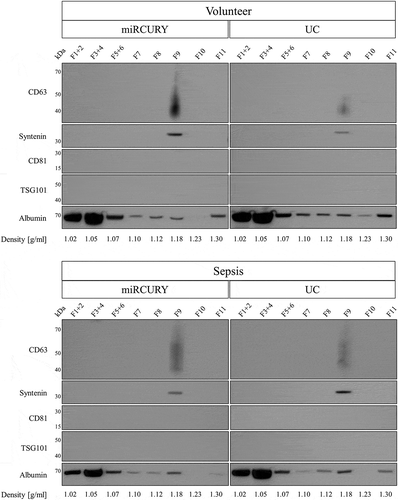
Increased contamination with soluble proteins such as HSA leads to an underrepresentation of marker proteins in EV lysates. As no EV markers were detected for miRCURY and UC, we increased the input for immunoblotting to 50 µg total protein. Additionally, EVs isolated by these techniques were further purified by iodixanol density gradient centrifugation to remove soluble proteins. Even though increasing total protein did not lead to the detection of protein markers (Supplemental Figure 7), floatation into a density gradient effectively separated contaminating HSA from EVs captured by sedimentation and precipitation. While the majority of HSA was retained in fractions of 1.02–1.07 g/ml, EV markers syntenin and CD63 were identified in a fraction of 1.18 g/ml, corresponding to previously reported floatation densities of blood-derived EVs [Citation51] ().
Figure 9. Analysis of EV markers and human serum albumin in EVs isolated by precipitation and sedimentation and further purified by iodixanol density gradient centrifugation. CD63 and syntenin were detected in a density fraction of 1.18 g/ml, while the majority of albumin floated in fractions of 1.02–1.05 g/ml. Results are representative for two separate biological replicates for both volunteers (top panel) and patients (bottom panel).
Discussion
EVs fascinate researchers in basic science and translational applications alike, but our understanding of EV biogenesis, secretion, tissue retention and potential therapeutic use depends on the ability to isolate and characterize specific, well-defined populations of vesicles. The question as to which EV isolation method to utilize for a given downstream application is a frequent subject of controversial debate that has yet to be settled. In this study, we qualitatively and quantitatively compared EV isolation strategies based on different physiochemical mechanisms ranging from sedimentation and precipitation to membrane affinity and SEC. Importantly, we used serum as a biofluid relevant to clinical applications and included diseased patients as well as healthy volunteers. As isolation methods need to be validated using clinical samples, we opted for sepsis patients, who represent a prime example for both interindividual variability and complex aberrations in blood parameters.
High-throughput sequencing has evolved into a mainstream method of analysing nucleic acids. It allows precise quantification of miRNAs and sheds light on RNA composition, co-isolation of non-target molecules and novel classes of non-coding RNA. Using Illumina small RNA-Seq, we found that vesicular RNA profiles greatly depend on the respective EV isolation strategy. While the methods less specific for EVs (precipitation, sedimentation and membrane affinity) resulted in higher absolute and relative numbers of mapped miRNAs, a more stringent size selection on EVs (SEC) led to lower mapping rates and an abundance of short RNA fragments in preparations (). Furthermore, isolates from different methods were reproducibly enriched in fragments of additional short non-coding RNA classes such as tRNA. We have used two different RNA extraction kits in this study, and varying combinations of EV isolation and RNA extraction methods might yield slightly different results [Citation5,Citation52]. However, based on the vastly different characteristics of the material captured by each method, we believe that EV isolation itself has a far greater impact on downstream RNA analysis than the respective extraction method ().
The prime objective of this study was to assess EV isolation methods regarding their suitability for miRNA-based biomarker studies. In our data, the ability to separate healthy individuals from diseased patients strongly correlated with sequencing output for a given method: EV isolation based on precipitation and membrane affinity resulted in higher absolute numbers of mapped miRNA reads, more candidates in DGE analysis and enhanced separation of groups in hierarchical clustering. In contrast, low-output methods (SEC) were also able to identify a core set of two miRNAs differentially regulated regardless of isolation strategy but did not reliably assign individual samples to the correct study population (). Interestingly, only SEC-based methods generated similar or greater numbers of reads from diseased samples, while precipitation and membrane affinity seemed to work more effectively for healthy individuals (Supplemental Table 3). This correlated only partially with particle data from NTA, which indicate that both qEV and exoRNeasy recover more particles from sepsis sera. Even though assessing sequencing library size as a standalone metric is of limited use, results from differential expression analysis correlated with higher sequencing output and more diverse libraries in our data. Library composition might, however, differ depending on sample preparation, as demonstrated by Huang et al. [Citation28]. As different library preparation kits tend to preferentially capture specific RNA sequences, NGS data in different experiments might be biased for certain transcripts. Highly abundant miRNAs are less affected by library preparation-induced biases, which might be more problematic for low-abundance transcripts or biomarker studies in diseases with less extreme alterations in miRNA expression. In conclusion, isolation methods less specific for EVs yielded more RNA, better libraries and, therefore, increased separation of patient groups. More specific methods, which purify EVs rather than enrich cell-free material in general, resulted in less complex libraries, fewer miRNA reads and poor performance in clustering. It is worth noting that increasing sequencing depth for RNA associated with pure vesicle preparations might in turn improve results from DGE analysis.
Observed variations in RNA composition could be attributed to a number of factors including a method’s efficiency of isolating EVs, isolation of non-overlapping subpopulations of vesicles and co-isolation of non-vesicular RNA. As blood samples from sepsis patients and healthy donors were drawn using slightly different methods, potential sampling-related batch effects might confound genuine disease effects. Yet, as shown in hierarchical clustering (), poor separation of sample groups for SEC-based isolation indicates the absence of a systematic batch effect caused by blood sampling. Additionally, in a separate study on paired samples collected by arterial and venous catheters from the same donors, we couldn’t detect any significant sampling-dependent differences in EV morphology and associated miRNA profiles (manuscript in preparation). Differential expression of miRNAs in this study is therefore likely to be caused by sepsis itself, rather than by collection methods.
Several of the miRNAs we found to be differentially expressed (Supplemental Table 4) have previously been associated with sepsis and inflammation. Reithmair et al. and Wang et al. reported increased levels of circulating miR-193b-5p in EVs from sepsis patients and a strong association with disease mortality [Citation34,Citation53]. miR-30a-5p, upregulated in samples from exoRNeasy, miRCURY and Exo-spin, is induced by inflammatory stimuli and discriminates sepsis from non-infectious systemic inflammatory response syndrome [Citation54,Citation55]. Several groups reported that treating macrophages with lipopolysaccharides (LPS) increased expression of miR-155-5p, which, in turn, dampened the immune response, protected septic mice from cardiac dysfunction and improved survival [Citation56–Citation58]. Additionally, circulating levels of miR-155 were shown to correlate with disease severity and poor prognosis in a cohort of 60 sepsis patients [Citation59]. In mice and rats, miR-150-5p, upregulated in samples captured by membrane affinity, was increased by polymicrobial sepsis and LPS treatment, respectively [Citation60,Citation61]. Vasilescu et al. reported plasma levels of miR-150-5p to correlate with sepsis aggressiveness in a cohort of 17 sepsis patients [Citation62]. In concordance with previous findings in critically ill patients, we detected miR-122-5p as upregulated in samples derived from all isolation methods. This miRNA is commonly considered to be liver specific, and increased serum concentrations have been reported in cases of liver injury and hepatotoxicity [Citation63]. Increased serum levels of miR-122-5p were also reported in sepsis patients, correlating with liver damage, coagulation disorders and mortality [Citation53,Citation64,Citation65]. A more recent publication by Roderburg et al., however, demonstrated that miR-122-5p expression in critically ill patients was dysregulated by hepatic injury alone, independent of an infectious state [Citation66]. Exclusively focusing on the septic shock patients in our cohort might have tightened expression patterns of disease-related miRNAs, but as our goal was to assess EV isolation methods capable of also detecting the less severe stage, we did not perform separate analyses on this subgroup. In conclusion, our findings match previous reports about altered profiles of circulating miRNAs in critically ill patients and animal models of sepsis, and crude preparations of cell-free RNA allow for more robust detection of disease-associated differential expression.
In an attempt to shed light on the nature of vesicles isolated by each method, we characterized intact particles using NTA. Unsurprisingly, all methods used in this study isolated particles in the size range of small EVs. Mean particle diameters, however, differed significantly: membrane affinity captured EVs with diameters close to 200 nm, while precipitation isolated vesicles with an exosome-like diameter of 100–120 nm. These differences might be due to capturing different EV populations or manipulation of originally identical EVs during isolation by aggregation [Citation67] or coating with serum proteins [Citation68]. In line with our findings, Stranska et al. recently reported larger particle diameters for EV samples isolated from human plasma by membrane affinity compared to SEC [Citation69]. For most kits, variability of particle diameters was greater in sepsis samples, indicating disease-specific changes in circulating vesicles, or interferences caused by matrix effects in serum from critically ill patients. It is also conceivable that an increased proportion of immune cell-derived EVs or bacterial outer membrane vesicles, typically ranging from 20 to 300 nm in diameter, might contribute to the broader range of particles recovered from septic sera [Citation70,Citation71].
Quantitative analysis of particles revealed another layer of complexity, as precipitation captured both the smallest and the highest number of EVs, whereas particles isolated by membrane affinity were larger and much less abundant. For a given isolation method, seemingly high standard deviations of particle sizes can most likely be attributed to endogenous variability within patient groups. Recent work by Eitan et al. revealed individual-specific set points for EV concentration and composition, indicating the need for larger cohorts in descriptive and clinical EV studies [Citation49]. The slightly decreased concentration of EVs recovered from sepsis patients by most methods could be due to less efficient capture from patient sera, or genuinely lower EV concentrations in serum caused by decreased secretion, increased clearance from the bloodstream, dilution of EVs by therapeutic blood products administered in the ICU or a combination thereof. It should be noted, however, that lipoproteins such as low-density lipoprotein (LDL) outnumber EVs in cell-free blood by at least one order of magnitude and are known to co-purify with EVs [Citation72]. As LDL and other common contaminants such as protein aggregates mimic characteristics of genuine EVs, particle quantification using NTA might overestimate EV concentrations in low-purity preparations and skew isolation-dependent size profiles [Citation73–Citation75]. Interestingly, the ability of extracellular RNA to separate healthy and diseased individuals did not seem to be tied to the diameter of the corresponding EVs since methods isolating both very small (precipitation) and very large (membrane affinity) EVs performed best in differential expression analysis. As these methods are prone to contamination with soluble material (), we cannot rule out the possibility that separation of patient groups is based on RNA not associated with EVs, but co-isolated from the non-vesicular serum compartment. SEC-based methods, on the other hand, isolated EVs contaminated with large quantities of short RNA fragments, rendering them less suitable for robust classification of patient samples. This discovery raises questions about the origin of these fragments and whether they are encapsulated in EVs or co-isolated from non-vesicular blood compartments. While part of the population of short fragments might be derived from RNA degradation and library preparation artefacts such as adaptor dimers, non-human RNA sequences could also contribute to this category. Certain bacteria secrete cell-free RNA, some of it vesicle-associated, which might have been captured from septic sera by the EV isolation methods used here [Citation76,Citation77]. Additionally, reads categorized as unmapped () might be derived from bacterial RNA, even though the frequency of unmapped reads was not significantly increased in sepsis samples. As differential contamination of libraries with non-human sequences would impair normalization to library size or reads per million, we strictly normalized expression values for confirmed human miRNAs. Analysing particle morphology by TEM demonstrated that all methods isolated vesicles in the 100–200 nm size range. Isolates from precipitation did not display significantly more vesicles than other methods, indicating that non-vesicular particles such as protein aggregates might have contributed to increased particle counts in NTA [Citation78]. The number of particles per field shown in does not necessarily correlate to particle concentrations from NTA since different dilution factors were used for samples from each isolation method in TEM imaging. In accordance with recent reports [Citation79], we also observed double vesicles and vesicles containing two or more smaller vesicles.
Further profiling of EV isolates demonstrated an enrichment in CD63 and syntenin for SEC-based and membrane affinity-based isolations, but not for precipitation and UC. Potentially owing to insufficient starting material or technical factors, and in contrast to preexisting publications [Citation23,Citation34,Citation80], we did not detect TSG101 and CD81 for any isolation method. Similar findings were recently presented in a publication by Stranska et al., which demonstrated the absence of CD81 and TSG101 in plasma EVs isolated by membrane affinity [Citation69]. Additionally, recent advances in the field have demonstrated that so-called exosome markers can also be present on other classes of EVs and that EV isolates are a heterogeneous mixture of various subpopulations with specific protein profiles [Citation81,Citation82]. It is therefore conceivable that isolation methods are biased towards only partially overlapping EV populations, resulting in different protein profiles. Additionally, modifications of EVs during isolation, including coating with precipitation polymers or serum proteins, might mask antigens and impede detection of marker proteins as observed elsewhere [Citation83,Citation84]. Even though increasing the input for protein analysis helped other investigators to detect markers in crude EV samples [Citation23], it was not sufficient for samples from precipitation and sedimentation in our study. Additional purification by density gradient centrifugation, however, established the presence of EV markers syntenin and CD63 in fractions with a density of 1.18 g/ml (). While serum albumin and other soluble proteins overpowered EV markers in crude isolates, floatation into a density gradient could be used to specifically purify vesicles from pre-enriched samples. The endoplasmic reticulum marker calnexin could not be detected in lysates from any of the isolation principles, indicating the absence of contaminating cellular fragments and vesicles not originating from endosomes [Citation85]. Contamination of EV preparations with highly abundant blood proteins is a well-known problem, particularly for proteomic analyses [Citation86]. In line with earlier publications, we demonstrate that precipitation- and sedimentation-based isolations co-fractionate significant amounts of serum albumin that mask genuine EV-enriched proteins. Additionally, we herein confirm previous findings [Citation69,Citation83,Citation87] that SEC-based methods represent an efficient way of removing high-abundance serum proteins (Supplemental Figure 6), trading decreased vesicle yield for higher purity [Citation88].
Highly pure and well-defined populations of EVs, however, might not be prerequisite for all research questions. While mechanistic and descriptive scrutinies are crucial for basic research and developing EV therapeutics, biomarker applications rely heavily on pronounced and reproducible changes in the molecules of interest. A recent publication by Quek et al. suggests that impurities in vesicle preparations have little effect on downstream nucleic acid quantification and states the utility of time-efficient, but rather crude EV isolation methods for biomarker discovery [Citation89]. In line with this, we report precipitation-based isolation to yield samples with lower purity and significant protein contamination, but excellent potential for transcriptomics-driven biomarker discovery. We agree with previous publications stating that enriching serum EVs by precipitation might be a viable strategy for biomarker discovery studies [Citation21,Citation23]. Alvarez et al. presented similar findings for profiling RNA biomarkers in urinary EVs [Citation9]. Decreased purity does not have to be a limitation if the objective is enriching cell-free miRNAs rather than purifying specific EV populations. If researchers strive to identify extracellular miRNA signatures that separate patient populations, these could be analysed regardless of their carriers [Citation90]. As long as samples isolated by a given method reproducibly provide strong divisional capabilities for patient populations of interest, comprehensively characterizing isolated vesicles might not be a mandatory requirement for clinical biomarker applications. Given that precipitation is time efficient, inexpensive and demands no specialized equipment, it also seems to conveniently lend itself to integration into clinical usage. However, in a research field as vibrant and international, standardizing reagents and protocols utilized for EV precipitation and characterization are crucial for generating valid and reproducible data across laboratories [Citation22,Citation85,Citation91].
In conclusion, we herein report that enriching cell-free miRNAs by precipitation allows for reliable separation of sepsis patients and healthy volunteers in sequencing-based analyses. As extracellular RNA can be encapsulated in vesicles or stabilized by binding to circulating proteins such as argonaute 2 (Ago2), further investigations using additional purification steps such as density gradient centrifugation or SEC are needed to conclusively verify if miRNAs dysregulated in this study are genuinely encapsulated in EVs [Citation92]. Based on our experiments, we cannot rule out the possibility that miRNAs separating patients and volunteers are associated with non-vesicular carriers rather than EVs [Citation93]. Should this be the case, additional validation of sepsis-related miRNA signatures might be carried out on total cell-free RNA without prior enrichment of EVs, reducing time and cost of analysis. Even though exosomes have been shown to provide an enriched source of miRNA with higher predictive value than total cell-free blood, miRNAs of diagnostic potential might be associated with different carriers in a disease-specific manner, calling for the careful validation of previous findings in each biomarker discovery process [Citation2,Citation94]. In diseases with less drastic clinical manifestation than sepsis, extracellular signalling could be more clearly detectable in pure EVs as opposed to crude preparations of cell-free RNA. Our findings might therefore not be generalizable to all clinical applications, as a different approach may be more appropriate for diseases other than sepsis.
Even though the focus of this work was on transcriptomic profiling of EVs, our findings could be transferred to different routes of analysis as well. It has become increasingly clear that the optimal method of EV isolation differs depending on the respective research setting and downstream analyses. Both failing to choose appropriate isolation methods for a particular experiment and trying to integrate results from multiple studies conducted with inappropriate or incompatible methodology squander resources decrease experimental validity and hamper translation of research findings into practical applications. This work therefore provides valuable guidance for navigating the wide array of EV isolation methods available today.
Supplemental Material
Download Zip (1.3 MB)Acknowledgements
The authors wish to thank Franz Jansen for excellent technical assistance during vesicle isolation and Renate Scheler and PD Dr Ricarda Schumann from the University Eye Hospital LMU Munich for excellent assistance with TEM imaging. The authors are also grateful to Prof. Dr Jörg Kleiber for kindly providing access to the NanoSight LM10. The authors thank Qiagen for providing the exoRNeasy kit used in this study. Qiagen had no role in study design, analysis of data or decisions regarding publication.
Disclosure statement
No potential conflict of interest was reported by the authors.
Supplementary material
Supplementary data can be accessed here
Additional information
Funding
Related Research Data
References
- Gardiner C, Di Vizio D, Sahoo S, et al. Techniques used for the isolation and characterization of extracellular vesicles: results of a worldwide survey. J Extracell Vesicles. 2016;5:1.
- Cheng L, Sharples RA, Scicluna BJ, et al. Exosomes provide a protective and enriched source of miRNA for biomarker profiling compared to intracellular and cell-free blood. J Extracell Vesicles. 2014;3:23743
- Mustapic M, Eitan E, Werner JK Jr., et al. Plasma extracellular vesicles enriched for neuronal origin: a potential window into brain pathologic processes. Front Neurosci. 2017;11:278.
- Buschmann D, Haberberger A, Kirchner B, et al. Toward reliable biomarker signatures in the age of liquid biopsies – how to standardize the small RNA-Seq workflow. Nucleic Acids Res. 2016;44: 5995–18. Epub 2016/ 06/19.
- El-Khoury V, Pierson S, Kaoma T, et al. Assessing cellular and circulating miRNA recovery: the impact of the RNA isolation method and the quantity of input material. Sci Rep. 2016;6:19529.
- Guo Y, Vickers K, Xiong Y, et al. Comprehensive evaluation of extracellular small RNA isolation methods from serum in high throughput sequencing. BMC Genomics. 2017;18:50.
- Danielson KM, Rubio R, Abderazzaq F, et al. High throughput sequencing of extracellular RNA from human plasma. PLoS One. 2017;12:e0164644.
- Van Deun J, Mestdagh P, Sormunen R, et al. The impact of disparate isolation methods for extracellular vesicles on downstream RNA profiling. J Extracell Vesicles. 2014;3:24858.
- Alvarez ML, Khosroheidari M, Kanchi Ravi R, et al. Comparison of protein, microRNA, and mRNA yields using different methods of urinary exosome isolation for the discovery of kidney disease biomarkers. Kidney Int. 2012;82:1024–1032.
- Royo F, Diwan I, Tackett MR, et al. Comparative miRNA analysis of urine extracellular vesicles isolated through five different methods. Cancers (Basel). 2016;8:112
- Blans K, Hansen MS, Sorensen LV, et al. Pellet-free isolation of human and bovine milk extracellular vesicles by size-exclusion chromatography. J Extracell Vesicles. 2017;6:1294340.
- Rekker K, Saare M, Roost AM, et al. Comparison of serum exosome isolation methods for microRNA profiling. Clin Biochem. 2014;47: 135–138. Epub 2013/ 11/05.
- Muller L, Hong CS, Stolz DB, et al. Isolation of biologically-active exosomes from human plasma. J Immunol Methods. 2014;411:55–65.
- Nielsen MH, Beck-Nielsen H, Andersen MN, et al. A flow cytometric method for characterization of circulating cell-derived microparticles in plasma. J Extracell Vesicles. 2017;3:20795.
- Lasser C, Shelke GV, Yeri A, et al. Two distinct extracellular RNA signatures released by a single cell type identified by microarray and next-generation sequencing. RNA Biol. 2017;14:58–72.
- Caponnetto F, Manini I, Skrap M, et al. Size-dependent cellular uptake of exosomes. Nanomedicine. 2017;13:1011–1020.
- Zlotogorski-Hurvitz A, Dayan D, Chaushu G, et al. Human saliva-derived exosomes: comparing methods of isolation. J Histochem Cytochem. 2015;63:181–189.
- Abramowicz A, Widlak P, Pietrowska M. Proteomic analysis of exosomal cargo: the challenge of high purity vesicle isolation. Mol Biosyst. 2016;12: 1407–1419. Epub 2016/ 04/01.
- Royo F, Zuniga-Garcia P, Sanchez-Mosquera P, et al. Different EV enrichment methods suitable for clinical settings yield different subpopulations of urinary extracellular vesicles from human samples. J Extracell Vesicles. 2016;5: 29497. Epub 2016/ 02/20.
- Mol EA, Goumans MJ, Doevendans PA, et al. Higher functionality of extracellular vesicles isolated using size-exclusion chromatography compared to ultracentrifugation. Nanomedicine. 2017;13:2061–2065.
- Andreu Z, Rivas E, Sanguino-Pascual A, et al. Comparative analysis of EV isolation procedures for miRNAs detection in serum samples. J Extracell Vesicles. 2016;5:31655.
- Crossland RE, Norden J, Bibby LA, et al. Evaluation of optimal extracellular vesicle small RNA isolation and qRT-PCR normalisation for serum and urine. J Immunol Methods. 2016;429:39–49.
- Helwa I, Cai J, Drewry MD, et al. A comparative study of serum exosome isolation using differential ultracentrifugation and three commercial reagents. PLoS One. 2017;12:e0170628.
- Bellingham SA, Shambrook M, Hill AF. Quantitative analysis of exosomal miRNA via qPCR and digital PCR. Methods Mol Biol. 2017;1545: 55–70. Epub 2016/ 12/13.
- Zeringer E, Li M, Barta T, et al. Methods for the extraction and RNA profiling of exosomes. World J Methodol. 2013;3: 11–18. Epub 2013/ 03/26.
- Takahashi K, Yan IK, Kim C, et al. Analysis of extracellular RNA by digital PCR. Front Oncol. 2014;4: 129. Epub 2014/ 06/14.
- Li M, Zeringer E, Barta T, et al. Analysis of the RNA content of the exosomes derived from blood serum and urine and its potential as biomarkers. Philos Trans R Soc Lond B Biol Sci. 2014;369 ( Epub 2014/ 08/20).
- Huang X, Yuan T, Tschannen M, et al. Characterization of human plasma-derived exosomal RNAs by deep sequencing. BMC Genomics. 2013;14: 319. Epub 2013/ 05/15.
- Tsang EK, Abell NS, Li X, et al. Small RNA sequencing in cells and exosomes identifies eQTLs and 14q32 as a region of active export. G3 (Bethesda). 2017;7: 31–39. Epub 2016/ 11/04.
- Tang YT, Huang YY, Zheng L, et al. Comparison of isolation methods of exosomes and exosomal RNA from cell culture medium and serum. Int J Mol Med. 2017;40: 834–844. Epub 2017/ 07/25.
- Nimah M, Brilli RJ. Coagulation dysfunction in sepsis and multiple organ system failure. Crit Care Clin. 2003;19:441–458.
- SepNet Critical Care Trials G. Incidence of severe sepsis and septic shock in German intensive care units: the prospective, multicentre INSEP study. Intensive Care Med. 2016;42:1980–1989.
- Charlson ME, Pompei P, Ales KL, et al. A new method of classifying prognostic comorbidity in longitudinal studies: development and validation. J Chronic Dis. 1987;40:373–383.
- Reithmair M, Buschmann D, Märte M, et al. Cellular and extracellular miRNAs are blood-compartment-specific diagnostic targets in sepsis. J Cell Mol Med. 2017;21:2403–2411.
- Spornraft M, Kirchner B, Haase B, et al. Optimization of extraction of circulating RNAs from plasma – enabling small RNA sequencing. PLoS One. 2014;9:e107259.
- Andrews S FastQC: a quality control tool for high throughput sequence data; 2010.
- Kong Y. Btrim: a fast, lightweight adapter and quality trimming program for next-generation sequencing technologies. Genomics. 2011;98:152–153.
- Consortium RN. RNAcentral: an international database of ncRNA sequences. Nucleic Acids Res. 2015;43:D123–D129.
- Kozomara A, Griffiths-Jones S. miRBase: annotating high confidence microRNAs using deep sequencing data. Nucleic Acids Research. 2014;42:D68–D73.
- Langmead B, Trapnell C, Pop M, et al. Ultrafast and memory-efficient alignment of short DNA sequences to the human genome. Genome Biology. 2009;10:R25.
- Love MI, Huber W, Anders S. Moderated estimation of fold change and dispersion for RNA-seq data with DESeq2. Genome Biology. 2014;15:550.
- R Core Team. R: a language and environment for statistical computing. Vienna, Austria; 2017.
- Gregory R, Warnes BB, Bonebakker L, et al. Various R Programming Tools for Plotting Data; 2016.
- Wickham H ggplot2: Elegant Graphics for data analysis; 2009.
- Neuwirth E RColorBrewer: ColorBrewer Palettes. 2014.
- Galili T. dendextend: an R package for visualizing, adjusting and comparing trees of hierarchical clustering. Bioinformatics. 2015;31:3718–3720.
- Yuan Tang MH, Wenxuan L. ggfortify: unified interface to visualize statistical result of popular R Packages; 2016.
- Chen H VennDiagram: generate high-resolution Venn and Euler plots; 2016.
- Eitan E, Green J, Bodogai M, et al. Age-related changes in plasma extracellular vesicle characteristics and internalization by leukocytes. Sci Rep. 2017;7:1342.
- Webber J, Clayton A. How pure are your vesicles? J Extracell Vesicles. 2013;2:19861.
- Kalra H, Adda CG, Liem M, et al. Comparative proteomics evaluation of plasma exosome isolation techniques and assessment of the stability of exosomes in normal human blood plasma. Proteomics. 2013;13: 3354–3364. Epub 2013/ 10/12.
- Eldh M, Lotvall J, Malmhall C, et al. Importance of RNA isolation methods for analysis of exosomal RNA: evaluation of different methods. Mol Immunol. 2012;50:278–286.
- Wang H, Zhang P, Chen W, et al. Serum microRNA signatures identified by Solexa sequencing predict sepsis patients’ mortality: a prospective observational study. PLoS One. 2012;7: e38885. Epub 2012/ 06/22.
- Caserta S, Kern F, Cohen J, et al. Circulating plasma microRNAs can differentiate human sepsis and systemic inflammatory response syndrome (SIRS). Sci Rep. 2016;6: 28006. Epub 2016/ 06/21.
- Jiang X, Xu C, Lei F, et al. MiR-30a targets IL-1alpha and regulates islet functions as an inflammation buffer and response factor. Sci Rep. 2017;7: 5270. Epub 2017/ 07/15.
- Cheng Y, Kuang W, Hao Y, et al. Downregulation of miR-27a* and miR-532-5p and upregulation of miR-146a and miR-155 in LPS-induced RAW264.7. Macrophage Cells Inflammation. 2012;35:1308–1313.
- Tili E, Michaille JJ, Cimino A, et al. Modulation of miR-155 and miR-125b levels following lipopolysaccharide/TNF-alpha stimulation and their possible roles in regulating the response to endotoxin shock. J Immunol. 2007;179: 5082–5089. Epub 2007/ 10/04.
- Zhou Y, Song Y, Shaikh Z, et al. MicroRNA-155 attenuates late sepsis-induced cardiac dysfunction through JNK and beta-arrestin 2. Oncotarget. 2017;8: 47317–47329. Epub 2017/ 05/20.
- Liu J, Shi K, Chen M, et al. Elevated miR-155 expression induces immunosuppression via CD39(+) regulatory T-cells in sepsis patient. Int J Infect Dis. 2015;40: 135–141. Epub 2015/ 10/04.
- Tacke F, Roderburg C, Benz F, et al. Levels of circulating miR-133a are elevated in sepsis and predict mortality in critically ill patients. Crit Care Med. 2014;42: 1096–1104. Epub 2014/ 01/15.
- Sari AN, Korkmaz B, Serin MS, et al. Effects of 5,14-HEDGE, a 20-HETE mimetic, on lipopolysaccharide-induced changes in MyD88/TAK1/IKKbeta/IkappaB-alpha/NF-kappaB pathway and circulating miR-150, miR-223, and miR-297 levels in a rat model of septic shock. Inflamm Res. 2014;63: 741–756. Epub 2014/ 06/12.
- Vasilescu C, Rossi S, Shimizu M, et al. MicroRNA fingerprints identify miR-150 as a plasma prognostic marker in patients with sepsis. PLoS One. 2009;4: e7405. Epub 2009/ 10/14.
- Lin H, Ewing LE, Koturbash I, et al. MicroRNAs as biomarkers for liver injury: current knowledge, challenges and future prospects. Food Chem Toxicol. 2017;110: 229–239. Epub 2017/ 10/19.
- Wang H, Yu B, Deng J, et al. Serum miR-122 correlates with short-term mortality in sepsis patients. Crit Care. 2014;18: 704. Epub 2015/ 02/13.
- Wang HJ, Deng J, Wang JY, et al. Serum miR-122 levels are related to coagulation disorders in sepsis patients. Clin Chem Lab Med. 2014;52: 927–933. Epub 2014/ 01/15.
- Roderburg C, Benz F, Vargas Cardenas D, et al. Elevated miR-122 serum levels are an independent marker of liver injury in inflammatory diseases. Liver Int. 2015;35: 1172–1184. Epub 2014/ 07/22.
- Linares R, Tan S, Gounou C, et al. High-speed centrifugation induces aggregation of extracellular vesicles. J Extracell Vesicles. 2015;4:29509.
- Dominguez-Medina S, McDonough S, Swanglap P, et al. In situ measurement of bovine serum albumin interaction with gold nanospheres. Langmuir. 2012;28:9131–9139.
- Stranska R, Gysbrechts L, Wouters J, et al. Comparison of membrane affinity-based method with size-exclusion chromatography for isolation of exosome-like vesicles from human plasma. J Transl Med. 2018;16: 1. Epub 2018/ 01/11.
- Kaparakis-Liaskos M, Ferrero RL. Immune modulation by bacterial outer membrane vesicles. Nat Rev Immunol. 2015;15: 375–387. Epub 2015/ 05/16.
- Alexander M, Hu R, Runtsch MC, et al. Exosome-delivered microRNAs modulate the inflammatory response to endotoxin. Nat Commun. 2015;6: 7321. Epub 2015/ 06/19.
- Sodar BW, Kittel A, Paloczi K, et al. Low-density lipoprotein mimics blood plasma-derived exosomes and microvesicles during isolation and detection. Sci Rep. 2016;6: 24316. Epub 2016/ 04/19.
- Gyorgy B, Szabo TG, Turiak L, et al. Improved flow cytometric assessment reveals distinct microvesicle (cell-derived microparticle) signatures in joint diseases. PLoS One. 2012;7: e49726. Epub 2012/ 11/28.
- Mork M, Handberg A, Pedersen S, et al. Prospects and limitations of antibody-mediated clearing of lipoproteins from blood plasma prior to nanoparticle tracking analysis of extracellular vesicles. J Extracell Vesicles. 2017;6: 1308779. Epub 2017/ 05/06.
- Gardiner C, Ferreira YJ, Dragovic RA, et al. Extracellular vesicle sizing and enumeration by nanoparticle tracking analysis. J Extracell Vesicles. 2013;2: 19671. Epub 2013/ 09/07.
- Ghosal A. Importance of secreted bacterial RNA in bacterial-host interactions in the gut. Microb Pathog. 2017;104: 161–163. Epub 2017/ 01/24.
- Ghosal A, Upadhyaya BB, Fritz JV, et al. The extracellular RNA complement of Escherichia coli. Microbiologyopen. 2015;4: 252–266. Epub 2015/ 01/23.
- Soo CY, Song Y, Zheng Y, et al. Nanoparticle tracking analysis monitors microvesicle and exosome secretion from immune cells. Immunology. 2012;136: 192–197. Epub 2012/ 02/22.
- Zabeo D, Cvjetkovic A, Lasser C, et al. Exosomes purified from a single cell type have diverse morphology. J Extracell Vesicles. 2017;6: 1329476. Epub 2017/ 07/19.
- Enderle D, Spiel A, Coticchia CM, et al. Characterization of RNA from exosomes and other extracellular vesicles isolated by a novel spin column-based method. PLoS One. 2015;10:e0136133.
- Koliha N, Wiencek Y, Heider U, et al. A novel multiplex bead-based platform highlights the diversity of extracellular vesicles. J Extracell Vesicles. 2016;5:29975.
- Kowal J, Arras G, Colombo M, et al. Proteomic comparison defines novel markers to characterize heterogeneous populations of extracellular vesicle subtypes. Proc Natl Acad Sci U S A. 2016;113:E968–77.
- Gamez-Valero A, Monguio-Tortajada M, Carreras-Planella L, et al. Size-exclusion chromatography-based isolation minimally alters extracellular vesicles’ characteristics compared to precipitating agents. Sci Rep. 2016;6:33641.
- Zarovni N, Corrado A, Guazzi P, et al. Integrated isolation and quantitative analysis of exosome shuttled proteins and nucleic acids using immunocapture approaches. Methods. 2015;87:46–58.
- Lotvall J, Hill AF, Hochberg F, et al. Minimal experimental requirements for definition of extracellular vesicles and their functions: a position statement from the International Society for Extracellular Vesicles. J Extracell Vesicles. 2014;3: 26913. Epub 2014/ 12/30.
- Lobb RJ, Becker M, Wen SW, et al. Optimized exosome isolation protocol for cell culture supernatant and human plasma. J Extracell Vesicles. 2015;4: 27031. Epub 2015/ 07/22.
- Welton JL, Webber JP, Botos LA, et al. Ready-made chromatography columns for extracellular vesicle isolation from plasma. J Extracell Vesicles. 2015;4:27269.
- Baranyai T, Herczeg K, Onodi Z, et al. Isolation of exosomes from blood plasma: qualitative and quantitative comparison of ultracentrifugation and size exclusion chromatography methods. PLoS One. 2015;10:e0145686.
- Quek C, Bellingham SA, Jung CH, et al. Defining the purity of exosomes required for diagnostic profiling of small RNA suitable for biomarker discovery. RNA Biol. 2017;14:245–258.
- Deregibus MC, Figliolini F, D’Antico S, et al. Charge-based precipitation of extracellular vesicles. Int J Mol Med. 2016;38:1359–1366.
- Witwer KW, Soekmadji C, Hill AF, et al. Updating the MISEV minimal requirements for extracellular vesicle studies: building bridges to reproducibility. J Extracell Vesicles. 2017;6: 1396823. Epub 2017/ 12/01.
- Arroyo JD, Chevillet JR, Kroh EM, et al. Argonaute2 complexes carry a population of circulating microRNAs independent of vesicles in human plasma. Proc Natl Acad Sci U S A. 2011;108: 5003–5008. Epub 2011/ 03/09.
- Mateescu B, Kowal EJ, van Balkom BW, et al. Obstacles and opportunities in the functional analysis of extracellular vesicle RNA – an ISEV position paper. J Extracell Vesicles. 2017;6: 1286095. Epub 2017/ 03/23.
- van Eijndhoven MA, Zijlstra JM, Groenewegen NJ, et al. Plasma vesicle miRNAs for therapy response monitoring in Hodgkin lymphoma patients. JCI Insight. 2016;1: e89631. Epub 2016/ 11/25.