
ABSTRACT
Extracellular vesicles (EVs) provide a complex means of intercellular signalling between cells at local and distant sites, both within and between different organs. According to their cell-type specific signatures, EVs can function as a novel class of biomarkers for a variety of diseases, and can be used as drug-delivery vehicles. Furthermore, EVs from certain cell types exert beneficial effects in regenerative medicine and for immune modulation. Several techniques are available to harvest EVs from various body fluids or cell culture supernatants. Classically, differential centrifugation, density gradient centrifugation, size-exclusion chromatography and immunocapturing-based methods are used to harvest EVs from EV-containing liquids. Owing to limitations in the scalability of any of these methods, we designed and optimised a polyethylene glycol (PEG)-based precipitation method to enrich EVs from cell culture supernatants. We demonstrate the reproducibility and scalability of this method and compared its efficacy with more classical EV-harvesting methods. We show that washing of the PEG pellet and the re-precipitation by ultracentrifugation remove a huge proportion of PEG co-precipitated molecules such as bovine serum albumine (BSA). However, supported by the results of the size exclusion chromatography, which revealed a higher purity in terms of particles per milligram protein of the obtained EV samples, PEG-prepared EV samples most likely still contain a certain percentage of other non-EV associated molecules. Since PEG-enriched EVs revealed the same therapeutic activity in an ischemic stroke model than corresponding cells, it is unlikely that such co-purified molecules negatively affect the functional properties of obtained EV samples. In summary, maybe not being the purification method of choice if molecular profiling of pure EV samples is intended, the optimised PEG protocol is a scalable and reproducible method, which can easily be adopted by laboratories equipped with an ultracentrifuge to enrich for functional active EVs.
Introduction
In recent years, extracellular vesicles (EVs) such as exosomes (Ø 70–150 nm) and microvesicles (Ø 100–1,000 nm) have been shown to be significantly contributing towards intercellular signalling pathways under both physiological and pathophysiological conditions [Citation1,Citation2]. EVs can be considered extracellular organelles, which are assembled in a cell-specific manner and can carry a variety of different biologically active molecules. These include proteins involved in cell adhesion (e.g. intercellular adhesion molecules [ICAMs] and integrins), intercellular cell signalling (e.g. cytokines, interleukins and chemokines) and membrane organisation (e.g. tetraspanins and flotillins) as well as coding and non-coding RNAs (including microRNAs), and different types of lipids [Citation1,Citation3–Citation5]. The molecular organisation of their surface provides a kind of address code allowing them to selectively interact with specific target cells [Citation6,Citation7]. Thus, depending on their origin and their cargo, EVs can exert specific functions. For instance, B-cell derived EVs expressing Major Histocompatibility Complex (MHC)-class II molecules are able to induce specific T-cell responses (Raposo et al. 1996). Also, EVs derived from other immune cell-types have been demonstrated to promote pro-inflammatory responses [Citation8]; for example, EVs from mature dendritic cells (DCs) that had been pulsed with tumour-specific antigens can induce antitumour responses in mouse and man [Citation9–Citation12].
In contrast, EVs deriving from tumour cells or from somatic stem cells, especially from mesenchymal stem/stromal cells (MSCs), regularly exert immune suppressive rather than immune stimulating functions [Citation13–Citation15]. Potentially related to their immune suppressive effects, MSC-derived EVs (MSC-EVs) exert beneficial therapeutic effects in animal models for different diseases, including acute kidney failure, myocardial infarction, ischemic stroke and asthma [Citation16–Citation21]. Furthermore, MSC-EVs have been successfully used to treat a steroid-resistant Graft-versus-host disease (GvHD) patient without inducing any side effects [Citation14]. In addition to their therapeutic potential, EVs are increasingly recognised as biomarkers for a variety of different diseases such as cancer [Citation22–Citation24], and are considered drug-delivery vehicles for different substances [Citation20,Citation25,Citation26].
Although the EV field has significantly progressed within the last few years, there is no consensus on optimal isolation and purification methods. Differential (ultra)centrifugation remains the standard technique to harvest EVs from tissue culture supernatants as well as from primary body fluids [Citation27–Citation29]. In addition, amongst others immunoprecipitation techniques [Citation30], ultrafiltration [Citation31] and size-exclusion chromatography [Citation32] are used to enrich for EVs. Recently, increasing numbers of commercially available polymeric precipitation reagents allow for the precipitation of nanosized EVs at low speed centrifugation. However, all of these techniques are more suitable for preparations of small rather than large sample volumes. For example, the largest rotors for ultracentrifugation can process less than 400 mL sample volume in one run. Thus, larger-scale preparation approaches are required. Aiming to prepare exosome-sized EVs (sEVs; 70–150 nm) for therapeutic applications we searched for a novel, cost-effective method that allows harvesting of sEVs from larger sample volumes (up to several litres).
In terms of size and molecular content, EVs and viruses share a number of common features and use parts of the same endosomal machinery for their assembly and release [Citation33]. Owing to these parallels, a discussion had been initiated as to whether some viruses, especially retroviruses, can be considered as malignant exosomes [Citation34]. Independent from the evolutionary relation viruses and EVs indeed share, this discussion led us to the assumption that technologies allowing purification of viruses may provide feasible technologies to purify sEVs as well. Since it is a well-established procedure to concentrate viruses via polyethylene glycol (PEG) precipitation [Citation35–Citation37], we tested for the efficacy of PEG precipitation to concentrate sEVs from cell culture supernatants in both small and large scales. PEG precipitation is affected by the molecular weight of the PEG [Citation38]; thus, we at first compared the efficacy of PEG to precipitate sEVs in relation to these parameters. After selecting suitable conditions, we compared the yield obtained with the small-scale PEG precipitation to that obtained with other methods. Finally, we assessed the reproducibility and the scalability of the established PEG protocol and as a proof of principle investigated the usability of prepared sEVs in downstream applications, i.e. miRNA profiling and proteomic analysis.
Material and methods
Generation of CD63-eGFP transduced HEK293T cells
The coding region of the tetraspanin CD63 was amplified via polymerase chain reaction (PCR) using HEK293T cell cDNA as template. The oligonucleotides used for the PCR reaction were flanked by XhoI or EcoRI restriction site sequences, respectively (5ʹ ACCGATCTCGAGCAATGGCGGTGGAAGGAGGAATG; 3ʹ ACCGATGAATTCTCACCTCGTAGCCACTTCTGATACT). Of note, the 3ʹ-primer was designed without the stop codon of the CD63 gene. XhoI/EcoRI digested PCR products were transferred into the XhoI/EcoRI site of the transient expression vector pEGFP-N1 (Takara Bio Europe/SAS, Saint-Germain-en-Laye, France). The obtained expression cassette was confirmed by Sanger sequencing. To test for the appropriate subcellular distribution of the encoded CD63-eGFP-CD63 fusion protein, the obtained pEGFP-N1-CD63 plasmid and the original pEGFP1 plasmid were transfected into HEK293T cells using Jetpei (Polyplus, Illkirch Cedex, France) transfection reagent according to the manufacturer’s recommendations.
Next, the CD63-EGFP ORF was transferred as NheI/BsrGI restriction fragment from the pEGFP-N1-CD63 plasmid into the lentiviral vector pCL6IEGwo containing the coding region of eGFP (kindly provided by Helmut Hanenberg, University Hospital Essen). The expression cassette of the resulting pCL6-CD63-eGFP lentiviral plasmid was confirmed by Sanger sequencing.
Lentiviral particle containing supernatants were obtained following simultaneous co-transfection of HEK293T cells applying the Jetpei transfection reagent together with the lentiviral plasmid pCL6-CD63-eGFP, the helper plasmid pCD/NL-BH [Citation39] and the codon-optimised, human foamy virus envelope encoding plasmid pcoPE01 [Citation40]. The gene expression from the human cytomegalovirus immediate-early gene enhancer/promoter was induced with 10 mM sodium butyrate (Merck, Darmstadt, Germany) 24 h post transfection. Supernatants containing lentiviral particles were collected 48 h after transfection. Following filtration through 0.45 µm filters (Sartorius, Göttingen, Germany) and concentration by centrifugation at 25,000 × g for 90 min at 4°C in an Avanti J-26 XP centrifuge using a JA 25.50 rotor (Beckman Coulter, Krefeld, Germany) pellets of lentiviral particles were resolved in 2.5 mL Iscove’s Modified Dulbecco’s Medium (IMDM) . Aliquots of 250 µL were stored at −80°C.
HEK293T cells raised in Dulbecco Modified Eagle Medium (DMEM) high glucose supplemented with 10% FBS, 100 U/mL penicillin, 100 U/mL streptomycin and 100 U/mL glutamine (all Life Technologies, Darmstadt, Germany) were transduced by overnight exposure to virus stocks. Successfully transduced cells were purified via fluorescent cell sorting on a fluorescence-activated cell sorting (FACS) Aria I cell sorter (BD Bioscience, Heidelberg, Germany).
Culturing of HEK293T cells and collection of media for the EV preparation
HEK293T-CD63-eGFP cells were cultured with DMEM high glucose supplemented with 10% FBS, 100 U/mL penicillin, 100 U/mL streptomycin and 100 U/mL glutamine (Life Technologies). As soon as the mycoplasma-free cells reached approximately 50% confluency, media for the EV purification were collected each other day until the cells reached 80–90% confluency. Media were centrifuged at 2,000 × g. Supernatants were either used immediately or filtered through a 0.22 µm filter (Sartorius, Göttingen, Germany) and stored at −20°C until usage. After thawing, aliquots were pooled to 500 mL batches. All cells were tested weekly for mycoplasma contamination.
EV uptake experiments
Cells of the immortalised mesenchymal stromal cell line N-KM (normal bone marrow) [Citation41] were cultured in 6- or 24-well plates in 10% FBS, 100 U/mL penicillin, 100 U/mL streptomycin and 100 U/mL glutamine (Life Technologies) supplemented IMDM (Lonza, Cologne, Germany) until they reached approximately 70% confluency.
For the analyses of EV uptake equivalents of 1 × 10⁸ particles of the EV-enriched samples were added to the cells. After incubation for 14–16 h at 37°C, the medium with residual particles was removed and fresh culture media were added. At first, cells were analysed by fluorescent microscopy on an Axio Observer.D1 microscope platform with Plan-Apochromat 20×/0.8 lenses (Zeiss, Oberkochen, Germany). To harvest cells for flow cytometric analysis, cells were treated with 0.25% trypsin (Lonza) for 5 min at 37°C. The enzymatic reaction was stopped by the addition of fresh culture media. Cells were pelleted by centrifugation for 5 min at 800 × g, re-suspended in isotonic solution for flow cytometry (Beckman Coulter) and analysed on a Cytomics FC500 flow cytometer (Beckman Coulter) for their eGFP-intensity. The mean fluorescence intensity was measured for all samples in comparison to untreated N-KM cells.
EV preparation from conditioned cell media
Preparation by direct ultracentrifugation
10 mL of freshly harvested conditioned media were centrifuged at 110,000 × g for 2 h at 4°C in an Optima L7-65 ultracentrifuge using a SW40 swing-out rotor (k factor 299, Beckman Coulter). Obtained pellets were re-suspended in 1 mL phosphate-buffered saline (PBS; Life Technologies). Obtained EVs were either processed immediately, kept on −20°C for short-term or −80°C for long-term storage.
Preparation by differential centrifugation
10 mL conditioned media (freshly harvested or frozen and thawed) were centrifuged at 10,000 × g for 45 min in a 5810R centrifuge (Eppendorf, Hamburg, Germany). Supernatants were transferred to 10 mL Ultra-Clear centrifuge tubes (Beckman Coulter), and EVs were precipitated at 110,000 × g for 2 h at 4°C in an Optima L7-65 ultracentrifuge using a SW40 swing out rotor (k-factor 299, Beckman Coulter). For the comparison of the different methods, obtained pellets were re-suspended in 1 mL PBS, for the comparison of the reproducibility in 250 µL 0.9% sodium chloride (NaCl) (Braun, Melsungen, Germany). Fractions were washed with 11 mL PBS or 10 mL 0.9% NaCl, respectively, and re-precipitated by ultracentrifugation exactly as previously performed. Obtained EVs were either processed immediately, kept on −20°C for short-term or −80°C for long-term storage.
Preparation with PEG
Small-scale preparation
10 mL conditioned media (freshly harvested or frozen and thawed) were centrifuged at 10,000 × g in a 5810R centrifuge (Eppendorf). Obtained supernatants were supplemented with 50% w/v stock solutions of PEG 6000, 8000 or 20000 (Sigma-Aldrich, Taufkirchen, Germany) to final concentrations of 6, 8, 10, 12 and 15% PEG and with 3.75 M NaCl (Sigma-Aldrich) to final concentration of 75 mM NaCl (calculated to 15 mL). Samples were mixed gently by inverting the tubes three times. Unless indicated otherwise, samples were stored at 4°C for up to 14 h (overnight). EVs were concentrated by centrifugation at 1,500 × g for 30 min at 4°C in a 5810R centrifuge (Eppendorf, Hamburg, Germany). Supernatants were removed and pellets re-suspended in 250 µL PBS for initial experiments and 1 mL PBS for the comparison of different methods or 250 µL 0.9% NaCl by pipetting, respectively. To remove residues of PEG from the suspension, the EV-enriched fractions were washed with 11 mL PBS or 10 mL 0.9% NaCl, respectively, and centrifuged at 110,000 × g for 2 h at 4°C in an Optima L7-65 ultracentrifuge using the swing out rotor SW40 (k factor 299, Beckman Coulter). The resulting pellet was re-suspended in 250 µL/1 mL PBS or 250 µL 0.9% NaCl, respectively. Obtained EV samples were kept on −20°C for short or −80°C for long-term storage.
Large-scale preparation
After freezing and thawing 360 mL conditioned media were centrifuged at 6,000 × g in 500 mL conical centrifuge flasks (Beckman Coulter) in an Avanti J-26 XP centrifuge using the swing-out rotor JS-5.3 (Beckman Coulter). Obtained supernatants were transferred into new 500 mL conical centrifuge flasks and supplemented to a final concentration of 10% PEG 6000 and 75 mM NaCl. After overnight incubation at 4°C, EVs were precipitated at 1,500 × g in an Avanti J-26 XP centrifuge using the swing-out rotor JS-5.3 (Beckman Coulter) for 30 min at 4°C. Pellets were re-suspended in 60 mL 0.9% NaCl and transferred in 70 mL polycarbonate centrifuge bottles (Beckman Coulter). Fractions were precipitated at 110,000 × g for 2 h at 4°C in an Optima L7-65 ultracentrifuge using the tight angle rotor Ti45 (k factor 244, Beckman Coulter). Obtained pellets were re-suspended in 1 mL 0.9% NaCl and stored at −80°C until usage.
Preparation with sucrose density gradient
EVs from 10 mL conditioned media were at first prepared by differential centrifugation exactly as described earlier. The obtained fractions (each 1 mL) were loaded onto an 11 mL sucrose density gradient (2.5, 5, 10, 20, 30, 40, 50, 60, 70 and 75%) and centrifuged at 110,000 × g for 16 h at 4°C in a SW45 swing-out rotor in an Optima L7-65 ultracentrifuge (k factor 244, Beckman Coulter). Fractions of 1 mL each were taken from the top to the bottom. After transferring 2 µL onto microscopic slides, drops were checked for the presence of eGFP-labelled particles by fluorescence microscopy using the Axio Observer.D1 platform (Zeiss). Fractions containing fluorescent particles were pooled and diluted with PBS to 12 mL total volume and centrifuged at 110,000 × g for 2 h at 4°C in an Optima L7-65 ultracentrifuge using the swing out rotor SW40 (k factor 299, Beckman Coulter). Resulting pellets were re-suspended in 250 µL PBS and used for EV uptake experiments and Nano particle Tracking Analysis (NTA).
Preparation by size-exclusion chromatography
EVs from 10 mL conditioned media were at first prepared by differential centrifugation exactly as described earlier. The obtained fractions (each 1 mL) were loaded onto columns of 16/60 HiLoad Superdex 200 prep grade (GE Healthcare Europe GmbH, Freiburg, Germany), which were pre-equilibrated with a buffer containing 0.05 M sodium phosphate (pH 7.2) and 0.15 M NaCl using an ÄKTAexplorer 10 (GE Healthcare Europe GmbH, Freiburg, Germany). Fractions of 1 mL were collected at a flow rate of 1 mL/min. The first six elution fractions corresponding to the known retention volume for EVs were pooled and concentrated to 1 mL by ultracentrifugation.
Analysis of obtained EV samples
Fluorescence drop analysis
1–2 µL of the obtained HEK293T-CD63-eGFP samples were transferred to microscopic slides and analysed by an Axio Observer.D1 fluorescent microscope with a Plan-Apochromat 20×/0.8 objective (Zeiss).
Protein content
The protein content of the EV samples was determined using the bicinchoninic acid BCA protein assay kit (Pierce, Rockford, IL, USA). Protein analysis was performed according to the recommendations of the manufacturer using the 96-well plate procedure.
Western blot
Samples were solubilised with Laemmli sample buffer containing DTT (AppliChem, Darmstadt, Germany) and separated on an 1D sodium dodecyl sulfate polyacrylamide gel electrophoresis (SDS-PAGE) gel before transfer to polyvinylidene fluoride membrane (PVDF; Millipore, Darmstadt, Germany). Page Ruler, Prestained Protein ladder (Thermo Fisher, 26616) was used as a marker. PVDF membranes were blocked in PBS-0.1% Tween-20 (PBS-T) or TBS-0.1% Tween-20 (TBS-T) containing 5% (w/v) skim milk powder (Sigma-Aldrich). To rinse off residual blocking solution membranes were washed three times (5, 10 and 20 min) in PBS-T/TBS-T. For the detection of defined proteins, the following primary antibodies (diluted either in PBS-T or TBS-T) were used (clone, dilution, incubation time and temperature, company, article number): mouse anti-human CD9 (VJ1, 1:1000, 4°C overnight, kindly provided by Francisco Sánchez-Madrid), mouse anti-human CD63, (TEA3, 1:1,000, 4°C overnight, kindly provided by Francisco Sánchez-Madrid), mouse anti-human CD81 (JS-81, 1:1,000, 4°C overnight, BD Bioscience, 555675), polyclonal rabbit anti-human/mouse/rat HSP70/HSPA1A (1:1,000, 4°C overnight, R&D Systems, Abingdon, United Kingdom, AF1663), rabbit anti-human/mouse/rat Tsg101 (polyclonal, 1:1,000, 4°C overnight, Sigma-Aldrich, T5701), rabbit anti-Syntenin (EPR8102, 1:1,000, 4°C overnight, Abcam, Cambridge, United Kingdom, ab133267), mouse anti-Prohibitin (II-14-10, 1:250, 4°C overnight, Thermo Fischer, MA5-12858) and rabbit anti-bovine serum albumin-HRP, (polyclonal 1:20,000, 2 h room temperature, Abcam ab7637). To rinse off residual primary antibodies membranes were washed three times (5, 10 and 20 min) in PBS-T/TBS-T.
The following secondary antibodies and detection substrates were used: Peroxidase-AffiniPure F(ab’)2 Fragment Donkey Anti-Mouse IgG (polyclonal, 1:10,000, 1 h room temperature, Jackson ImmunoResearch Laboratories, West Grove, PA, USA, 715-036-150); Peroxidase-AffiniPure F(ab’)2 Fragment Donkey Anti-Rabbit IgG (polyclonal, 1:10,000, 1 h [for Tsg101 2 h] room temperature, Jackson ImmunoResearch Laboratories, 711-036-152; Substrate: SuperSignal® West Femto Maximum Sensitivity Substrate, Thermo Fisher, 34095.
Sample buffer conditions for gel run: non-reducing (denatured but without DTT) for detection of CD9, CD63, CD81; reducing for detection of HSP70, Tsg101, Syntenin, Prohibitin; detection of BSA works with both conditions.
Nanoparticle tracking analysis (NTA)
Average size distribution and particle concentration analyses of the EV samples were performed by NTA. At the beginning of the studies, a Nanosight LM10 instrument equipped with the NTA 2.0 analytical software was used, exactly as described previously [Citation42]. Each sample was measured three times. The 50% median value (D50) and the standard deviation were calculated. For comparison of the differential centrifugation and the PEG 6000 precipitation procedures, both, small and large scales, NTA was performed on the ZetaView platform (Particle Metrix, Meerbusch, Germany). The following dilutions and settings were used:
Electron microscopy
Drops of 4 µL of selected EV samples were loaded on formvar or carbon coated 300 mesh copper grids (Plano, Wetzlar, Germany) for 2 min. The grids were washed in double distilled water and contrasted with either 1% uranyl acetate (SPI Supplies, West Chester, USA) or 0.75% uranyl formate (SPI Supplies) for 1 min. Grids were air dried and examined either on a JEM1400 Plus electron microscope (JEOL, Tokyo, Japan) equipped with a LaB6 cathode at 120 kV using a TemCam-XF416® FastScan CCD camera system (TVIPS, Gauting, Germany) for image acquisition or an EM 902A (Zeiss, Oberkochen, Germany) electron microscope at 80 kV with a Morada slow scan CCD camera connected to a PC running ITEM 5.2 capturing software (Olympus SIS, Münster, Germany).
PEG concentration
The PEG concentration of the samples was measured by a barium-iodide approach, which was analysed by the ODYSSEY CLx 096A infrared imaging system (LI-COR, Bad Homburg, Germany). In detail, 2–12 µg of the EV samples were re-suspended in SDS-sample puffer (Thermo Fisher), heated for 10 min to 75°C and fractioned together with a PEG 6000 concentration series on 4–12% Bis Tris NuPAGE gels (Thermo Fisher) via SDS PAGE. After electrophoresis for 40 min at 200 V in MOPS-buffer (Thermo Fisher) gels were washed twice with distilled water. To visualise the PEG, gels were incubated for 10 min in freshly prepared 5% barium chloride (ROTH, Karlsruhe, Germany) and developed with 0.1 M iodide solution (ROTH, Karlsruhe, Germany) [Citation43,Citation44]. After the positive detection of the PEG signals, the solution was exchanged for distilled water. PEG signals were quantified by with ODYSSEY® CLx 096A infrared imaging system and Image studio software (LI-COR, Bad Homburg, Germany).
miRNA analysis
Total RNA (including miRNA-fraction) was extracted from volumes of 400 µL of conditioned cell culture medium or from EV samples either obtained by the direct ultracentrifugation, differential centrifugation or the PEG method utilising the mirVana PARISTM kit (Ambion, Austin, USA). All steps were performed according to the manufacturer’s instructions.
Relative miRNA-quantification was performed using the miScript system (Qiagen, Hilden, Germany) according to the manufacturer’s instructions. All samples, including non-RT (without reverse transcriptase) and no-template controls were assayed in duplicates. Mean Ct values and deviations between the duplicates were calculated. Samples with a deviation >0.5 within the duplicates or with any evidence for melting curve abnormality were repeated. Spike-in normalisation with synthetic C. elegans derived cel-miR-54 sequence was performed to allow relative comparison across the analysed samples [Citation45]. A normalised Ct value (Ctnorm) for let-7 or miR-16, was determined relatively to the syn-cel-miR-54 signal (Ctnorm = CtmiR-of-interest – Ctsyn-cel-miR-54). Denoted relative abundance values correspond to 2-Ctnorm.
Proteome analyses
Sample preparation for mass spectrometry of EV samples
For the in-gel digestion, 20 µg of EV samples obtained by the large-scale PEG method were separated by SDS PAGE. Staining was obtained by Imperial Stain according to the manufacturer’s instructions (Thermo Fisher). After electrophoresis gels were washed three times for 5 min with distilled water and stained for 2 h. Subsequently, each gel lane was cut in five equal pieces. Destaining, alkylation, reduction, tryptic digestion and peptide extraction was performed according to Schrotter and colleagues [Citation46].
FASP (filter-aided sample preparation) and in-solution digestion
10 µg of EV samples obtained with the large-scale PEG method were diluted with 0.9% NaCl to volumes of 50 µL. Subsequent steps, i.e. carbamidomethylation, alkylation and tryptic digestion, were performed exactly as described before [Citation47,Citation48].
Peptide mass spectrometry (MS)
All samples for MS measurements were purified via C18 tips as described by the manufacturer (Thermo Fisher). Adjusting an equal peptide concentration for all samples was achieved by Nanodrop analysis (Peqlan, Erlangen, Germany) and monolithic HPLC analysis (Agilent, California, USA). LC-ESI MS/MS measurements were performed on a LTQ Orbitrap Velosinstrument (Thermo Fisher) combined with Dionex UltiMateTM 3000- Rapid Separation Liquid Chromatography System (Thermo Scientific). For pre-concentration of peptides a reversed-phase trapping column (Acclaim PepMap RSLC 100 μm × 2 cm, 3 μm particle size, 100 Å pore size, Dionex) in 0.1% TFA was used. For separation of peptides on a 75 μm RP column (RSLC 75 μm × 25 cm, 2 μm particle size, 100 Å pore size) and a gradient (A 0.1% Formic acid (FA) and B 0.1% FA 84% ACN) ranging from 5 to 50% of solution B at a flow rate of 300 nL/min in 90 min. MS survey scans were acquired from 300 to 2,000 m/z at a resolution of 30,000 using the polysiloxane m/z 371.101236 as lock mass [Citation49].
Results
HEK293T-CD63-eGFP cells release eGFP-labelled EVs that can easily be detected by fluorescence microscopy
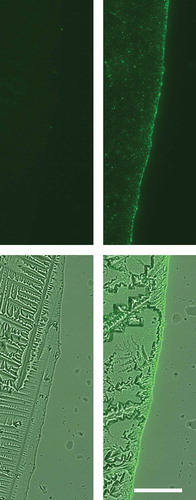
To establish a scalable method to enrich sEVs from tissue culture supernatants, we initially sought a quick way to analyse the amount of precipitated EVs on a qualitative level. To this end, we created expression plasmids containing the coding region for CD63-eGFP fusion proteins, either in a transient expression plasmid (pEGFP-N1-CD63) or in a lentiviral vector (pCL6-CD63-eGFP). Upon comparison of the subcellular distribution of eGFP in HEK293T cells either transfected with the pEGFP-N1-CD63 plasmid or the empty pEGFP-N1 vector, a localised eGFP pattern was observed at the plasma membrane and within the endosomal compartment of HEK293T cells that were successfully transfected with the pEGFP-N1-CD63-eGFP plasmid. In contrast, successfully transfected pEGFP-N1 HEK293T cells showed a uniform eGFP distribution throughout the cells. To test for the presence of eGFP in EV-enriched fractions, supernatants of transfected cells were harvested and processed by direct ultracentrifugation. Drops of 1 to 2 µL of the dissolved pellets were transferred onto slides and analysed by fluorescence microscopy. In contrast to the drops of eGFP-transfected HEK293T cells, drops of CD63-eGFP transfected cells showed a high concentration of eGFP+ particles especially enriched at the drop edges, the contact zone of glass, air and liquid, that could easily be seen at 200 × magnification (). Thus, we concluded that CD63-eGFP fusion proteins but not eGFP itself are efficiently targeted into EVs secreted by HEK293T cells. Subsequently, we transduced HEK293T cells with CD63-eGFP encoding lentiviral particles and observed a subcellular eGFP distribution comparable to the pEGFP-N1-CD63 transfected HEK293T cells. Furthermore, the direct ultracentrifugation pellets of corresponding supernatants were highly enriched in eGFP-labelled particles as well. To obtain a permanent cell source for eGFP labelled EVs, successfully transduced HEK293T-CD63-eGFP cells, which were identified as cells with high eGFP expression, were purified by fluorescent cell sorting. Their conditioned media were used as EV source for all experiments described below.
Figure 1. CD63-eGFP but not eGFP expressing HEK293T cells release high quantities of eGFP-labelled particles into their extracellular environment. After processing of supernatants of HEK293T cells either transfected with eGFP-encoding plasmids (left side) or CD63-eGFP-encoding plasmids (right side) with ultracentrifugation, 1 µL of each resolved pellet was transferred onto a microscopic slide and allowed to dry (results in crystal formation). At the original border of the HEK293T CD63-eGFP drop, high amounts of GFP+-particles were concentrated. Upper row: fluorescent image, lower row: overlay fluorescent and bright field images; scale bar: 50 µm for all images.
PEG precipitates EVs from conditioned cell culture medium
Next, we evaluated whether PEG is an appropriate reagent for the precipitation of CD63-eGFP labelled sEVs from HEK293T-CD63-eGFP cell conditioned media. For the initial setting, PEG 6000, PEG 8000 and PEG 20000 were used either at 6, 8, 10 and 12% or 15% final PEG concentration. Together with NaCl (75 mM final concentration) corresponding amounts of 50% (w/v) PEG stock solutions were added to 10 mL conditioned media that after harvesting as cell supernatants had been filtered through 0.22 µm filters before. Following incubation overnight at 4°C, the samples were centrifuged for 30 min at 1,500 × g. To remove residual PEG and reduce the amount of non-vesicle-associated proteins that might had been co-precipitated, we washed the EV fractions in PBS and re-precipitated them by ultracentrifugation. As a control, EVs from the same volume were precipitated by direct ultracentrifugation.
After confirming the presence of CD63-eGFP labelled EVs by fluorescence microscopy, the particle concentration and their size distribution were analysed by NTA [Citation42,Citation50]. As depicted in , analysis of the particles harvested per mL conditioned media (CM) revealed PEG concentration dependence for all PEG variants. For PEG 6000, the highest particle yield was obtained at a concentration of 10–12%, for PEG 8000 and PEG 20000 at 8–10% (). At these, PEG concentrations the obtained particle numbers were almost in the same range as in the pellets received by ultracentrifugation (UC).
Figure 2. Comparison of different PEG precipitation conditions. Conditioned media were diluted with PEG 6000 (P6), PEG 8000 (P8) or PEG 20000 (P20) to final concentrations of 6, 8, 10, 12 or 15% (v/v), respectively. Following incubation overnight at 4°C, EVs were precipitated by centrifugation at 1,500 × g for 30 min (4°C). EVs precipitated by direct ultracentrifugation (UC), served as control. Obtained pellets were re-suspended in PBS and re-precipitated at 110,000 × g for 2 h (4°C). After dissolving in 250 µL PBS, the particle concentration (n = 5; SD); (a) and their average size distribution (n = 5; SD); (b) were assessed by NTA (LM10). The purity of the obtained samples was determined as particle numbers – measured by NTA – per µg protein content – measured by the BCA assay (n = 5; SEM; (c). The presence of the exosomal marker protein Tsg101 was analysed by western blot; 20 µL of each fraction were loaded per lane (d). Conditioned media were diluted with PEG 8000 to a final concentration of 10% PEG 8000 (v/v). Following incubation for 1, 2, 4 and 8 h or overnight (16 h) at 4°C, respectively, EVs were precipitated by centrifugation at 1,500 × g for 30 min (4°C). Obtained pellets were re-suspended in PBS and re-precipitated at 110,000 × g for 2 h (4°C). After dissolving in 250 µL PBS, the particle concentration was measured by NTA (n = 3; SD) and the presence of the exosomal marker protein Tsg101 was analysed by western blot; 5 µg protein of each Fraction was loaded per lane (e).
Independent of the molecular weight and the concentration of the PEG, the average sizes of the measured particles were in comparable ranges, on an average diameter of 143 ± 20 nm (). In terms of protein concentration within the recovered fraction, the protein content increased with the PEG concentration (Suppl. Table 1). The ratio of particles per mg protein was calculated and considered as purity index of the obtained EV samples (). All PEG enriched EV samples were of higher purity than those obtained by direct ultracentrifugation. On average, the highest purities were obtained with 12% PEG 6000, 8% PEG 8000 and 8% PEG 20000.
Since NTA cannot discriminate between vesicles and other particles, western blots for the exosomal marker protein Tsg101 were performed. To test for EV recovery rather than for the purity, equal volumes of the obtained EV samples were loaded here (). In good agreement with the results of the NTA, the samples with the highest particle numbers were found to contain the highest amount of Tsg101. To further test for the presence of EVs within the obtained PEG samples, transmission electron microscopy (TEM) images were taken. Vesicle-like particles were found in all samples analysed (data not shown). In summary, 10–12% PEG 6000, 8–10% PEG 8000 as well as 8–10% PEG 20000 appeared appropriate to quantitatively precipitate sEVs. Since dissolved PEG 20000 has a higher viscosity and is more difficult to handle without revealing any advantages regarding recovery and purity, PEG 20000 was not considered in the following experiments.
The efficacy of PEG precipitation increases over time reaching the maximum after 8 h
Following the initial experiments in which the sEVs were precipitated overnight, we aimed to reduce the preparation time and compared the EV-yield of 10 mL of HEK293T-CD63-eGFP conditioned media upon reducing the precipitation time to 1, 2, 4 or 8 h at 4°C. Overnight precipitation served as control. As a representative for the selected PEG precipitation conditions, we chose the 10% PEG 8000 precipitation. We observed green fluorescent particles under all conditions. NTA and western blot analyses for Tsg101 showed increasing particle numbers and Tsg101 intensity with increasing precipitation times. The maximum recovery was observed in both analysis (NTA and western blot) after 8 h ().
Comparison of different methods for EV enrichment
In order to assess the efficacy of the PEG precipitation method, we decided to prepare sEVs from HEK293T-CD63-eGFP conditioned media with different EV purification technologies. We performed differential centrifugation, with and without subsequent sucrose gradient centrifugation or size exclusion chromatography using a 1.5 × 45 cm Sepharose CL-2B column, respectively. In relation to the differential centrifugation protocol, 10% PEG 6000 and 10% PEG 8000 precipitation were performed with supernatants that had been centrifuged at 10,000 × g. Direct ultracentrifugation served as control.
All methods were accomplished with a starting volume of 10 mL of freshly harvested conditioned media of HEK293T-CD63 cells.
All obtained samples were analysed by NTA and their protein content was determined. We noticed a significant loss in particle numbers following sucrose-density gradient and size exclusion chromatography (); simultaneously, a slight reduction of the average particle sizes was observed in these samples (). In addition, their protein content was very low. However, these preparations revealed the highest particle content per protein amount, which indicates a higher purity of these samples compared with the EV samples that were obtained by PEG-precipitation, ultracentrifugation or differential centrifugation, respectively (). The yield we obtained from 10 mL conditioned medium was not sufficient to perform all analyses for each sample. In particular, western blots and cellular uptake experiments were not performed with the size exclusion samples and only with reduced amounts of the sucrose gradient samples.
Figure 3. Comparison of different methods to enrich nano-sized EVs. EVs from 10 mL HEK293T-CD63-eGFP (single-cell clones C5, F5, E7 and B2) cell conditioned media were either prepared by direct ultracentrifugation (UC), differential centrifugation (DC), PEG 6000 or PEG 8000 precipitation, density gradient centrifugation (DG), or size-exclusion chromatography (SE). The particle concentration (n = 3; SD, (a) and their average size distribution (n = 3; SD, (b) were assessed by NTA (NanoSight LM10). The purity of the obtained samples was determined as particle numbers – measured by NTA – per µg protein content – measured by the BCA assay (n = 3; SD, (c). The presence of the exosomal marker protein Tsg101 was analysed by western blot; 10 µg of each fraction were loaded per lane (d). Electron micrographs of samples from UC, DC, DG and PEG enriched EVs were acquired; scale bars 200 nm (e). To test for potential impacts on the physiology of the obtained EVs, uptake experiments were performed: 1 × 10⁸ particles as estimated by NTA were supplemented to the media of N-KM cells. After 14–16 h, pictures were taken (f) before the amount of the eGFP labelling was quantified as the mean fluorescence intensity (MFI) by flow cytometry (n = 3; SD, t-test,*p > 0.05, (g)). Scale bars 10 µm.
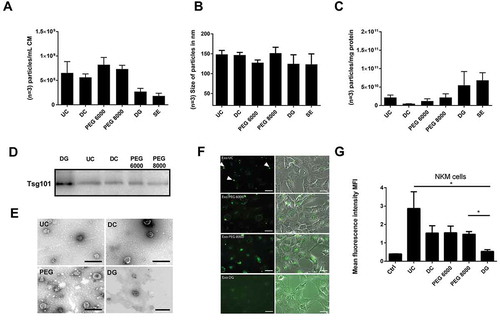
The western blot analyses of 10 µg of the tested EV preparation revealed similar intensities for Tsg101 in the UC, DC and PEG samples. A stronger Tsg101 signal was obtained for the sucrose gradient fraction ()). Differences in the morphology of the EVs prepared by the different methods have not been identified (). Thus, as already suggested by the particle to protein ratio, the sucrose gradient preparation allowed for the highest sEV purification amongst the methods tested here.
PEG does not recognisably affect the uptake of enriched sEVs by their target cells
Aiming to establish a scalable method that can be used for the purification of functional sEVs, it is important that the purification method does not affect their biological properties. Considering that uptake by target cells is an essential prerequisite that EVs can fulfil their function, uptake experiments were performed. To this end, HEK293T-CD63-eGFP sEVs prepared with the different methods were added to cells of the human mesenchymal stromal cell line N-KM. After 18 h, the cells were analysed via fluorescence microscopy () and flow cytometry (). Both technological platforms demonstrated that PEG-precipitated EVs were incorporated in virtually all N-KM cells. The eGFP tagged protein was concentrated in the perinuclear region of the HEK293T-CD63-eGFP EV treated N-KM cells (). Flow cytometric data revealed comparable eGFP intensities in N-KM cells that were incubated with EV samples of the PEG precipitation or the differential centrifugation. N-KM cells that had been incubated with sEVs obtained from direct ultracentrifugation, however, showed a more intense eGFP labelling (). Most likely, this high intensity was caused by non-incorporated eGFP-positive aggregates that had been bound to the extracellular surface of corresponding cells (). In contrast, N-KM cells cultured in the presence of sucrose density gradient centrifugation purified HEK-293T-CD63-eGFP EVs hardly showed any eGFP label (). Since comparable amounts of eGFP+ particles were detected by fluorescence microscopy in sample drops (data not shown), our findings suggest that sucrose alters the EVs’ physiological features during the preparation process. In contrast, PEG precipitation appears as a reliable method to enrich for EVs without affecting their uptake by selected target cells. Based on our results, we concluded that size exclusion chromatography and sucrose density centrifugation in the applied form are not appropriate to prepare EVs in larger amounts for subsequent functional studies.
The PEG-precipitation procedure is a reproducible EV preparation method
So far, the PEG precipitation appeared to be a reliable method to enrich sEVs from cell culture supernatants. To finally qualify a robust PEG protocol, we slightly changed the protocol. Since PEG 20000 is very viscous and more difficult in handling than lower molecular weight PEG variants, we considered that a lower molecular weight of PEG facilitates its removal from given sEV samples. Thus, without detecting significant differences between PEG 6000 and PEG 8000 precipitation, we decided to continue with PEG 6000 only. To keep the concentration as low as possible, we utilised 10% instead of 12% final PEG concentration. To test for the reproducibility of the PEG method, we used conditioned media from four different, single cell-derived CD63-eGFP HEK293T cell lines (clones C5, F5, E7 and B2). Furthermore, we compared the PEG method to the differential centrifugation method. To this end, 60 mL of frozen and thawed conditioned media of each HEK293T-CD63-eGFP cell clone were split into six aliquots, 10 mL each. Three aliquots per clone were processed according to the differential centrifugation protocol. The other three samples per clone were processed according to the PEG protocol and re-suspended in a final volume of 250 µL 0.9% NaCl. Of note, calcium phosphate is purely soluble in water (2.07 × 10⁻³³ mol/L) and efficiently forms nano- to micro-sized crystals (Ca5(PO4)3OH), which can be detected by NTA [Citation51] (Suppl. Figure 1). As biological samples often contain Ca2+ ions, which may end up in prepared EV samples, we decided to replace PBS and any other phosphate-based buffer with clinical grade 0.9% NaCl as solvent and washing solution for this and the following experimental part.
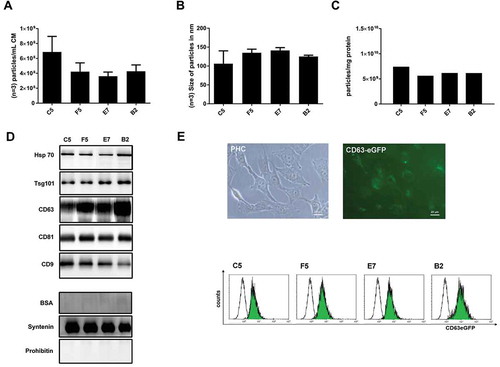
All obtained samples were analysed by NTA to calculate the total particle numbers and the average size of harvested particles; in addition, total protein content of all EV samples was determined, allowing calculation of the EVs’ purity as particles per mg protein (). In terms of particle numbers, higher yields and purities were obtained with the PEG precipitation protocol than with the differential centrifugation protocol (). Particle-sizes and -amounts were comparable between each set of the three samples of the conditioned media obtained from the four different HEK293T-CD63-eGFP clones, when the PEG method was used (). Except for one EV-sample derived from the supernatant of HEK293T-CD63-eGFP clone F5 cells, the purity within the triplicates was comparable as well (). To a larger extent, inter-experimental differences concerning the particle numbers were observed in the samples obtained by the differential centrifugation method (). Thus, in our hands, the PEG method provides higher particle yields and purities and is more reproducible than the differential centrifugation method.
Figure 4. PEG-precipitation versus differential centrifugation (DC). EVs from 10 mL HEK293T-CD63-eGFP cell conditioned media were either prepared by PEG precipitation or differential centrifugation. The particle concentration per fraction (n = 3; SD, (a) and their average size distribution (n = 3; SD, (b)) were assessed by NTA (ZetaView). The purity of the obtained samples was determined as particle numbers – measured by NTA – per mg protein content – measured by the BCA assay (c). The presence of the EV marker proteins HSP70, CD63, CD81 and CD9, and within the individual PEG samples was analysed by western blot; 5 µg proteins were loaded per lane (d). The content of CD81, CD9 and BSA was compared in final EV samples harvested from of HEK293T-CD63-eGFP clones C5, F5, E7, either harvested by PEG 6000 precipitation (PUP) or differential centrifugation (DCP). Proteins obtained from supernatants of the final PEG pellets (PUS) or the ultracentrifugation pellet (DCS) obtained in the differential centrifugation method served as controls. 2.5 µg proteins were loaded per lane (e). Of note, following analyses of CD81 blots were stripped and re-analysed for the presence of BSA.
To confirm the reproducibility of the PEG method at the molecular level, western blot analyses with anti-HSP70, anti-CD-63, anti-CD81 and anti-CD9 were performed (). For all tested antigens, the signal intensities of the bands were comparable in each of the triplicates (). To test for contamination by serum proteins and as HEK293T cells were cultured in the presence of 10% FBS, we compared the BSA content with that of CD81 and CD9 in representative samples. To this end, one of the final PEG and one of the final differential centrifugation samples of the HEK293T-CD63-eGFP clones C5, F5, E7, either obtained by PEG 6000 precipitation or differential centrifugation, were analysed. For comparison, proteins of corresponding final supernatant samples of the PEG precipitation and supernatant samples of the first ultracentrifugation step of the differential centrifugation procedure were analysed as well. CD81 and CD9 were specifically detected in all final samples analysed, but in none of the supernatants (). A clear BSA signal was obtained in the ultracentrifugation supernatant samples of the differential centrifugation method, and a very weak signal in ultracentrifugation supernatants of the PEG method. In a comparable manner, BSA signals were hardly detected in the final PEG samples, but faint bands were recognised in the final differential centrifugation samples ().
Thus, the western blot data confirm a high reproducibility of the final PEG protocol. Furthermore, the results demonstrate that PEG-precipitated sEVs are less contaminated with BSA than sEVs prepared with the differential centrifugation method.
The PEG-precipitation procedure is a scalable method
To test for the scalability of the PEG method, 360 mL conditioned media of each of the four different clonal HEK293T-CD63-eGFP cell lines were processed with the scaled PEG method in 500 mL conical centrifuge vials. Owing to speed limitations of the vials and the JS-5.3 swing-out rotor, thawed conditioned media were centrifuged at 6,000 × g instead of 10,000 × g. PEG and NaCl were added in a scaled manner. Final EV pellets were re-suspended in 1 mL 0.9% NaCl and used for all downstream analyses.
The yield of particles per 1 mL conditioned medium as measured by NTA was roughly in the same range of magnitude for all four preparations than that of the corresponding low-scale PEG preparations ( and ). The average size distribution and purity were comparable as well ( and ). Thus, these data support the scalability of the PEG method. Since we had enough material for downstream analyses here, we comprehensively analysed the obtained samples. Comparable to the low-scale PEG samples, all final samples showed clear bands in western blot analyses probed with anti-HSP70, anti-Tsg101, anti-CD-63, anti-CD81 and anti-CD9 antibodies, respectively. Additionally, clear bands were obtained in western blots for Syntenin but not for BSA, which was probed on the same blot than Syntenin (). To test for the presence of contaminating proteins, western blots for BSA and the mitochondrial protein Prohibitin were performed. Prohibitin and BSA were below the detection levels in all final samples ().
Figure 5. Up-scaling of PEG-precipitation. EVs from 360 mL HEK293T-CD63-eGFP cell conditioned media were prepared by PEG precipitation. The particle concentration per fraction (n = 3; SD, (a) and their average size distribution (n = 3; SD, (b) were assessed by NTA (ZetaView). The purity of the obtained samples was determined as particle numbers – measured by NTA – per mg protein content – measured by the BCA assay (c). The presence of the EV marker proteins HSP70, Tsg101, CD63, CD81 and CD9 within the individual PEG samples was analysed by western blot. Additionally, the content of BSA, Syntenin and Prohibitin within the final samples was compared; 5 µg proteins were loaded per lane (d). To test for potential impacts on the physiology of the obtained EVs, uptake experiments were performed: 30–50 µg of the obtained samples were supplemented to the cell culture media of N-KM cells. After 14–16 h pictures were taken, then, the amount of the eGFP labelling was quantified as the mean fluorescence intensity (MFI) by flow cytometry (e). Scale bars 20 µm.
To document enrichment of the EVs during the PEG 6000 precipitation procedure, western blot analyses for CD81, CD9, HSP70 and Tsg101 were performed on samples of the conditioned media from cells of all four HEK293T-CD63-eGFP clones, on the supernatants and the pellets of the 6,000 × g centrifugation step, the PEG pellets and on the supernatants and the pellets of the final ultracentrifugation procedure. CD81, CD9 and Tsg101 were detected in all PEG pellets and in a more enriched manner in the final samples (Suppl. Figure 2A). Parts of the HSP70 were also found in the supernatant of the ultracentrifugation pellet, resulting in comparable HSP70 concentrations in PEG and ultracentrifugation pellets (Suppl. Figure 2A). In a representative manner, corresponding samples obtained from HEK293T-CD63-eGFP clones E7 and B2 conditioned media were also probed with anti-BSA antibodies. Here, an opposite picture was obtained. BSA was detected in high amounts in the conditioned media and the supernatants and pellets of the 6,000 × g centrifugation step. Massively reduced BSA levels were detected in the PEG pellet and the supernatant of the final ultracentrifugation step but not in the final EV fraction, which – on the same blot – showed strong enrichment of CD81 (Suppl. Figure 2B). The mitochondrial protein Prohibitin was used as a representative marker to detect contaminations caused by cell organelles. It was detected in cell lysates but not in any of the conditioned media fractions (data not shown).
Our analyses demonstrate that PEG 6000 precipitation results in a specific enrichment of EV-associated proteins. Furthermore, co-precipitated contaminants within obtained PEG 6000 pellets, such as BSA, can effectively be reduced from the fraction of the PEG pellet by an additional ultracentrifugation step. Cellular organelle contaminations were not detected. Thus, the large-scale PEG precipitation appears to be a reliable method to highly concentrate sEVs.
To test whether enriched EVs can be taken up by target cells, obtained EVs were added to N-KM cells as described above. Fluorescence microscopy and flow cytometric analyses confirmed incorporation of eGFP into the N-KM cells (), implying that purified CD63-eGFP labelled EVs still retain their properties to be taken up by N-KM cells. Using the same protocol to prepare sEVs from supernatants of MSCs, we demonstrated that these MSC-EVs were able to exert therapeutic effects in different animal models and in a human GvHD patient [Citation14,Citation16,Citation52,Citation53]. Since these PEG-prepared sEV samples exerted the same therapeutic effects in a murine ischemic stroke model than corresponding MSCs [Citation16], our results demonstrate the usability of the PEG-precipitation method as a scalable method for the enrichment of biologically active sEVs.
PEG is efficiently depleted during the washing procedure
In order to quantify the residual PEG concentration in the final HEK293T-CD63-eGFP EV samples that might interfere with down-stream applications, different approaches were performed. Initially, a chloroform-ammonium-iron thiocyanate-extraction method was used to quantify pure PEG [Citation54]. Although PEG could be quantified in PEG-containing control samples, the PEG concentration within the final HEK293T-CD63-eGFP EV samples (clone B2 and C5 EVs were tested) was below the optimal detection range of this method (data not shown). Thus, a more sensitive barium-iodide staining technique [Citation43] was selected to analyse HEK293T-CD63-eGFP EV samples.
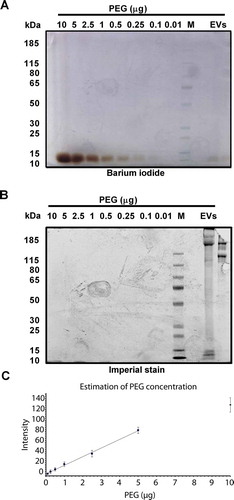
For the quantification, different dilutions of pure PEG were separated on a SDS gel in parallel to EVs harvested from supernatants of HEK293T-CD63-eGFP clone B2 and C5 cells. Following the barium-iodide staining, the PEG bands of the final EV samples showed similar intensities than the bands of the 0.1% PEG dilutions. The analyses of the PEG signals from the EV samples and from the PEG dilution series revealed a PEG concentration of 0.02% in both final HEK293T-CD63-eGFP EV samples tested (). To visualise proteins, the gels were counterstained with the protein specific imperial stain. In contrast to the PEG dilutions, EV sample containing lanes were positively stained (). Thus, only very low PEG levels were detected in both final HEK293T-CD63-eGFP EV samples, demonstrating that the PEG used for the EV precipitation was efficiently washed out during the final steps of the applied PEG precipitation procedure.
Figure 6. Detection of residual PEG. Two gels were loaded with PEG 6000 in decreasing amounts (10, 5, 2.5, 1, 0.5, 0.25, 0.1, 0.01 µg), protein marker, and 6 µg of the final EV samples of HEK293T-CD63-eGF clone B2 and C5 cells. Gels were run under identical conditions. PEG was detectable after barium iodide staining (a); proteins following protein specific imperial stain (b). Signals in (a) were recorded with Image Studio™ Software (LI-COR) and plotted against the PEG concentration of the calibration values (c). The graphic evolution indicates a linear equation of y = 15.692× + 3.4984 which was used to calculate the revealed PEG concentration of 0.02% in the final EV samples.
Following FASP protein PEG-samples can be effectively analysed by proteomic profiling
Owing to the presence of some residual PEG in final samples, its potential interference with proteomic profiling was investigated in a proof of principle experiment. In order to deplete residual PEG a SDS PAGE of 20 µg of the final HEK293T-CD63-eGFP clone C5 EV sample was run, including a proteolytic in-gel digestion. Owing to the sensitivity of modern MS/MS devices, PEG-originated signals were still detectable (Suppl Figure 3A), which interfered with the peptide counts of corresponding peptides resulting in a decrease of the sensitivity of the proteome analysis. To eliminate the residual PEG, a FASP was performed. After FASP, purified samples hardly contained any PEG reminiscent that was detected in subsequent MS/MS analyses (Suppl. Figure 3B). Thus, in combination with the ultracentrifugation-based washing procedure and the FASP, the applied PEG procedure can be combined with proteomic analyses.
PEG-precipitation does not interfere with the enrichment and detection of vesicle-associated microRNAs
To test whether residual PEG interferes with the enrichment and quantitative assessment of EV-associated microRNAs (miRNAs), a proof of principle miRNA analysis on a PEG-precipitated HEK293T-CD63-eGFP sEV fraction was performed in comparison to corresponding sEV samples obtained from differential centrifugation or direct ultracentrifugation, respectively. To this end, the abundance of the EV-associated miRNA let-7a and of the Argonaute 2-associated miR-16, reported as being excluded from EVs [Citation45,Citation55], was analysed.
Using the PCR-based StepOnePlusTM system, both microRNAs were shown to be expressed in HEK293T-CD63-eGFP cells. In RNA fractions extracted from 400 µL HEK293T-CD63-eGFP cell-conditioned medium, a robust miR-16 level was confirmed in a proof of principle experiment, whereas let-7a was hardly detectable. In contrast, the sEV samples prepared from volumes of 50 mL HEK293T-CD63-eGFP cell-conditioned medium contained increased levels of let-7a, but hardly any miR-16 (Suppl. Figure 4). Highest let-7a levels were found in the sEV fraction prepared with the PEG method. Thus, the PEG-precipitation apparently does not interfere with the qualitative and quantitative assessment of EV-associated microRNAs.
Discussion
To establish a cost-effective method allowing preparation of sEVs from larger sample volumes (up to several litres) for functional studies, we have optimised a PEG precipitation protocol. To efficiently concentrate sEVs, we finally added PEG 6000 and NaCl to concentrations of 10% PEG and 75 mM NaCl to conditioned cell culture media. Following incubation for at least 8 h at 4°C, sEVs were precipitated at 1,500 × g. The presence of contaminants was reduced by washing with 0.9% NaCl and re-precipitation of the sEVs by ultracentrifugation. Our results confirm the reproducibility and scalability of the developed method. In proof of principle experiments, we show that sEVs prepared with the PEG method are effectively incorporated into target cells. Furthermore, we have successfully used the optimised PEG method to prepare sEV samples for the preclinical and clinical setting from several litres of MSC-conditioned media [Citation14,Citation16,Citation52,Citation53]. Upon comparing the therapeutic impacts of such MSC-EV samples with that of corresponding MSCs in a murine ischemic stroke model, we did not detect any functional difference [Citation16]. We also did not detect any impact on the average particle size of sEVs. Thus, PEG which under certain conditions can promote membrane fusion, apparently does not interfere with the integrity of EVs and allows preparation of functional sEVs from cell culture supernatants.
As described, sEVs seem to exert most therapeutic functions of MSCs [Citation16,Citation56]. However, in other cell systems larger vesicles have been found to also mediate functional activities [Citation57]. Although we have not tested this, larger EVs very likely can be co-enriched if the 10,000/6,000 × g centrifugation and the 0.22 µm filtration steps are dropped. In the presented experiments, we used unprocessed FBS to raise the HEK293T-CD63-eGFP cells. As FBS is known to contain sEVs, non-metabolised FBS sEVs were very likely included in the obtained sEV samples. It was not our aim to remove them or estimate their content. However, if prepared sEV samples should not contain any medium derived-sEVs, the usage of EV-reduced/depleted/free media is required to raise the cells. The PEG method certainly will not allow to separate different sEV types from each other.
In addition to functional studies, obtained sEVs samples can be used for proteomic and miRNA analyses. Indeed, Andreu and colleagues compared several commercial and non-commercial methods to enrich EVs from frozen serum samples to subsequently extract EV-associated miRNAs and obtained the best result with our optimised PEG protocol [Citation58]. In addition, other groups have enriched EVs via PEG precipitation and successfully used these EVs for proteomic analyses [Citation59,Citation60]. Thus, we and others have demonstrated that in addition to functional assays PEG precipitation is a reliable method to enrich EVs for molecular downstream analyses. However, upon comparison of sEV samples prepared with the optimised PEG protocol with sEV samples prepared by size exclusion chromatography or sucrose density gradient centrifugation, we learned that higher purity indices can be obtained with the later methods. Accordingly, we like to conclude that despite their functional activities PEG-prepared sEV samples contain several non-EV associated molecules, which have not been identified, yet. Especially, if sEVs are enriched from plasma samples or other protein rich body liquids, non-EV associated molecules might by far be stronger concentrated than the sEVs, questioning whether PEG precipitation should be the method of choice for the sEV preparation out of such liquids. Similarly, although PEG-prepared samples can be used for molecular analyses, other low-scale methods being able to enrich EVs to higher purities might be preferred for down-stream molecular analysis. In this context, we and others have demonstrated that the combination of different methods or immunecapturing technologies allow the separation of sEVs from other components frequently co-purified with sEVs and provide several surprises, e.g. that several miRNAs considered to be EV-associated are eluted in other fractions than exosomal marker proteins [Citation61–Citation64].
Regarding the reproducibility of the optimised PEG protocol, we learned that the results obtained with the PEG protocol were much more reproducible than those obtained with the conventional differential centrifugation (DC) protocol. Following UC in the DC protocol, EV pellets appeared very fragile and immediately resolved partially in the supernatant if they were not handled very carefully. To avoid the EV loss, some residual supernatant is commonly left on the pellet. Especially, non-trained experimenters tend to leave higher volumes of supernatants on the pellets than trained ones. Since supernatants have very high protein contents, residual amounts of the supernatant significantly affect the purity of obtained sEV samples, even after a washing step. Maybe by means of some residual PEG, the UC pellet following PEG precipitation is much more solid and was found to hardly get lost even if non-trained experimenters performed the PEG precipitation. Remaining supernatant could easily be rinsed off without affecting the integrity of these UC pellets. Although intensive training helped to increase the purity of DC-prepared sEV samples over time, even best trained experimenters hardly reached the same purity with the DC method than with the optimised PEG protocol. BSA contaminations were always detected in final DC sEV samples but hardly in any of the final PEG sEV samples ( and (d)). Thus, purer sEV samples can be obtained with the optimised PEG method compared to the conventional DC method.
Several companies provide polymer-based EV precipitation reagents, commonly also based on PEG. Regularly, washing procedures of resulting pellets are not part of the proposed protocols. As demonstrated in Suppl. Figure 2, PEG pellets prepared with our method contain detectable levels of BSA before ultracentrifugation. Following ultracentrifugation, the BSA is mainly recovered in the supernatant but not in the final sEV fraction. Although we have not tested any of the commercial EV precipitation polymers in the present investigation, we like to predict that a washing procedure will also help to increase the purity of these samples. Similar to our results, Rider and colleagues demonstrated that following PEG precipitation ultracentrifugation increased the purity of the obtained EV samples [Citation59].
Upon comparing sEV samples prepared by PEG precipitation with EV samples prepared by sucrose density gradient centrifugation or size exclusion chromatography, respectively, we learned that higher purities – as indicated as particle numbers measured by NTA per mg protein within the EV fraction – are obtained with the latter methods. However, in our hands, the recovery rates were not very high and sucrose gradient purified EVs did not get incorporated into target cells. Apparently, sucrose density gradient centrifugation affects the physiological properties of the prepared EVs. Thus, although the PEG method may not purify EVs to the highest level, EVs apparently retain their physiological activity. Furthermore, the method is scalable, for example, for our pre-clinical studies we had purified with the optimised protocol up to 10 L MSC-conditioned media within 2 days. Thus, for the first time, the PEG precipitation method provided the chance to process volumes required to obtain enough EVs for the clinical setting [Citation14]. Although, we and others currently focus on closed systems to prepare EVs for the clinical setting, such as tangential flow filtration eventually in combination with other methods [Citation61,Citation65,Citation66], according to their confirmed therapeutic effects, PEG-prepared EVs will for the moment serve as reference regarding purity and activity.
Supplemental Material
Download Zip (2.3 MB)Acknowledgement
We thank André Görgens, Simon Staubach, Willem Stoorvogel and Daniel J. Weiss for discussion and proof-reading, Helmut Hanenberg for the lentiviral vectors and Tobias May for providing N-KM cells.
Disclosure statement
No potential conflict of interest was reported by the authors.
Supplementary material
Supplemental data for this article can be accessed here.
Additional information
Funding
Related Research Data
References
- Yanez-Mo M, Siljander PR, Andreu Z, et al. Biological properties of extracellular vesicles and their physiological functions. J Extracell Vesicles. 2015;4:1. . PubMed PMID: 25979354; PubMed Central PMCID: PMCPMC4433489. eng
- Ludwig AK, Giebel B. Exosomes: small vesicles participating in intercellular communication [Research Support, Non-U.S. Gov’t]. Int J Biochem Cell Biol. 2012;44(1):11–20. . PubMed PMID: 22024155; eng.
- Valadi H, Ekstrom K, Bossios A, et al. Exosome-mediated transfer of mRNAs and microRNAs is a novel mechanism of genetic exchange between cells. Nat Cell Biol. 2007;9(6):654–659. doi: ncb1596 [pii] 10.1038/ncb1596. PubMed PMID: 17486113; eng
- Skog J, Wurdinger T, van Rijn S, et al. Glioblastoma microvesicles transport RNA and proteins that promote tumour growth and provide diagnostic biomarkers. Nat Cell Biol. 2008;10(12):1470–1476. doi: ncb1800 [pii]10.1038/ncb1800. PubMed PMID: 19011622; eng
- Cossetti C, Iraci N, Mercer TR, et al. Extracellular vesicles from neural stem cells transfer IFN-gamma via Ifngr1 to activate Stat1 signaling in target cells. Mol Cell. 2014;56(2):193–204. . PubMed PMID: 25242146
- Rana S, Zoller M. Exosome target cell selection and the importance of exosomal tetraspanins: a hypothesis. Biochem Soc Trans. 2011;39(2):559–562. doi: BST0390559 [pii]10.1042/BST0390559. PubMed PMID: 21428939; eng
- Hoshino A, Costa-Silva B, Shen TL, et al. Tumour exosome integrins determine organotropic metastasis [Article]. Nature. 2015;527(7578):329–335. . PubMed PMID: 26524530
- Robbins PD, Morelli AE. Regulation of immune responses by extracellular vesicles [Research Support, N.I.H., Extramural Review]. Nat Reviews Immunol. 2014;14(3):195–208. . PubMed PMID: 24566916; eng
- Zitvogel L, Regnault A, Lozier A, et al. Eradication of established murine tumors using a novel cell-free vaccine: dendritic cell-derived exosomes. Nat Med. 1998;4(5):594–600. PubMed PMID: 9585234; eng
- Escudier B, Dorval T, Chaput N, et al. Vaccination of metastatic melanoma patients with autologous dendritic cell (DC) derived-exosomes: results of thefirst phase I clinical trial. J Transl Med. 2005;3(1):10. . PubMed PMID: 15740633; PubMed Central PMCID: PMCPMC554765. Eng
- Morse MA, Garst J, Osada T, et al. A phase I study of dexosome immunotherapy in patients with advanced non-small cell lung cancer. J Transl Med. 2005;3(1):9. . PubMed PMID: 15723705; PubMed Central PMCID: PMCPMC551593. Eng
- Besse B, Charrier M, Lapierre V, et al. Dendritic cell-derived exosomes as maintenance immunotherapy after first line chemotherapy in NSCLC. Oncoimmunology. 2016;5(4):e1071008. . PubMed PMID: 27141373; PubMed Central PMCID: PMCPMC4839329
- Altevogt P, Bretz NP, Ridinger J, et al. Novel insights into exosome-induced, tumor-associated inflammation and immunomodulation. Semin Cancer Biol. 2014;28:51–57. . PubMed PMID: 24769223
- Kordelas L, Rebmann V, Ludwig AK, et al. MSC-derived exosomes: a novel tool to treat therapy-refractory graft-versus-host disease [Letter]. Leukemia. 2014;28(4):970–973. . PubMed PMID: 24445866; eng
- Borger V, Bremer M, Ferrer-Tur R, et al. Mesenchymal stem/stromal cell-derived extracellular vesicles and their potential as novel immunomodulatory therapeutic agents. Int J Mol Sci. 2017;18(7). DOI:10.3390/ijms18071450 PubMed PMID: 28684664; PubMed Central PMCID: PMCPMC5535941.
- Doeppner TR, Herz J, Gorgens A, et al. Extracellular vesicles improve post-stroke neuroregeneration and prevent postischemic immunosuppression. Stem Cells Transl Med. 2015;4(10):1131–1143. . PubMed PMID: 26339036; PubMed Central PMCID: PMCPMC4572905
- Lai RC, Arslan F, Lee MM, et al. Exosome secreted by MSC reduces myocardial ischemia/reperfusion injury. Stem Cell Res. 2010;4(3):214–222. doi: S1873-5061(09)00141-X [pii]10.1016/j.scr.2009.12.003. PubMed PMID: 20138817; eng
- Bruno S, Grange C, Deregibus MC, et al. Mesenchymal stem cell-derived microvesicles protect against acute tubular injury [Research Support, Non-U.S. Gov’t]. J Am Soc Nephrology: JASN. 2009;20(5):1053–1067. . PubMed PMID: 19389847; PubMed Central PMCID: PMC2676194. eng
- Xin H, Li Y, Cui Y, et al. Systemic administration of exosomes released from mesenchymal stromal cells promote functional recovery and neurovascular plasticity after stroke in rats [Research Support, N.I.H., Extramural]. J Cerebral Blood Flow Metabolism. 2013;33(11):1711–1715. . PubMed PMID: 23963371; PubMed Central PMCID: PMC3824189. eng
- Lener T, Gimona M, Aigner L, et al. Applying extracellular vesicles based therapeutics in clinical trials - an ISEV position paper. J Extracell Vesicles. 2015;4:30087. . PubMed PMID: 26725829; PubMed Central PMCID: PMCPMC4698466
- Cruz FF, Borg ZD, Goodwin M, et al. Systemic administration of human bone marrow-derived mesenchymal stromal cell extracellular vesicles ameliorates aspergillus hyphal extract-induced allergic airway inflammation in immunocompetent mice. Stem Cells Transl Med. 2015;4(11):1302–1316. . PubMed PMID: 26378259; PubMed Central PMCID: PMCPMC4622402
- Melo SA, Luecke LB, Kahlert C, et al. Glypican-1 identifies cancer exosomes and detects early pancreatic cancer. Nature. 2015;523(7559):177–182. . PubMed PMID: 26106858
- Boukouris S, Mathivanan S. Exosomes in bodily fluids are a highly stable resource of disease biomarkers. Proteomics Clin Appl. 2015;9(3–4):358–367. . PubMed PMID: 25684126
- Fais S, O’Driscoll L, Borras FE, et al. Evidence-based clinical use of nanoscale extracellular vesicles in nanomedicine. ACS Nano. 2016;10(4):3886–3899. . PubMed PMID: 26978483
- van der Meel R, Fens MH, Vader P, et al. Extracellular vesicles as drug delivery systems: lessons from the liposome field. J Controlled Release. 2014;195:72–85. . PubMed PMID: 25094032
- Johnsen KB, Gudbergsson JM, Skov MN, et al. A comprehensive overview of exosomes as drug delivery vehicles - endogenous nanocarriers for targeted cancer therapy. Biochim Biophys Acta. 2014;1846(1):75–87. . PubMed PMID: 24747178
- Thery C, Amigorena S, Raposo G, et al. Isolation and characterization of exosomes from cell culture supernatants and biological fluids. Curr Protoc Cell Biol. 2006;Chapter 3:Unit 3 22. . PubMed PMID: 18228490; eng
- Witwer KW, Buzas EI, Bemis LT, et al. Standardization of sample collection, isolation and analysis methods in extracellular vesicle research. J Extracell Vesicles. 2013;2. PubMed PMID: 24009894; PubMed Central PMCID: PMCPMC3760646. eng. DOI:10.3402/jev.v2i0.20360.
- Johnstone RM, Adam M, Hammond JR, et al. Vesicle formation during reticulocyte maturation. Association of plasma membrane activities with released vesicles (exosomes). J Biol Chem. 1987;262(19):9412–9420. PubMed PMID: 3597417
- Clayton A, Court J, Navabi H, et al. Analysis of antigen presenting cell derived exosomes, based on immuno-magnetic isolation and flow cytometry. J Immunol Methods. 2001;247(1–2):163–174. doi: S0022-1759(00)00321-5 [pii]. PubMed PMID: 11150547; eng
- Lamparski HG, Metha-Damani A, Yao JY, et al. Production and characterization of clinical grade exosomes derived from dendritic cells [Research Support, U.S. Gov’t, P.H.S.]. J Immunol Methods. 2002;270(2):211–226. PubMed PMID: 12379326; eng
- Taylor DD, Lyons KS, Gercel-Taylor C. Shed membrane fragment-associated markers for endometrial and ovarian cancers. Gynecol Oncol. 2002;84(3):443–448. doi: 10.1006/gyno.2001.6551 S0090825801965515 [pii]. PubMed PMID: 11855885; eng
- Nguyen DG, Booth A, Gould SJ, et al. Evidence that HIV budding in primary macrophages occurs through the exosome release pathway. J Biol Chem. 2003;278(52):52347–52354. . PubMed PMID: 14561735
- Pelchen-Matthews A, Raposo G, Marsh M. Endosomes, exosomes and Trojan viruses. Trends Microbiol. 2004;12(7):310–316. . PubMed PMID: 15223058
- Vajda BP. Concentration and purification of viruses and bacteriophages with polyethylene glycol. Folia Microbiol (Praha). 1978;23(1):88–96. PubMed PMID: 23986
- Kanarek AD, Tribe GW. Concentration of certain myxoviruses with polyethylene glycol. Nature. 1967;214(5091):927–928. PubMed PMID: 6069691
- Kohno T, Mohan S, Goto T, et al. A new improved method for the concentration of HIV-1 infective particles [Evaluation Studies Research Support, Non-U.S. Gov’t]. J Virol Methods. 2002;106(2):167–173. PubMed PMID: 12393147; eng
- Bronson DL, Elliott AY, Ritzi D. Concentration of Rous sarcoma virus from tissue culture fluids with polyethylene glycol. Appl Microbiol. 1975;30(3):464–471. PubMed PMID: 52343; PubMed Central PMCID: PMCPMC187204
- Mochizuki H, Schwartz JP, Tanaka K, et al. High-titer human immunodeficiency virus type 1-based vector systems for gene delivery into nondividing cells. J Virol. 1998;72(11):8873–8883. PubMed PMID: 9765432; PubMed Central PMCID: PMC110304. eng.
- Müllers E, Uhlig T, Stirnnagel K, et al. Novel functions of prototype foamy virus Gag glycine- arginine-rich boxes in reverse transcription and particle morphogenesis [Research Support, Non-U.S. Gov’t]. J Virol. 2011;85(4):1452–1463. . PubMed PMID: 21106749; PubMed Central PMCID: PMC3028916. eng
- Lipps C, Klein F, Wahlicht T, et al. Expansion of functional personalized cells with specific transgene combinations. Nat Commun. 2018;9(1):994. . PubMed PMID: 29520052; PubMed Central PMCID: PMCPMC5843645
- Sokolova V, Ludwig AK, Hornung S, et al. Characterisation of exosomes derived from human cells by nanoparticle tracking analysis and scanning electron microscopy. Colloids Surf B Biointerfaces. 2011;87(1):146–150. . PubMed PMID: 21640565; eng
- Kurfurst MM. Detection and molecular weight determination of polyethylene glycol-modified hirudin by staining after sodium dodecyl sulfate-polyacrylamide gel electrophoresis. Anal Biochem. 1992;200(2):244–248. PubMed PMID: 1378701
- Batra J, Robinson J, Mehner C, et al. PEGylation extends circulation half-life while preserving in vitro and in vivo activity of tissue inhibitor of metalloproteinases-1 (TIMP-1). PLoS One. 2012;7(11):e50028. . PubMed PMID: 23185522; PubMed Central PMCID: PMCPMC3502186
- Mitchell PS, Parkin RK, Kroh EM, et al. Circulating microRNAs as stable blood-based markers for cancer detection. Proc Natl Acad Sci U S A. 2008;105(30):10513–10518. . PubMed PMID: 18663219; PubMed Central PMCID: PMCPMC2492472
- Schrotter A, Pfeiffer K, El Magraoui F, et al. The Amyloid Precursor Protein (APP) family members are key players in S-adenosylmethionine formation by MAT2A and modify BACE1 and PSEN1 gene expression-relevance for Alzheimer’s disease [Research Support, Non-U.S. Gov’t]. Mol Cell Proteomics. 2012;11(11):1274–1288. . PubMed PMID: 22879628; PubMed Central PMCID: PMC3494178. eng
- Manza LL, Stamer SL, Ham AJL, et al. Sample preparation and digestion for proteomic analyses using spin filters. Proteomics. 2005;5(7):1742–1745. . PubMed PMID: WOS:000229321000001; English
- Wisniewski JR, Zougman A, Nagaraj N, et al. Universal sample preparation method for proteome analysis. Nat Methods. 2009;6(5):359–U60. . PubMed PMID: WOS:000265661600016; English
- Olsen JV, de Godoy LMF, Li GQ, et al. Parts per million mass accuracy on an orbitrap mass spectrometer via lock mass injection into a C-trap. Mol Cell Proteomics. 2005;4(12):2010–2021. . PubMed PMID: WOS:000233774200017; English
- Dragovic RA, Gardiner C, Brooks AS, et al. Sizing and phenotyping of cellular vesicles using nanoparticle tracking analysis. Nanomedicine. 2011;7(6):780–788. . PubMed PMID: 21601655; PubMed Central PMCID: PMCPMC3280380. Eng
- Hagmeyer D, Ganesan K, Ruesing J, et al. Self-assembly of calcium phosphate nanoparticles into hollow spheres induced by dissolved amino acids. J Mater Chem. 2011;21(25):9219–9223. . PubMed PMID: ISI:000291611600040; English
- Drommelschmidt K, Serdar M, Bendix I, et al. Mesenchymal stem cell-derived extracellular vesicles ameliorate inflammation-induced preterm brain injury. Brain Behav Immun. 2017;60:220–232. . PubMed PMID: 27847282
- Ophelders DR, Wolfs TG, Jellema RK, et al. Mesenchymal stromal cell-derived extracellular vesicles protect the fetal brain after hypoxia-ischemia. Stem Cells Transl Med. 2016;5(6):754–763. . PubMed PMID: 27160705; PubMed Central PMCID: PMCPMC4878333
- Nag A, Mitra G, Ghosh PC. A colorimetric assay for estimation of polyethylene glycol and polyethylene glycolated protein using ammonium ferrothiocyanate. Anal Biochem. 1996;237(2):224–231. . PubMed PMID: 8660570
- Arroyo JD, Chevillet JR, Kroh EM, et al. Argonaute2 complexes carry a population of circulating microRNAs independent of vesicles in human plasma [Research Support, N.I.H., Extramural Research Support, Non-U.S. Gov’t]. P Natl Acad Sci USA. 2011;108(12):5003–5008. . PubMed PMID: 21383194; PubMed Central PMCID: PMC3064324. eng
- Bruno S, Tapparo M, Collino F, et al. Renal regenerative potential of different extracellular vesicle populations derived from bone marrow mesenchymal stromal cells. Tissue Eng Part A. 2017;23(21–22):1262–1273. . PubMed PMID: 28471327; PubMed Central PMCID: PMCPMC5689130
- Tkach M, Kowal J, Zucchetti AE, et al. Qualitative differences in T-cell activation by dendritic cell-derived extracellular vesicle subtypes. Embo J. 2017;36(20):3012–3028. . PubMed PMID: 28923825; PubMed Central PMCID: PMCPMC5641679
- Andreu Z, Rivas E, Sanguino-Pascual A, et al. Comparative analysis of EV isolation procedures for miRNAs detection in serum samples. J Extracell Vesicles. 2016;5:31655. . PubMed PMID: 27330048; PubMed Central PMCID: PMCPMC4916259
- Rider MA, Hurwitz SN, Meckes DG Jr. ExtraPEG: A polyethylene glycol-based method for enrichment of extracellular vesicles. Sci Rep. 2016;6:23978. . PubMed PMID: 27068479; PubMed Central PMCID: PMCPMC4828635
- Weng Y, Sui Z, Shan Y, et al. Effective isolation of exosomes with polyethylene glycol from cell culture supernatant for in-depth proteome profiling. Analyst. 2016;141(15):4640–4646. . PubMed PMID: 27229443
- Corso G, Mager I, Lee Y, et al. Reproducible and scalable purification of extracellular vesicles using combined bind-elute and size exclusion chromatography. Sci Rep. 2017;7(1):11561. . PubMed PMID: 28912498; PubMed Central PMCID: PMCPMC5599601
- Kowal J, Arras G, Colombo M, et al. Proteomic comparison defines novel markers to characterize heterogeneous populations of extracellular vesicle subtypes. Proc Natl Acad Sci U S A. 2016;113(8):E968–77. . PubMed PMID: 26858453; PubMed Central PMCID: PMCPMC4776515
- Karimi N, Cvjetkovic A, Jang SC, et al. Detailed analysis of the plasma extracellular vesicle proteome after separation from lipoproteins. Cell Mol Life Sci. 2018;75(15):2873–2886. . PubMed PMID: 29441425; PubMed Central PMCID: PMCPMC6021463
- Lai RC, Tan SS, Yeo RW, et al. MSC secretes at least 3 EV types each with a unique permutation of membrane lipid, protein and RNA. J Extracell Vesicles. 2016;5:29828. . PubMed PMID: 26928672; PubMed Central PMCID: PMCPMC4770866
- Heinemann ML, Ilmer M, Silva LP, et al. Benchtop isolation and characterization of functional exosomes by sequential filtration. J Chromatography. 2014;1371:125–135. . PubMed PMID: 25458527
- Vishnubhatla I, Corteling R, Stevanato L, et al. The development of stem cell-derived exosomes as a cell-free regenerative medicine. J Circulating Biomarkers. 2014. doi: 46601.