
ABSTRACT
Extracellular vesicles (EVs) are mRNA-containing cell fragments shed into circulation during pathophysiological events. DNA methyltransferases (DNMT1, DNMT3A, and DNMT3B) regulate gene expression by modifying DNA methylation and altering transcription. Sepsis is a systemic insult resulting in vascular dysfunction, which can lead to shock and death. We analysed plasma from ICU patients for circulating EV numbers, defined as particles isolated from 1 mL plasma at 21,000xg, and DNMTs mRNA content as prognostic markers of septic shock. Compared to plasma from critically ill patients with or without sepsis, plasma from septic shock patients contained more EVs per mL, expressed as total DNMTs mRNAs over 5 days, and more individual DNMT mRNAs at each day. A comparison of EV-DNMT1 (maintenance methylation) with EV-DNMT3A+DNMT3B (de novo methylation) expression correlated highly with severity, and EVs from septic shock patients carried more total DNMT mRNAs and more DNMT3A+DNMT3B mRNAs than control or sepsis EVs. Total plasma EVs also correlated with sepsis severity. EV-DNMT mRNAs load, when coupled with total plasma EV number, may be a novel method to diagnose septic shock upon ICU admittance and offer opportunities to more precisely intervene with standard therapy or other targeted interventions to regulate EV release and/or specific DNMT activity.
Introduction
DNA methylation is a heritable epigenetic marker where DNA methyltransferases (DNMTs) covalently transfer methyl groups to the C-5 position in the cytosine ring [1,2]. DNA methylation occurs enzymatically at gene promoters to serve as a transcriptional OFF switch. In general, this epigenetic modification can establish a unique pattern of transcriptional suppression that can lead to permanent gene silencing [Citation3]. Distinct DNMTs exist to maintain pre-existing methylation patterns [Citation4], as well as initiate alternative methylation signatures during disease development [Citation2]. Currently, there are five known mammalian DNMTs: DNMT1, DNMT3A, DNMT3B [Citation5], DNMT2, and DNMT3L. DNMT1 recognizes hemi-methylated DNA and maintains parent DNA methylation patterns during DNA replication, while DNMT3A and DNMT3B establish de novo DNA methylation. These distinct epigenetic functions between DNMT types are not exclusive and can overlap [Citation1]. DNMT2 is a transfer RNA methyltransferase for cytosine-5 methylation with very low DNA methylation catalytic activity [Citation6]. DNMT3L lacks enzymatic activity but can interact with DNMT3A/3B and other repressor complexes to set up methylation imprints during gametogenesis [Citation7].
Circulating EVs are subcellular plasma membrane-enclosed particles measuring 0.03–2 µm and shed during cellular activation and apoptosis by a complex budding mechanism. EVs can originate from almost all cell types, in vitro and in vivo [Citation8–Citation10]. An increasing number of laboratories have reported that EVs have specific functions and that their contents serve as instructions for the tissue microenvironment which takes up these EVs, or when released into the systemic circulation under certain conditions [Citation11]. EVs contain proteins and nucleic acids, including small regulatory RNA molecules (miRNAs), which are important in the regulation of gene expression [Citation12,Citation13]. These important findings demonstrate that EVs contain and can deliver epigenetic regulators to proximal or distal recipient cells and can influence the behaviour of targeted cells at both molecular and signalling levels. This phenomenon has opened a new era in the field of intercellular communication and resultant phenotype changes observed in pathophysiology, pathology, cell biology, diagnosis, and therapeutics. For example, EVs can transfer receptors, proteins, and cytokines to stimulate and change signalling complexes, directly. At the same time, they can carry regulatory messages (miRNAs and nucleic acids) to alter gene expression and protein production at the molecular level [Citation13].
Sepsis is a primarily vascular process that affects over 750,000 people annually with an in-hospital mortality rate that exceeds 25-30% in the US [Citation14] and has a projected annual cost of $17 billion US dollars [Citation15]. Sepsis is defined by evidence of systemic inflammation accompanied by an infection that can arise from either gram-negative or gram-positive bacteria [Citation16]. The categorization of sepsis and septic shock correlate with severity of illness scores like APACHE (composite of 20 physiological variables) on admission to the intensive care unit (ICU) in the first 24 hours [Citation17], or Sepsis-related Organ Failure Assessment (SOFA) score, which uses organ function and rate of failure scoring to estimate the risk of morbidity and mortality due to sepsis [Citation17,Citation18]. It is reported that patients with septic shock may not be diagnosed on day one since there is no specific diagnostic tool to define sepsis clinically and diagnosis is often defined after clinical deterioration during the hospital stay [Citation19].
Sepsis initiates a complex immunologic response which dysregulates homoeostatic balance between pro- and anti-inflammatory processes resulting in an immunosuppressive phase, primary infection, and secondary hospital-acquired infections that contribute to increased mortality [Citation20]. In sepsis, injury of endothelial and microvascular cellular components including epithelial cells and circulatory immune cells occurs combined with dysfunction and alteration of cell adhesive properties, blood flow, mitochondrial dysfunction, endothelial injury and severe capillary leakage [Citation21]. This injury can contribute to hypoxia and multi-organ dysfunction [Citation22,Citation23] and can result in massive increases in EV production and release into the systemic circulation associated with inflammation [Citation24], coagulopathy, vascular occlusion, infection and immune evasion [Citation25]. In several clinical [Citation26] and in vivo sepsis animal studies [Citation27], EVs act as important pathogenic markers by carrying pro-coagulant surfaces and also as inflammatory vascular mediators [Citation28]. EVs can also serve as biomarkers for late cell events during septic shock by carrying a high amount of specific endothelial and leucocyte markers in disseminated intravascular coagulopathy (DIC), a process which contributes to multiple organ failure [Citation29].
Circulating EV populations and their content can change during sepsis [Citation30]. Functionally, it has been shown that sepsis-induced EVs exhibit pro-coagulant activity and cause endothelial damage [Citation31]. miRNA and mRNA profiles within EVs also change during sepsis as they can transfer their contents to recipient cells and regulate cell function [Citation13,Citation32]. Some studies show that EVs can play a crucial role in vascular haemostasis through transfer of signals to induce endothelial cell inflammatory cytokines and chemokines, as well as endothelial adhesion molecules [Citation33,Citation34]. Most septic patients survive the early inflammatory immune response phase but die from extensive susceptibility during the later immunosuppressive phase due to secondary infection that maintains the failure of organ function recovery [Citation35].
By studying EVs in different stages of sepsis, it was found that certain miRNAs (miR-1290, miR-146a, and miR-1298) are highly packaged into EVs over the first 48 hours of septic shock compared to healthy donors. In the same study, EV miR content was different in the recovery phase of sepsis, suggesting the composition of septic EVs can act as a diagnostic marker for early detection of sepsis and support the underlying mechanism of sepsis pathogenesis [Citation36]. In a recent study in press (Wisler et al, 2019; Surgical Infections), Wisler used proteomic analyses to characterize a role for exosomes in the inflammatory pathway during sepsis. The results revealed a downregulation of several key protein networks including those involved in immune responses. Importantly, proteomics analysis showed a significant reduction in TNF-α, suggesting that septic exosomes may contribute significantly to systemic signalling and immunomodulation during the disease. Pathway analysis performed on exosomes from sepsis patients showed that acute phase response signalling and coagulation systems were significantly repressed compared to exosomes from plasma of clinically ill non-septic patients. As a follow up to these findings, we investigated the promoters of inflammatory genes for epigenetic molecule binding motifs and found that promoters of many inflammatory genes (both pro- and anti-inflammatory) contain CpG islands (Supplemental Table I). As a result, we hypothesized a role for the potential involvement of DNMTs in the regulation of inflammatory gene expression. Furthermore, since DNMT proteins were not detectable in the patient exosomes in the Wisler study, and because mRNAs and miRs are known to be transported from EVs into target cells, we tested EVs from sepsis and critically ill non-septic patients for the presence of DNMT mRNAs.
To date, no definitive clinical diagnosis or decision-making analysis of sepsis or sepsis severity based on molecular targets is available. In this study, we propose a novel method of molecular characterization for septic shock determination upon admittance to the ICU by assessment of the amount of circulating de novo methylation DNMT mRNAs within plasma EVs. When coupled with the total numbers of circulating EVs, this novel method may provide a diagnostic tool for septic shock. Further, our findings suggest that this method may have additional prognostic value and help identify novel targets for treating septic shock, including therapies that limit EVs release or small molecule inhibitors of de novo DNMT expression or function.
Results
Patient information
33 patients (10 critically ill, non-septic controls and 23 sepsis and septic shock patients) from the surgical ICU were enrolled in the study and their clinical information is included in . From these patients, 27 consented (10 from control, 10 from sepsis, and 7 from septic shock) to further analyse their blood for research. All demographic information was recorded at time of diagnosis. To be eligible for this study, the patient must have been diagnosed with sepsis within 24 hours. Critically ill, non-septic patients were used as the control cohort in this study to control for the severity of illness. With differential centrifugations, we were able to collect EVs from the patients’ plasma that are platelet-depleted (data not shown) and stained positive for the typical EV markers CD63, CD81, ANXA5, FLOT1, ICAM, AUX, EPCAM, and TSG101 and stained negative for the contaminant GM130 (Supplemental Figure 1). Despite the fact that healthy volunteers presented 100 to 1,000-fold less EVs in their plasma, we were unable to detect EV-DNMT mRNAs in healthy donors compared to the same amount of total RNA (1 μg) collected from plasma EVs of critically ill non-septic, septic, and septic shock patients (). In contrast, critically ill, non-septic patients more closely resembled sepsis patients in these categories and provides a higher stringency for statistical comparison. In the (n = 9), followed by necrotizing soft tissue infections (n = 8), cholangitis (n = 3), pneumonia (n = 1), and unknown (sepsis and septic shock cohorts, the most common cause of sepsis was intra-abdominal infectionsn = 2).
Table 1. Patient information.
Table 2. Comparison of circulating vesicles and EV-DNMT mRNAs expression.
Septic shock patients had increased total plasma EV-DNMT mRNAs and increased individual EV-DNMT mRNAs compared to control or septic patients
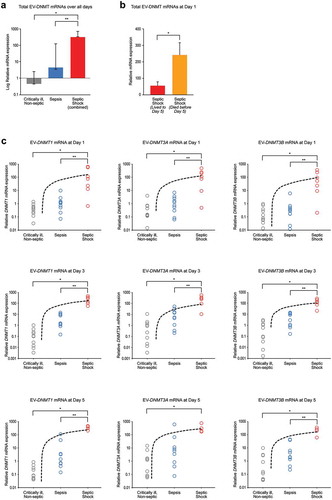
We and others have demonstrated that EVs contain mRNAs and microRNAs, circulate in the blood of healthy individuals and patients with disease, and are taken-up by target cells to influence gene expression [Citation13,Citation37,Citation38]. Based on these observations, we asked if EVs can change their cargo in acute, life-threatening sepsis and sought to define some of these key changes. We focused on the DNMTs, as they are conserved epigenetic regulators of gene expression, and hypothesized that the balance between DNA repair DNMTs (DNMT1) and de novo DNMTs (DNMT3A and DNMT3B) may change during this life-threatening state as a kind of molecular “circuit breaker” of gene expression. Within this framework, we hypothesized that sepsis and septic shock patients have increased circulating EV-DNMT mRNAs compared to those with critical illness without sepsis, and that EV-DNMT mRNAs level would increase with sepsis severity. We collected plasma EVs from consenting critically ill, non-septic patients and patients diagnosed with sepsis or septic shock in the ICU at days 1, 3 and 5 (for those that survived to day 5). We evaluated levels of DNA methyltransferases in EVs (EV-DNMTs) in these groups using specific validated primers for human DNMT mRNAs (DNMT1, DNMT3A, DNMT3B) over all days analysed (days 1, 3, and 5) to understand the potential impact of increased EV-DNMT mRNA on outcome. Our data demonstrate a significant difference between severity groups when comparing total EV-DNMT mRNAs (DNMT1+DNMT3A+DNMT3B) at each severity of illness (P < 0.00001) ()) and that septic shock patients had significantly higher levels of total DNMT mRNAs than critically ill, non-septic patients (controls) (*P < 0.01) and sepsis patients (**P < 0.01). Interestingly, when we separated the septic shock cohort into those who lived to day 5 and those who died before day 5, we found that patients who died by day 5 had significantly more EV-DNMT mRNAs on day 1 than septic shock patients who lived to day 5 ()). To our surprise, we found that within severity groups there were no significant changes in total EV-DNMT mRNAs over all days (), no significant changes in individual EV-DNMT mRNAs over all days combined (), and no significant changes in individual DNMT mRNAs between any individual day analysed (), suggesting no change in circulating EV-DNMT mRNAs over time once admitted to the ICU, regardless of clinical diagnosis of severity. In contrast, when comparing between severity groups for individual EV-DNMT mRNAs, we found that, at each day analysed, there was a significant increase in each individual EV-DNMT as severity increased ()). These data suggest a different role for EV-DNMTs in septic shock than in critically ill, non-septic patients, or sepsis patients.
Table 3. Differences for all days combined for total (combined) EV-DNMT mRNAs within patient severity.
Table 4. Differences over all days analysed for individual EV-DNMT mRNAs within patient severity.
Table 5. Differences between each day analysed for individual EV-DNMT mRNAs within patient severity.
Figure 1. Septic shock patients have increased total EV-DNMT mRNAs compared to control or septic patients. (a) Total EV-DNMT mRNAs collected from EVs over all days. Whole blood was collected from critically ill, non-septic patients or patients with sepsis or septic shock on the first day in the ICU (Day 1). Fresh plasma EVs were isolated, 1 µg total RNA of each sample was purified, cDNA synthesized and subjected to qPCR analysis using primers specific for human DNMT1, DNMT3A, DNMT3B, or CAP1, and RPL4 (internal controls) mRNAs. Total combined mRNA expression for EV-DNMT1, EV-DNMT3A, and EV-DNMT3B over 1, 3, or 5 days was analysed using the comparative threshold method and normalized against the internal control transcripts. Data are represented as geometric means and geometric standard deviation from N = 29 critically ill, non-septic (grey); N = 28 sepsis (blue); and N = 17 septic shock (combined those who lived to day 5 and those who died before day 5) (red). Overall, F-ratio = 53.83 and P < 0.00001 (two-way ANOVA) and *P < 0.01 vs control and **P < 0.01 vs sepsis (Tukey’s post hoc test). (b) Total EV-DNMT mRNAs collected from EVs at Day 1. Data (mean±SEM) from N = 12 septic shock patients who lived to day 5 (red) and N = 9 septic shock patients who died before day 5 (orange). *P = 0.0151 (Two-tailed T-test). (c) Individual EV-DNMT1, EV-DNMT3A, and EV-DNMT3B mRNA expression for each severity group (critically ill, non-septic; sepsis; septic shock) over each day (1, 3, and 5). EV-DNMT1 mRNA at day 1 (left column, top row). Data (mean±SEM) from N = 10 critically ill, non-septic; N = 10 sepsis; and N = 7 septic shock patients. ANOVA: F-ratio = 5.80 and P = 0.0088; and *P < 0.05 vs control and **P < 0.05 vs sepsis (Tukey’s post hoc test). EV-DNMT1 mRNA at day 3 (left column, middle row). N = 10 critically ill, non-septic; N = 9 sepsis; and N = 6 septic shock patients. ANOVA: F-ratio = 22.00 and two-tailed P < 0.00001; and *P < 0.01 vs control and **P < 0.01 vs sepsis (Tukey’s post hoc test). DNMT1 mRNA at day 5 (left column, bottom row). N = 9 critically ill, non-septic; N = 9 sepsis; and N = 4 septic shock patients. ANOVA: F-ratio = 86.56 and P < 0.00001; and *P < 0.01 vs control and **P < 0.01 vs sepsis (Tukey’s post hoc test). EV-DNMT3A mRNA at day 1 (middle column, top row). N = 10 critically ill, non-septic; N = 10 sepsis; and N = 7 septic shock patients. ANOVA: F-ratio = 9.88 and P = 0.0007; and *P < 0.01 vs control and **P < 0.01 vs sepsis (Tukey’s post hoc test). EV-DNMT3A mRNA at day 3 (middle column, middle row). N = 10 critically ill, non-septic; N = 9 sepsis; and N = 6 septic shock patients. ANOVA: F-ratio = 14.41 and two-tailed P < 0.0001; *P < 0.01 vs control and **P < 0.01 vs sepsis (Tukey’s post hoc test). EV-DNMT3A mRNA at day 5 (middle column, bottom row). N = 9 critically ill, non-septic; N = 9 sepsis; and N = 4 septic shock patients. ANOVA: F-ratio = 5.01 and P < 0.0179; and *P < 0.05 vs control (Tukey’s post hoc test). EV-DNMT3B mRNA at day 1 (right column, top row). N = 10 critically ill, non-septic; N = 10 sepsis; and N = 7 septic shock patients. ANOVA: F-ratio = 7.16 and P = 0.0036; *P < 0.01 vs control and **P < 0.01 vs sepsis (Tukey’s post hoc test). EV-DNMT3B mRNA at day 3 (right column, middle row). N = 10 critically ill, non-septic; N = 9 sepsis; and N = 6 septic shock patients. ANOVA: F-ratio = 19.24 and two-tailed P < 0.00002; *P < 0.01 vs control and **P < 0.01 vs sepsis (Tukey’s post hoc test). EV-DNMT3B mRNA at day 5 (right column, bottom row). N = 9 critically ill, non-septic; N = 9 sepsis; and N = 4 septic shock patients. ANOVA: F-ratio = 25.16 and P < 0.00001; *P < 0.01 vs control and **P < 0.01 vs sepsis (Tukey’s post hoc test).
Septic shock EV-DNMT expression shows distinct clusters of sepsis and control patients
As previously mentioned, de novo methyltransferases establish new DNA methylation patterns from unmethylated DNA, while DNMT1 is located at the replication fork and acts as the maintenance methylase that preserves methylation patterns through cell division [Citation5,Citation39] . Each type of DNMT isoform plays a distinct role in development, specific cellular function, cell division, and disease pathology. The ratio between DNMT1 and DNMT3A & 3B may reflect stability of cellular homoeostasis, disease status, and severity. Therefore, we hypothesized that mRNA expression of EV-DNMTs specific for maintenance methylation (EV-DNMT1) vs de novo methylation (EV-DNMT3A + EV-DNMT3B) is important in predicting sepsis severity. Interestingly, even though expression of combined EV-DNMT3A + EV-DNMT3B mRNAs did not correlate with severity over all days combined (), the relationship between EV-DNMT1 vs combined EV-DNMT3A + EV-DNMT3B mRNAs did highly correlate with severity when analysing over all days combined (r = 0.86464 and P < 0.00001) ()). The critically ill, non-septic control and sepsis patients have significantly different EV-DNMT1 vs EV-DNMT3A + EV-DNMT3B mRNAs expression profiles compared to septic shock patients (P < 0.0001). This is represented by the two clusters formed by the control (grey) and sepsis (blue) patients and the septic shock patients (red and orange). Interestingly, within the septic shock groups, there was no distinguishable difference in EV-DNMT1 vs EV-DNMT3A + EV-DNMT3B mRNAs between those who lived to day 5 (red) and those who died by day 5 (orange).
Table 6. Correlation of EV-DNMT3A + EV-DNMT3B mRNAs to patient severity over all days combined.
Figure 2. Septic shock EV-DNMT levels cluster distinct of control and sepsis patients. (a) Correlation of EV-DNMT1 mRNA vs EV-DNMT3A + EV-DNMT3B mRNAs for each severity group over all days. EVs were isolated and RNA was isolated as described earlier. Data were reported as log relative expression of EV-DNMT1 mRNA as a function of log relative EV-DNMT3A + EV-DNMT3B mRNAs for each severity group (critically ill, non-septic (grey dots); sepsis (blue dots); septic shock patients who lived to 5 days (red dots); and septic shock patients who died before day 5 (orange dots). N = 29 for critically ill, non-septic; N = 28 for sepsis; N = 17 for septic shock who lived to day 5; N = 5 for septic shock who died by day 5. Spearman’s rho, ρ = 0.86464, and two-tailed P < 0.00001. Hotelling’s T2 = 103.5407, df = [Citation2, 71], P < 0.0001 for critically ill, non-septic and sepsis vs septic shock (combined) for clustering. (b) Correlation of EV-DNMT1 mRNA vs EV-DNMT3A + EV-DNMT3B mRNAs for each severity at day 1 (top). N = 10 for critically ill, non-septic; N = 10 for sepsis; N = 4 for septic shock who lived to day 5; N = 3 for septic shock who died by day 5. Spearman’s rho, ρ = 0.79786, and two-tailed P < 0.00001. (Hotelling’s T2 = 29.8335, df = (2, 7.6165), P < 0.0001) for critically ill, non-septic and sepsis vs septic shock (combined) for clustering. Correlation of EV-DNMT1 mRNA vs EV-DNMT3A + EV-DNMT3B mRNAs for each severity at day 3 (middle). N = 10 for critically ill, non-septic; N = 9 for sepsis; N = 4 for septic shock who lived to day 5; N = 2 for septic shock who died by day 5. Spearman’s rho, ρ = 0.93615, and two-tailed P < 0.00001. (Hotelling’s T2 = 84.7831, df = (2, 20.9335), P < 0.0001) for critically ill, non-septic and sepsis vs septic shock (combined) for clustering. Correlation of EV-DNMT1 mRNA vs EV-DNMT3A + EV-DNMT3B mRNAs for each severity at day 5 (bottom). N = 9 for critically ill, non-septic; N = 9 for sepsis; N = 4 for septic shock who lived to day 5. Spearman’s rho, ρ = 0.81028, and two-tailed P < 0.00001. (Hotelling’s T2 = 131.6986, df = (2, 19.6058), P < 0.0001)) for critically ill, non-septic and sepsis vs septic shock (combined) for clustering. (c) Correlation of EV-DNMT1 mRNA vs EV-DNMT3A + EV-DNMT3B mRNAs for each day 1 (white dot), day 3 (grey dot), and day 5 (black dot) for critically ill, non-septic patients (top). N = 10 for day 1; N = 10 for day 3; N = 9 for day 5. Spearman’s rho, ρ = 0.75153, and two-tailed P < 0.00001. Correlation of EV-DNMT1 mRNA vs EV-DNMT3A + EV-DNMT3B mRNAs for each day 1 (white dot), day 3 (grey dot), and day 5 (black dot) for sepsis patients (middle). N = 10 for day 1; N = 9 for day 3; N = 9 for day 5. Spearman’s rho, ρ = 0.71795, and two-tailed P = 0.00002. Correlation of EV-DNMT1 mRNA vs EV-DNMT3A + EV-DNMT3B mRNAs for each day 1 (white dot), day 3 (grey dot), and day 5 (black dot) for septic shock patients who lived to day 5 (bottom). N = 7 for day 1; N = 6 for day 3; N = 4 for day 5. Spearman’s rho, ρ = 0.55147, and two-tailed P = 0.02175.
![Figure 2. Septic shock EV-DNMT levels cluster distinct of control and sepsis patients. (a) Correlation of EV-DNMT1 mRNA vs EV-DNMT3A + EV-DNMT3B mRNAs for each severity group over all days. EVs were isolated and RNA was isolated as described earlier. Data were reported as log relative expression of EV-DNMT1 mRNA as a function of log relative EV-DNMT3A + EV-DNMT3B mRNAs for each severity group (critically ill, non-septic (grey dots); sepsis (blue dots); septic shock patients who lived to 5 days (red dots); and septic shock patients who died before day 5 (orange dots). N = 29 for critically ill, non-septic; N = 28 for sepsis; N = 17 for septic shock who lived to day 5; N = 5 for septic shock who died by day 5. Spearman’s rho, ρ = 0.86464, and two-tailed P < 0.00001. Hotelling’s T2 = 103.5407, df = [Citation2, 71], P < 0.0001 for critically ill, non-septic and sepsis vs septic shock (combined) for clustering. (b) Correlation of EV-DNMT1 mRNA vs EV-DNMT3A + EV-DNMT3B mRNAs for each severity at day 1 (top). N = 10 for critically ill, non-septic; N = 10 for sepsis; N = 4 for septic shock who lived to day 5; N = 3 for septic shock who died by day 5. Spearman’s rho, ρ = 0.79786, and two-tailed P < 0.00001. (Hotelling’s T2 = 29.8335, df = (2, 7.6165), P < 0.0001) for critically ill, non-septic and sepsis vs septic shock (combined) for clustering. Correlation of EV-DNMT1 mRNA vs EV-DNMT3A + EV-DNMT3B mRNAs for each severity at day 3 (middle). N = 10 for critically ill, non-septic; N = 9 for sepsis; N = 4 for septic shock who lived to day 5; N = 2 for septic shock who died by day 5. Spearman’s rho, ρ = 0.93615, and two-tailed P < 0.00001. (Hotelling’s T2 = 84.7831, df = (2, 20.9335), P < 0.0001) for critically ill, non-septic and sepsis vs septic shock (combined) for clustering. Correlation of EV-DNMT1 mRNA vs EV-DNMT3A + EV-DNMT3B mRNAs for each severity at day 5 (bottom). N = 9 for critically ill, non-septic; N = 9 for sepsis; N = 4 for septic shock who lived to day 5. Spearman’s rho, ρ = 0.81028, and two-tailed P < 0.00001. (Hotelling’s T2 = 131.6986, df = (2, 19.6058), P < 0.0001)) for critically ill, non-septic and sepsis vs septic shock (combined) for clustering. (c) Correlation of EV-DNMT1 mRNA vs EV-DNMT3A + EV-DNMT3B mRNAs for each day 1 (white dot), day 3 (grey dot), and day 5 (black dot) for critically ill, non-septic patients (top). N = 10 for day 1; N = 10 for day 3; N = 9 for day 5. Spearman’s rho, ρ = 0.75153, and two-tailed P < 0.00001. Correlation of EV-DNMT1 mRNA vs EV-DNMT3A + EV-DNMT3B mRNAs for each day 1 (white dot), day 3 (grey dot), and day 5 (black dot) for sepsis patients (middle). N = 10 for day 1; N = 9 for day 3; N = 9 for day 5. Spearman’s rho, ρ = 0.71795, and two-tailed P = 0.00002. Correlation of EV-DNMT1 mRNA vs EV-DNMT3A + EV-DNMT3B mRNAs for each day 1 (white dot), day 3 (grey dot), and day 5 (black dot) for septic shock patients who lived to day 5 (bottom). N = 7 for day 1; N = 6 for day 3; N = 4 for day 5. Spearman’s rho, ρ = 0.55147, and two-tailed P = 0.02175.](/cms/asset/9a6262cb-bd6a-41f0-ad01-985d127f39e1/zjev_a_1669881_f0002_oc.jpg)
When analysing each individual day, we observed a similar cluster pattern separating control and sepsis patients from septic shock patients, and a correlation with severity at each days 1, 3, and 5 ()). When analysing EV-DNMT expression based on their functions for the three groups (DNMT1 – maintenance methylation; DNMT3A and DNMT3B – de novo methylation), our data demonstrate a high correlation over all days ()). Taken together, these data suggest an important relationship between the expression of EV-DNMTs based on their functional role and that this relationship may be useful to predict septic shock as early as day 1 (admittance to the ICU).
Septic shock patients have increased numbers of circulating plasma EVs
Increased numbers of circulating plasma EVs have been reported in various diseases, including systemic sclerosis [Citation40], cardiovascular disease [Citation21], thrombocythemia [Citation22], type 2 diabetes mellitus [Citation23], congenital heart disease [Citation24], preeclampsia [Citation25], COPD [Citation41], and sepsis-induced microvascular dysfunction, immunosuppression, and acute kidney injury [Citation35]. We next asked if we could detect differences in plasma EV concentrations between the critically ill, non-septic control, sepsis, and septic shock patients. We subjected a small subset of each cohort to NanoSight (light scatter) analysis for determination of total EVs mL−1 plasma and their respective size spectra ranging from ~30 to 400 µm based on our isolation centrifugation protocol ()). We found a ~ 1,000-fold increase in EVs mL−1 between plasma from heathy volunteers (purple) and critically ill, non-septic patients (grey). Interestingly, when analysing each combined cohort spectra and comparing differences in the spectrum mode of the average of three to five individual runs per sample (highest population of EV size (nm)), we found no difference between either healthy donors and any or all ICU cohorts, or between the critically ill, non-septic control cohort and all other septic cohorts either from day to day or over all days ()).
Figure 3. Septic shock patients have increased circulating plasma EVs. (a) Analysis for concentration and size distribution of plasma EVs. Plasma EVs from critically ill non-septic, sepsis and septic shock patients were isolated and collected as described in Methods. EVs were subjected to NanoSight (light scatter) analysis for determination of total EVs mL−1 plasma and their respective diameter sizes ranging from ~30 to 400 µm. A NanoSight spectrum was collected for each patient in the cohort. Those individual spectra were placed at the correct scale on the same axes. At each nm, the highest and lowest EV population was included by shading in that area in which was populated between the samples so that each spectrum represents the actual variation of all donors in that cohort. Dotted line and box indicate magnification of the healthy donor EV spectrum (purple) by 1,000-fold compared to the EV spectrum from critically ill, non-septic patients (grey) (first column). Spectra represent N = 4 for healthy donors and N = 3 for critically ill, non-septic at day 1. Comparison of critically ill, non-septic (grey) and sepsis (blue) EV spectrums at each day 1, 3, and 5 (second column). Spectra represent N = 3 at each day for critically ill, non-septic and N = 4 at each day for sepsis. Comparison of sepsis (blue) and septic shock (patients who lived and died by day 5, combined) (red) EV spectrums at each day 1, 3, and 5 (third column). Spectra represent N = 4 for sepsis at each day and N = 7 for septic shock (combined lived to day 5 and died by day 5) at days 1 and 3 and N = 4 for day 5. Comparison of septic shock patients who lived to day 5 (red) and septic shock patients who died before day 5 (orange) EV spectrums at each day 1 and 3 (right column). Spectra represent N = 4 for septic shock who lived to day 5 and N = 3 for septic shock who died by day 5. (b) EVs mL−1 plasma over all days combined by severity. Septic shock patients (both those who lived to day 5 and those who died before day 5, combined (red) had more EVs mL−1 than critically ill, non-septic (grey) or sepsis (blue) patients. ANOVA: F-ratio = 7.12 and two-tailed P < 0.0025; and *P < 0.05 and **P < 0.01 (Tukey’s post hoc). N = 9 for critically ill, non-septic; N = 12 for sepsis, N = 18 for septic shock (N = 4 at each day 1, 3, and 5 for patients who lived to day 5 and N = 3 at each day 1 and 3 for patients who died before day 5). (c) Extracellular vesicles mL−1 plasma at each day (1, 3, and 5). The healthy donor cohort (purple) had significantly less EVs/mL than all other samples (*P < 0.001). At day 1, the septic shock patients who died before day 5 (orange) had significantly more EVs/mL than the critically ill, non-septic (grey), sepsis (blue), and septic shock patients who lived to day 5 (red). ANOVA: F-ratio = 8.02 and two-tailed P < 0.0051; and **P < 0.05 vs critically ill non-septic (CINS) and septic shock patients who lived to day 5, and #P < 0.01 vs sepsis (Tukey’s post hoc). At Day 3, the septic shock patients who died before day 5 (orange) had significantly more EVs/mL than the critically ill, non-septic (grey), sepsis (blue), and septic shock patients who lived to day 5 (red). ANOVA: F-ratio = 9.06 and two-tailed P < 0.0034; and P < 0.01 vs all other samples (Tukey’s post hoc). At Day 5, the septic shock patients who lived to day 5 (red) had significantly more EVs/mL than the critically ill, non-septic (grey) and sepsis (blue). ANOVA: F-ratio = 8.01 and two-tailed P < 0.0123; and $P < 0.05 vs all other samples (Tukey’s post hoc). N = 4 for Healthy donors, N = 9 for critically ill, non-septic; N = 12 for sepsis, N = 18 for septic shock (N = 4 at each day 1, 3, and 5 for patients who lived to day 5 and N = 3 at each day 1 and 3 for patients who died before day 5).
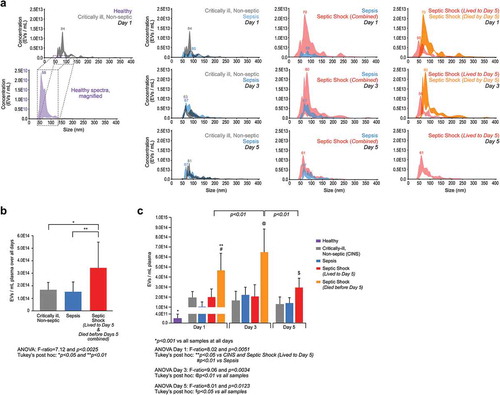
To determine if the number of EVs released into the plasma was different between severities, we quantified total EVs mL−1 released over all days and found a significant increase by severity (P < 0.0025). Specifically, septic shock patients had significantly more EVs mL−1 plasma than either the control cohort (*P < 0.05) or sepsis cohort (**P < 0.01), while we found no difference between the control and sepsis groups ()). Comparing EV release over individual days between the different severities ()), we observed a significant increase in EVs per mL plasma for the septic shock patients who died before day 5 compared to all other cohorts at day 1 (*P < 0.05 vs control and *P < 0.05 vs septic shock patients who lived to day 5). We observed similar results at day 3 as septic shock patients who died before day 5 have significantly more EVs compared to all other cohorts (P < 0.01 vs other cohorts). At day 5, the septic shock patients who lived to day 5 also released significantly more EVs per mL than the control and sepsis cohorts ($P < 0.05 vs both cohorts). Further, EVs per mL plasma in the septic shock patients who died before day 5 were significantly higher on day 1 than for septic shock patients who lived to day 5 (P < 0.01) and higher on day 5 for septic shock patients who lived to day 5 (P < 0.01), suggesting the major contribution of EVs in the septic shock (combined) cohort are from those patients who died before day 5. No differences were observed at any day between control and sepsis patients and trend analysis showed no difference in EV release within each severity over all days (). These data suggest that the critically ill, non-septic and sepsis cohorts contain similar numbers of plasma EVs per mL while the septic shock cohort contained significantly more EVs, particularly in those patients who died by day 5.
Table 7. Differences in extracellular vesicle release over days.
Since NanoSight analysis of plasma EVs is based on light scatter, we confirmed that the plasma EVs that we detected were biologically-relevant, membrane vesicles and not protein aggregates. We batched control cohort samples to obtain 60 µg total protein and subjected the lysate to a standard exosome array for the presence of typical EV markers (CD63, CD81, ANXA5, FLOT1, ICAM, AUX, EPCAM, and TSG101) and the absence of the contaminant GM130 to confirm EVs (Supplemental Figure 1).
Septic shock patient EVs carry more EV-DNMT mRNAs
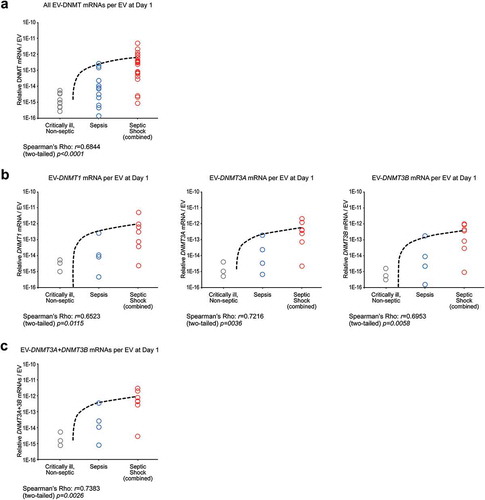
We observed that patients with septic shock had increased numbers of EVs and increased EV-DNMT mRNAs than control or sepsis cohorts. To understand if the greater amount of EV-DNMT mRNAs from the septic shock cohort was a result of increased numbers of EVs carrying these DNMT mRNAs or if there was a difference between each cohort in how much EV-DNMT mRNA was carried per EV, we calculated the amount of total EV-DNMT mRNAs of each severity group per its number of EVs as determined by NanoSight. We found a significant correlation for combined and individual DNMT mRNAs per EV vs patient severity at day 1 ()), and a significant correlation for each individual EV-DNMT mRNA per EV vs patient severity at day 1 ()). Further, we found that de novo DNMTs mRNAs (EV-DNMT3A + EV-DNMT3B) within each EV at day 1 correlated significantly with sepsis severity ()).
Figure 4. DNMT mRNAs per individual EVs correlates with patient severity. (a) All EV-DNMT mRNAs per EV at Day 1. Those patient samples who had their DNMT mRNAs analysed by qPCR and subjected to NanoSight for plasma EVs concentration were used to determine DNMT mRNAs per EV. There is a significant correlation for all DNMT mRNAs per EV at Day 1 vs patient severity. (Spearman’s rho: ρ = 0.6844 and two-tailed P = 0.0001. N = 9 for critically ill (grey), non-septic; N = 12 for sepsis (blue); N = 21 for septic shock (combined lived to day 5 and died before day 5) (red)). (b) (Left) EV-DNMT1 mRNA per EV at Day 1. There is a significant correlation for EV-DNMT1 mRNAs per EV at Day 1 vs patient severity. (Spearman’s rho: ρ = 0.6523 and two-tailed P = 0.0115. N = 3 for critically ill (grey), non-septic; N = 4 for sepsis (blue); N = 7 for septic shock (combined lived to day 5 and died before day 5) (red)). (Middle) EV-DNMT3A mRNA per EV at Day 1. There is a significant correlation for EV-DNMT3A mRNAs per EV at Day 1 vs patient severity. (Spearman’s rho: ρ = 0.7216 and two-tailed P = 0.0036. N = 3 for critically ill (grey), non-septic; N = 4 for sepsis (blue); N = 7 for septic shock (combined lived to day 5 and died before day 5) (red)). (Right) EV-DNMT3B mRNA per EV at Day 1. There is a significant correlation for EV-DNMT3B mRNAs per EV at Day 1 vs patient severity. (Spearman’s rho: ρ = 0.6953 and two-tailed P = 0.0058. N = 3 for critically ill (grey), non-septic; N = 4 for sepsis (blue); N = 7 for septic shock (combined lived to day 5 and died before day 5) (red)). (c) EV-DNMT3A + EV-DNMT3B mRNA per EV at Day 1. There is a significant correlation for EV-DNMT3A + EV-DNMT3B mRNA (role in de novo methylation) per EV at Day 1 vs patient severity. (Spearman’s rho: ρ = 0.7383 and two-tailed P = 0.0026. N = 3 for critically ill (grey), non-septic; N = 4 for sepsis (blue); N = 7 for septic shock (combined lived to day 5 and died before day 5) (red)).
Plasma EVs de novo DNMT mRNAs have prognostic value for septic shock
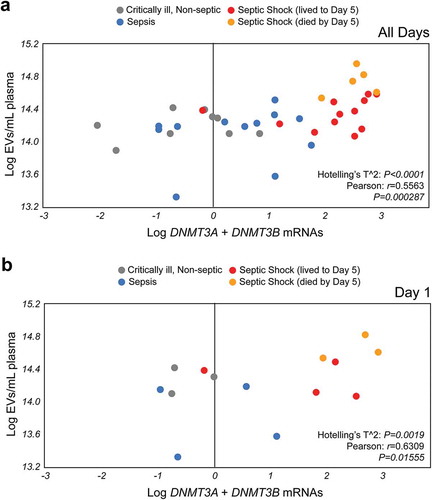
Because we observed an increased number of plasma EVs and increased amount of the de novo methylation regulators EV-DNMT3A and EV-DNMT3B mRNAs in the septic shock cohort compared to critically ill, non-septic control and sepsis cohorts, we hypothesized that these parameters, when analysed together, may have potential as a molecular prognostic marker for septic shock. When we plotted individual patient samples from all three cohorts over all days and analysed for plasma EVs mL−1 as a function of the combination of de novo EV-DNMT mRNAs (EV-DNMT3A + EV-DNMT3B), we found that not only do plasma EVs numbers significantly correlate with de novo EV-DNMT mRNAs in circulation (r = 0.5565 and P = 0.000287), but that again two clusters form, i.e. the control (grey) and sepsis (blue) patients and the septic shock patients (red = septic shock patients who lived to day 5, orange = septic shock patients who died by day 5) (P = 0.0001) ()). To determine if these parameters can be used upon admittance in the ICU (on day one) to predict septic shock distinct of sepsis or critically ill patients without sepsis, we plotted individual patient samples from all three cohorts at day one and found that plasma EVs mL−1 significantly correlate with de novo EV-DNMT mRNAs in circulation (r = 0.6309 and P = 0.01555) and that septic shock patients cluster distinct from critically ill, non-septic and sepsis patients (P = 0.0019) ()). These results suggest that combined analysis of plasma EVs and expression of EV-DNMT3A and EV-DNMT3B mRNAs may be a potential molecular prognostic marker to distinguish septic shock from sepsis or critically ill patients who do not have sepsis upon admittance to the ICU.
Figure 5. Plasma EVs numbers and de novo EV-DNMT mRNAs expression have prognostic value for septic shock. (a) Septic shock EVs cluster separately from critically ill, non-septic and sepsis patient EVs based on de novo DNA methyltransferase expression over all days analysed. EVs mL−1 plasma as a function of the combination EV-DNMT3A + EV-DNMT3B mRNAs expression (EV-DNMT3A + EV-DNMT3B) (Pearson r = 0.5565, P = 0.000287 and Hotelling’s T2 = 62.5726, df = (2, 35.9031), P < 0.0001). N = 9 for critically ill, non-septic (grey); N = 12 for sepsis (blue); N = 17 for septic shock. The septic shock cohort (red = septic shock patients who lived to day 5, orange = septic shock patients who died before day 5). (b) Patient EV numbers mL−1 and EV-DNMT3A + EV-DNMT3B mRNA content predicts septic shock at Day 1. Plasma EVs mL−1 significantly correlate with de novo EV-DNMT mRNAs in circulation (Pearson r = 0.6795, P = 0.010627 and Hotelling’s T2 = 24.9017, df = (2, 11.6576), P = 0.0019 at day 1. N = 3 for critically ill, non-septic (grey); N = 4 for sepsis (blue); N = 7 for septic shock (combined). The septic shock cohort (red = septic shock patients who lived to day 5, orange = septic shock patients who died by day 5).
Discussion
A chronic progressive pro-inflammatory status is a pervasive feature of ageing. Sepsis is a disease of the elderly where its incidence increases exponentially with age. Since 2001, sepsis has been the tenth leading cause of death in patients over the age of 65 in the US [Citation38]. Sepsis survivors are at substantial risk for a poor quality of life, functional disability, and cognitive impairment [Citation38]. Since septic shock patients have a shorter lifespan in the ICU compared to their sepsis counterparts, we evaluated the correlation between the sepsis patient groups to predict whether sepsis severity was correlated with diminished lifespan in sepsis and septic shock patients [Citation42,Citation43].
We found that sepsis and septic shock EVs carry DNA methyltransferases (DNMTs). Sepsis is a syndrome characterized by an exaggerated systemic inflammatory response to severe infection, and this response causes an acute activation of the vascular wall resulting in deleterious effects of circulating EVs on vascular function that trigger thrombin [Citation25]. EVs can convey the characteristics of their parent cell by transporting their distinctive consignments of receptors, organelles, proteins, lipids, nucleic acids, miRNA and cytokines to recipient cells and influence their function and phenotype [Citation44]. Our confirmation of isolated EVs in this study using a standard exosome array for expression of EV markers revealed that EPCAM was most strongly expressed compared to other markers analysed (Supplemental Figure 1) suggesting epithelial cells are a major source of this EV population. Sepsis can induce epithelial injury resulting in organ dysfunction, and a number of studies have reported various biomarkers that can assess levels of organ dysfunction due to sepsis without a clear connection to the basic mechanism of epithelial injury [Citation45,Citation46]. For example, it was shown that LPS-treated dendritic cells released EVs to stimulate epithelial cells to produce excessive amounts of chemokines as an innate immune response [Citation47]. Another study reported that EVs derived from activated mononuclear phagocytes were able to elicit a lung epithelial cell response that contributed to the pathogenesis of inflammatory diseases of the lung [Citation48]. Further, EVs from septic plasma have been shown to stimulate epithelial cells to further shed highly coagulant EVs that contain elevated levels of functional tissue factors contributing to fibrin deposition [Citation49]. These findings support a significant role for epithelial cell-derived EVs and induced inflammation and organ injury in sepsis.
Multiple studies have demonstrated that EVs are elevated in sepsis, but the underlying mechanisms are unclear. It has been demonstrated that EVs secreted during pathogenic infections differ in their biogenesis, content, and function. These EVs lack the pathogen surface markers to prevent recognition by the immune system; this process facilitates spread and uptake in the host [Citation50–Citation52]. Our proteomic analysis of sepsis-derived EVs and lipopolysaccharide (LPS)-stimulated macrophage-derived exosomes demonstrated repression of several crucial protein networks including immune response proteins. Furthermore, we found that treating human naïve monocytes with exosomes from the plasma of septic patients or from LPS-stimulated monocytes, reduced TNF-α expression compared to EVs from control patients or untreated cells (Wisler et al, 2019; Surgical Infections, in press). These data demonstrate that sepsis-derived EVs may play an important role in downregulating the sepsis-associated immune response by transporting immunoregulatory molecules, i.e. TNF-α, or epigenetic molecules, i.e. DNMTs, that shift the septic immune response either towards or away from homoeostasis.
To the best of our knowledge, we are the first to describe differences in circulating EVs carrying DNMT mRNAs in sepsis. We hypothesized that the DNMT ratio may predict sepsis severity. To determine a pathological correlation of circulating well-known de novo methylators relative to maintenance methylators in patients with sepsis, we studied mRNA expression of DNMT3A and DNMT3B in relation to DNMT1 in plasma EVs. The small sample size of this cohort study does not provide data demonstrating downstream cellular uptake of the EVs or differences in direct DNA methylation a result of increased DNMT mRNA presence. However, we and others have demonstrated that various cell types do take-up EVs resulting in cargo delivery of epigenetic modifiers like miRNAs to alter target genes expression in those recipient cells [Citation13,Citation37]. Our data suggest that critically ill patients (with or without sepsis) contain ~1,000x more EVs than healthy individuals and that these EVs carry elevated copy numbers of DNMT mRNAs, which are especially high in septic shock patients. Interestingly, we did not find any differences between septic shock patients who lived to day five and those who died before day five, primarily because the patterns of EV numbers and DNMT mRNAs within each severity did not change significantly from day one in any group analysed. For this reason, we suggest that EV-DNMT mRNA content, when combined with the number of plasma EVs and determined upon admittance to the ICU, may be used to distinguish septic shock patients from critically ill, non-septic or sepsis patients.
As previously noted, the biological activity of EVs reflects their cytoplasmic components [Citation22]. In infectious disease, not all EVs have the same surface markers [Citation53], suggesting that it is possible that a significant percentage of these EVs are from bacterial origin. It has been reported that certain pathogens do produce EVs that have similar biophysical properties and within the size range of our patient samples (most abundant ~150 nm in size) [Citation54,Citation55]. Studies report that during sepsis, DNA methylation linked to the suppression of transcription of host protective genes is due to pathogen infections [Citation56]. In fact, changes in methylation status are associated with development of inflammation, cellular death, and multiple organ dysfunction [Citation2]. DNA methylation in humans is fundamentally performed by three functional DNA methyltransferases (DNMTs); DNMT1 is responsible for maintenance based on hemi-methylated DNA, while DNMT3A and DNMT3B are responsible for de novo methylation in the absence of hemi-methylated DNA [Citation3].
DNA methylation by these DNMTs can be altered by various biological parameters such as ageing, infection, or developmental and environmental factors. Ageing and age-related diseases, i.e. cancer [Citation57], idiopathic pulmonary fibrosis (IPF) [Citation41], sepsis [Citation36,Citation58], Alzheimer’s disease [Citation59,Citation60], are characterized by alterations in 5-methycytosine content resulting in genome-wide hypomethylation and promoter-specific hypermethylation. In sepsis, many studies show that pathogen infection can increase DNMT activity, DNMT mRNA expression, and DNA methylation in epithelial [Citation61,Citation62], endothelial [Citation54,Citation63], and dendritic cells [Citation63,Citation64]. Interestingly, unlike eukaryotes, bacteria have specific DNA methyltransferases (DNA Adenine methyltransferases, DAM or CcrM methylases) that methylate the adenosine at specific sites of hemi-methylated DNA only without dissociation from DNA, resulting in transcriptional repression. This bacterial DNA methylation machinery is unique and specific for bacterial cells with specific DNA methyltransferases that are different in structure, function, and outcome from eukaryotic DNMTs [Citation65]. In this study, we found that critically ill, non-septic patients along with sepsis and septic shock patients contain plasma EVs with detectable levels of human DNMT mRNAs by qPCR, while EVs from healthy volunteers do not. Therefore, our results suggest that bacterial EVs do not significantly contribute to our observation that DNMTs are elevated in EVs from sepsis and septic shock patients.
In summary, we demonstrate that exceedingly high levels of EVs in the circulation of septic shock patients, coupled with relative amounts of EV-DNMT mRNAs carried within these EVs, may be a novel molecular marker for distinguishing septic shock patients from the critically ill patients with or without sepsis upon admittance to the ICU. One key factor appears to be the ratio of the de novo methylating factors, EV-DNMT3A and EV-DNMT3B, to the maintenance-methylating factor, EV-DNMT1, which may shift the body away from homoeostasis and lead to death. Finally, this study supports the investigation of new treatment modalities targeting specific methylating factors, as well as cellular processes that drive the EV storm which accompanies septic shock.
Methods
Patient information
Patient samples were obtained following IRB# 2010H0281 at The Ohio State University Wexner Medical Centre. All patients or their surrogates provided written informed consent. The study cohort includes critically ill, non-septic patients as the control group and patients with sepsis. Not all patients in gave consent to donate their blood for research purposes. refers to all 33 patients diagnosed in the study, while the data used to characterize the EVs and gene expression were only a subset from those patients who consented to take part in the study (27 total: 10 from control, 10 from sepsis, and 7 from septic shock). Sepsis was clinically defined as presenting two or more SIRS criteria, including: body temperature >38°C or <36°C; heart rate >90 min-1; hyperventilation evidenced by a respiratory rate of >20 min-1 or Paco2 of <32 mmHg; a white blood cell count of >12,000 cells µL-1 or <4,000 µL-1; and the presence of suspected or confirmed infection [Citation66]. Critically ill, non-septic patients were defined as patients admitted to the Surgical Intensive Care Unit requiring intubation but without septic insult.
Plasma EVs isolation
Total plasma EVs were isolated from patients immediately after plasma collection at day 1, day 3 and day 5 from the time of diagnosis. Approximately 8 mL of blood was collected in EDTA vials and plasma was isolated by layering blood over Ficoll-Paque (Cat. # 17-5442-03, GE Healthcare) and centrifuged at 2,000 rpm for 20 minutes at room temperature. Isolated plasma (1 mL) was then subjected to further centrifugation at 4,500xg for 15 minutes at 4°C to remove cell debris followed by 21,000xg for 30 minutes at 4°C for EV isolation.
EVs quantification
The NanoSight NS300 (Malvern) was used to determine the different size populations and quantification of each EV population. NanoSight analyses were performed at either The Ohio State University Analytical Cytometry Core Facility or the WVU Flow Cytometry Core Facility. EVs were collected as described above and suspended in 500 µl filtered PBS and tested by light scattering where no labelling is required.
Quantitative (q)PCR analyses
RNA was isolated from circulating plasma EVs and subjected to Trizol:chloroform extraction (Cat. # 15596–018, Invitrogen). Samples were precipitated in isopropanol for 24–48 hours. RNA was pelleted via centrifugation and suspended in RNAse/DNAse-free water. Concentrations were determined using NanoDrop spectrophotometry (ND-1000, NanoDrop). cDNA was synthesized from 1 μg total RNA from each group (healthy, critically-ill non septic, septic, and septic shock) using Superscript III Reverse Transcriptase (Cat. #11752-250, Invitrogen) followed by qPCR using specific validated primers for each gene (human): DNMT1 (Cat. # PPH01055), DNMT3A (Cat. # PPH02339B), DNMT3B (Cat. # PPH01054F), CAP-1 (Cat. # PPH02293B), and RPL4 (Cat. # PPH13915A), SABiosciences) and SYBR Green PCR Master Mix (Cat. # 4309155, ThermoFisher). mRNA expression was profiled using an Applied Biosystems 7900HT real-time PCR instrument equipped with a 384-well reaction plate as previously described [Citation67,Citation68]. Data were analysed according to the comparative threshold method based on a geometric average of the housekeeping genes CAP-1 (Adenylyl cyclase-associated protein-1) and RPL4 (Ribosomal Protein L4), which presented the smallest variance among housekeeping genes assayed [Citation67,Citation68].
Statistics
Statistical analyses were performed using GraphPad Prism 7.0 software (La Jolla, California). Spearman’s rho was used for nonparametric measure of rank correlation. Pearson’s r was used for bivariate correlations. One-way ANOVA was used to determine statistically significant differences between the means of two or more independent groups and Tukey’s HSD post-hoc was used to confirm where differences occurred between individual groups. Hotelling’s T2 testing was used to determine significant differences in the 2-dimensional means of the natural logs of variables. P values of less than 0.05 were considered significant.
Study approval
This study was conducted according to the principles of the Declaration of Helsinki and approved by the Ohio State University Wexner Medical Centre IRB (protocol 2010H0281). Patients were included in the study after provision of written informed consent by their legally authorized representative.
Supplemental Material
Download Zip (137.2 KB)Acknowledgments
This study was supported in part with funding from a WVCTSI grant (GM104942) as start-up to TDE, West Virginia State Startup Funds and NHLBI R01HL109481 to CBM, UL1RR025755 to JW from the National Centre for Advancing Translational Science, the Stroke CoBRE grant GM109098 and WVCTS grant GM104942 for use of the NanoSight NS 300, and the WVCTS GM104942 and WV-INBRE GM103434 grants for the ARIA III at the WVU Flow Cytometry Core Facility. The content is solely the responsibility of the authors and does not necessarily represent the official views of the National Centre for Advancing Translational Sciences or the National Institutes of Health.
Supplemental material
Supplemental data can be accessed here
Additional information
Funding
Related Research Data
References
- Bird A. DNA methylation patterns and epigenetic memory. Genes Dev. 2002;16(1):6–17.
- Robertson KD. DNA methylation and human disease. Nat Rev Genet. 2005;6(8):597–610.
- Fatemi M, Hermann A, Gowher H, et al. Dnmt3a and Dnmt1 functionally cooperate during de novo methylation of DNA. Eur J Biochem. 2002;269(20):4981–4984.
- Allis CD1, Jenuwein T2. The molecular hallmarks of epigenetic control. Nat Rev Genet. 2016 Aug;17(8):487–500. doi: 10.1038/nrg.2016.59.
- Robertson KD. DNA methylation and chromatin - Unraveling the tangled web. Oncogene. 2002;21(35REV. ISS. 3):5361–5379.
- Ashapkin VV, Kutueva LI, Vanyushin BF. Dnmt2 is the most evolutionary conserved and enigmatic cytosine DNA methyltransferase in eukaryotes. Russ J Genet. 2016;52(3):237–248.
- Bourc’his D. Dnmt3L and the establishment of maternal genomic imprints. Science. 2001;294(5551):2536–2539.
- Théry C, Zitvogel L, Amigorena S. Exosomes: composition, biogenesis and function. Nat Rev Immunol. 2002;2(8):569–579.
- Redman CWG, Sargent IL. Microparticles and immunomodulation in pregnancy and pre-eclampsia. J Reprod Immunol. 2007;76(1–2):61–67.
- Pap E, Pállinger É, Pásztói M, et al. Highlights of a new type of intercellular communication: microvesicle-based information transfer. Inflamm Res. 2009;58(1):1–8.
- Zhang YN, Vernooij F, Ibrahim I, et al. Extracellular vesicle proteins associated with systemic vascular events correlate with heart failure: an observational study in a dyspnoea cohort. PLoS One. 2016;11(1). DOI:10.1371/journal.pone.0148073
- Becker A, Thakur BK, Weiss JM, et al. Extracellular vesicles in cancer: cell-to-cell mediators of metastasis. Cancer Cell. 2016;30(6):836–848.
- Ismail N, Wang Y, Dakhlallah D, et al. Macrophage microvesicles induce macrophage differentiation and miR-223 transfer. Blood. 2013;121(6):984–995.
- Sakr Y, Jimenez E, Njimi H, et al. Assessment of the worldwide burden of critical illness: the intensive care over nations (ICON) audit. Lancet Respir Med. 2014;2(5):380–386.
- Angus DC, Linde-Zwirble WT, Lidicker J, et al. Epidemiology of severe sepsis in the USA: analysis of incidence, outcome, and associated costs of care. CritCareMed. 2001;29(7):1303–1310.
- Ramachandran G. Gram-positive and gram-negative bacterial toxins in sepsis: a brief review. Virulence. 2013;5(1):27024.
- Bone RC. American college of chest physicians/society of critical care medicine consensus conference: definitions for sepsis and organ failure and guidelines for the use of innovative therapies in sepsis. Chest J. 1992;20(6):1644.
- Karlsson S, Varpula M, Ruokonen E, et al. Incidence, treatment, and outcome of severe sepsis in ICU-treated adults in Finland: the finnsepsis study. Intensive Care Med. 2007;33(3):435–443.
- Kaukonen K-M-M, Bailey M, Pilcher D, et al. Systemic inflammatory response syndrome criteria in defining severe sepsis. N Engl J Med. 2015;372(17):1629–1638.
- Hotchkiss RS, Monneret G, Payen D. Sepsis-induced immunosuppression: from cellular dysfunctions to immunotherapy. Nat Rev Immunol. 2013;13(12):862–874.
- Boulanger CM, Scoazec A, Ebrahimian T, et al. Circulating microparticles from patients with myocardial infarction cause endothelial dysfunction. 2001;2649–2652. DOI:10.1161/hc4701.100516.
- Trappenburg MC, Van Schilfgaarde M, Marchetti M, et al. Elevated procoagulant microparticles expressing endothelial and platelet markers in essential thrombocythemia. Haematologica. 2009;94(7):911–918.
- Diamant M, Nieuwland R, Pablo RF, et al. Elevated numbers of tissue-factor exposing microparticles correlate with components of the metabolic syndrome in uncomplicated type 2 diabetes mellitus. Circulation. 2002;106(19):2442–2447.
- Lin Z-B, Ci H-B, Li Y, et al. Endothelial microparticles are increased in congenital heart diseases and contribute to endothelial dysfunction. J Transl Med. 2017;15(1):4.
- VanWijk MJ, Nieuwland R, Boer K, et al. Microparticle subpopulations are increased in preeclampsia: possible involvement in vascular dysfunction? Am J Obstet Gynecol. 2002;187(2):450–456.
- Perel A, Segal E, Khurana A, et al. Management of Sepsis. N Engl J Med. 2007;356(11):1178–1182.
- Berckmans RJ, Nieuwland R, Böing AN, et al. Cell-derived microparticles circulate in healthy humans and support low grade thrombin generation. Thromb Haemost. 2001;85(4):639–646.
- Gasser O, Schifferli JA. Activated polymorphonuclear neutrophils disseminate anti-inflammatory microparticles by ectocytosis. Blood. 2004;104(8):2543–2548.
- Dignat-George F, Boulanger CM. The many faces of endothelial microparticles. Arterioscler Thromb Vasc Biol. 2011;31(1):27–33.
- George FD. Microparticles in vascular diseases. Thromb Res. 2008;122(SUPPL.1). DOI:10.1016/S0049-3848(08)70020-3
- Joop K, Berckmans RJ, Nieuwland R, et al. Microparticles from patients with multiple organ dysfunction syndrome and sepsis support coagulation through multiple mechanisms. Thromb Haemost. 2001;85(5):810–820.
- Ratajczak J, Miekus K, Kucia M, et al. Embryonic stem cell-derived microvesicles reprogram hematopoietic progenitors: evidence for horizontal transfer of mRNA and protein delivery. Leukemia. 2006;20(5):847–856.
- Barry OP, Praticò D, Lawson JA, et al. Transcellular activation of platelets and endothelial cells by bioactive lipids in platelet microparticles. J Clin Invest. 1997;99(9):2118–2127.
- Mesri M, Altieri DC. Endothelial cell activation by leukocyte microparticles. J Immunol. 1998;161(8):4382–4387.
- Cai Y, Xu M-J, Koritzinsky EH, et al. Mitochondrial DNA–enriched microparticles promote acute-on-chronic alcoholic neutrophilia and hepatotoxicity. JCI Insight. 2017;2(14). DOI:10.1172/jci.insight.92634
- Nieuwland R, Berckmans RJ, McGregor S, et al. Cellular origin and procoagulant properties of microparticles in meningococcal sepsis. Blood. 2000;95(3):930–935.
- Hunter MP, Ismail N, Zhang X, et al. Detection of microRNA expression in human peripheral blood microvesicles. PLoS One. 2008;3(11). DOI:10.1371/journal.pone.0003694
- Yokoi A, Yoshioka Y, Yamamoto Y, et al. Malignant extracellular vesicles carrying MMP1 mRNA facilitate peritoneal dissemination in ovarian cancer. Nat Commun. 2017;8. DOI:10.1038/ncomms14470.
- Cardoso MC, Leonhardt H. DNA methyltransferase is actively retained in the cytoplasm during early development. J Cell Biol. 1999;147(1):25–32.
- Guiducci S, Distler JHW, Jüngel A, et al. The relationship between plasma microparticles and disease manifestations in patients with systemic sclerosis. Arthritis Rheum. 2008;58(9):2845–2853.
- Amore E, Ferraro M, Manca ML, et al. Mucoadhesive solid lipid microparticles for controlled release of a corticosteroid in the chronic obstructive pulmonary disease treatment. Nanomedicine. 2017;12(19):2287–2302.
- Horvath S. Erratum to: DNA methylation age of human tissues and cell types. Genome Biol. 2015;16(1):96.
- Horvath S. DNA methylation age of human tissues and cell types. Genome Biol. 2013;14(10). DOI:10.1186/gb-2013-14-10-r115
- Ratajczak J, Wysoczynski M, Hayek F, et al. Membrane-derived microvesicles: important and underappreciated mediators of cell-to-cell communication. Leukemia. 2006;20(9):1487–1495.
- Faix JD. Biomarkers of sepsis. Crit Rev Clin Lab Sci. 2013;50(1):23–36.
- Cho SY, Choi JH. Biomarkers of Sepsis. Infect Chemother. 2014;46(1):1–12.
- Trahtemberg U, Mevorach D. Apoptotic cells induced signaling for immune homeostasis in macrophages and dendritic cells. Front Immunol. 2017;8:1356.
- Finkielsztein A, Mascarenhas L, Butin-Israeli V, et al. Isolation and characterization of neutrophil-derived microparticles for functional studies. J Vis Exp. 2018;(133). DOI:10.3791/56949.
- Hainsworth AH, Yeo NE, Weekman EM, et al. Homocysteine, hyperhomocysteinemia and vascular contributions to cognitive impairment and dementia (VCID). Biochim Biophys Acta - Mol Basis Dis. 2016;1862(5):1008–1017.
- Prattichizzo F, Micolucci L, Cricca M, et al. Exosome-based immunomodulation during aging: a nano-perspective on inflamm-aging. Mech Ageing Dev. 2017;168:44–53.
- Mbagwu S, Walch M, Filgueira L, et al. Production and characterization of extracellular vesicles in malaria. Extracell Vesicles Methods Protoc. 2017;1660:377–388.
- Bellingham SA, Guo BB, Coleman BM, et al. Exosomes: vehicles for the transfer of toxic proteins associated with neurodegenerative diseases? Front Physiol. 2012 May 3. DOI:10.3389/fphys.2012.00124.
- Kowal J, Primdal-Bengtson B, Dingli F, et al. Proteomic comparison defines novel markers to characterize heterogeneous populations of extracellular vesicle subtypes. Proc Natl Acad Sci. 2016;113(8):E968–E977.
- Hellum M, Øvstebø R, Brusletto BS, et al. Microparticle-associated tissue factor activity correlates with plasma levels of bacterial lipopolysaccharides in meningococcal septic shock. Thromb Res. 2014;133:507–514.
- Schertzer JW, Whiteley M. Bacterial outer membrane vesicles in trafficking, communication and the host-pathogen interaction. US Natl Libr Med. 2013;23:118–130.
- Jiang Y, Gao M, Wang W, et al. Sinomenine hydrochloride protects against polymicrobial sepsis via autophagy. Int J Mol Sci. 2015;16(2):2559–2573.
- Bueno V, Sant’Anna OA, Lord JM. Ageing and myeloid-derived suppressor cells: possible involvement in immunosenescence and age-related disease. Age (Dordr). 2014;36(6):9729.
- Tyml K, Swarbreck S, Pape C, et al. Voluntary running exercise protects against sepsis-induced early inflammatory and pro-coagulant responses in aged mice. Crit Care. 2017;21(1):210.
- Saman S, Kim WH, Raya M, et al. Exosome-associated tau is secreted in tauopathy models and is selectively phosphorylated in cerebrospinal fluid in early alzheimer disease. J Biol Chem. 2012;287(6):3842–3849.
- Soldan A, Pettigrew C, Cai Q, et al. Cognitive reserve and long-term change in cognition in aging and preclinical alzheimer’s disease. Neurobiol Aging. 2017;60:164–172.
- Takahashi K, Sugi Y, Nakano K, et al. Epigenetic control of the host gene by commensal bacteria in large intestinal epithelial cells. J Biol Chem. 2011;286(41):35755–35762.
- Niwa T, Tsukamoto T, Toyoda T, et al. Inflammatory processes triggered by helicobacter pylori infection cause aberrant DNA methylation in gastric epithelial cells. Cancer Res. 2010;70(4):1430–1440.
- Thangavel J, Malik AB, Elias HK, et al. Combinatorial therapy with acetylation and methylation modifiers attenuates lung vascular hyperpermeability in endotoxemia-induced mouse inflammatory lung injury. Am J Pathol. 2014;184(8):2237–2249.
- Bierne H, Hamon M, Cossart P. Epigenetics and bacterial infections. Cold Spring Harb Perspect Med. 2012;2(12). DOI:10.1101/cshperspect.a010272
- Sánchez-Romero MA, Cota I, Casadesús J. DNA methylation in bacteria: from the methyl group to the methylome. Curr Opin Microbiol. 2015;25:9–16.
- Shalova IN, Lim JY, Chittezhath M, et al. Human monocytes undergo functional re-programming during sepsis mediated by hypoxia inducible factor 1. Immunity. 2015;42(3):484–498.
- Dakhlallah D, Batte K, Wang Y, et al. Epigenetic regulation of mir-17∼92 contributes to the pathogenesis of pulmonary fibrosis. Am J Respir Crit Care Med. 2013;187(4):397–405.
- Dakhlallah D, Zhang J, Yu L, et al. MicroRNA-133a engineered mesenchymal stem cells augment cardiac function and cell survival in the infarct heart. J Cardiovasc Pharmacol. 2015;65(3):241–251.