
ABSTRACT
A time-of-travel synoptic survey was conducted in August 2014 to assess pesticide occurrence in major river subbasins of southern Alberta, Canada. We collected 155 water samples from Alberta's South Saskatchewan River Basin (Bow, Oldman, Red Deer, and South Saskatchewan river subbasins) and analysed them for 106 pesticides. Samples were collected from mainstems (rivers) as well as tributaries and effluents (point sources) discharging into the rivers in an estimated time-of-travel to capture agricultural and urban contributions as the water flowed eastward from headwaters in the Rocky Mountains. The aim of the study was to assess point-source contributions of pesticides to Alberta's South Saskatchewan River Basin mainstems during low flow conditions. In addition to examining differences in pesticide contributions among source type and subbasins, the cumulative effect of inputs on the mainstem rivers, the influence of land use, and seasonality of pesticides in select effluents was analysed. We detected 17 pesticides and 1 metabolite, reflecting runoff from agricultural and urban land use. Pesticide detection frequency was significantly higher in effluents than in tributaries and mainstems, and pesticides were detected in effluents in summer and winter. Our evaluation of land-use relationships highlighted the influence of agriculture on pesticide occurrence in these aquatic agroecosystems. To our knowledge, this is the first watershed-wide time-of-travel survey of pesticides conducted in southern Alberta to measure contributions of pesticide loads from effluents and tributaries to the mainstems in all regions of Alberta's South Saskatchewan River Basin.
Introduction
Pesticides are widely used to control pests and increase agricultural productivity worldwide (Alavanja Citation2009). The large volume of pesticides used increases the risk of contamination of water resources (Gagnon et al. Citation2014, Citation2016), which can potentially impact environmental (Ensminger et al. Citation2013, Carpenter et al. Citation2016) and human health (Morgan et al. Citation2008, Lammoglia et al. Citation2017). In Canada alone, a large number of pesticide products are registered for use, and >101 million kg active ingredients of pesticides are sold annually (Health Canada Citation2014). In Alberta, most (95%) pesticides are sold for agricultural purposes (Alberta Environment and Sustainable Resource Development Citation2015a), and herbicides are the dominant group of pesticides used (Environment Canada Citation2011).
The agricultural sector is the main user of pesticides, resulting in tributaries and agricultural streams contributing pesticides to mainstem rivers in North America (Hladik et al. Citation2009). Urban sources of pesticides are also significant and can be at least as important as agricultural sources in Europe (Nitschke and Schussler Citation1998, Blanchoud et al. Citation2004, Wittmer et al. Citation2010, Citation2011, Cahill et al. Citation2011, Kock-Schulmeyer et al. Citation2013, Gasperi et al. Citation2014), Australia (Rippy et al. Citation2017), and North (Bailey et al. Citation2000) and South (López-Doval et al. Citation2017) America. In particular, pesticides are poorly removed by waste water treatment plants (WWTPs), and WWTP effluents can represent significant sources of pesticides (Monteith et al. Citation1995, Gerecke et al. Citation2002, Burkhardt et al. Citation2007, Kerr et al. Citation2008, Piel et al. Citation2012).
Pesticides can persist and be detected in surface waters outside of their application period (Kimbrough and Litke Citation1996). More specifically, auxin herbicides such as 2,4-D and mecoprop have been detected in soil (Anesio et al. Citation2018), groundwater (Munira et al. Citation2018), and stormwater (Rippy et al. Citation2017) during the off-season, likely a consequence of their physicochemical properties and those of the soils as well as pesticide usage (quantities and formulations applied in a region). Similar results were obtained in water across the Canadian prairies (Byrtus et al. Citation2004, Donald et al. Citation2007). Nonetheless, seasonal patterns where pesticide occurrence and concentrations in water collected from rivers and WWTP effluents are higher shortly after or during periods of use and lower the rest of the year have been observed worldwide (Kimbrough and Litke Citation1996, Nitschke and Schussler Citation1998, Hoffman et al. Citation2000, Phillips and Bode Citation2004, Johnson et al. Citation2011, Kock-Schulmeyer et al. Citation2013, Rippy et al. Citation2017).
Several monitoring studies of pesticides in agricultural streams, irrigation water, and storm water conducted in Alberta have shown that surface water contamination is prevalent (Anderson Citation2005, Saffran Citation2005, Phelan Citation2012, Charest et al. Citation2015, Basiuk et al. Citation2017), but few studies have looked at pesticides in Alberta's groundwater (Munira et al. Citation2018), urban storm water (Derksen et al. Citation2015), and WWTP effluents (Kerr et al. Citation2008). To our knowledge, none has looked at the occurrence of pesticides in all regions of Alberta at the watershed scale using a time-of-travel survey (in which sampling is performed as a conceptual parcel of the water flows from its headwaters to its confluence, and tributaries and effluents are sampled as they contribute to the parcel) to evaluate point-source pesticide contributions and to determine whether or not loads are cumulative with multiple input sources as the parcels flow downstream.
This manuscript describes the results of a time-of-travel synoptic survey of water quality conducted in the 4 river subbasins of the South Saskatchewan River Basin (SSRB) of Alberta, Canada. The objectives of this study were to measure pesticides and evaluate (1) the influence of point sources (effluents and tributaries) on mainstems, (2) the differences in contribution among sample types and subbasins, (3) the influence of both individual and cumulative inputs on the mainstems, (4) land-use influences, and (5) seasonality of pesticides in effluents. Low-flow conditions can help decipher contaminant sources because dilution is lower in rivers and water temperatures are higher, representing more extreme water quality and reduced aquatic habitat scenarios (Wynn and Spahr Citation1998). Time-of-travel sampling was chosen over traditional eulerian (fixed-point) sampling because of the technique’s ability to more precisely identify contaminant sources (as concentrations and loads) to mainstem rivers (due to reduced temporal variability of the constituents in the contributing sources as well as in the receiving mainstems) and to assess longitudinal dispersion (Meade and Stevens Citation1990, Ross et al. Citation1996, Iwanyshyn et al. Citation2008, Barber et al. Citation2011). Simultaneous sampling at multiple locations in each subbasin following the same water parcels in an estimated time-of-travel also allowed comparison between basins and provided a useful overview of the water quality conditions in the larger SSRB during low-flow conditions. We hypothesized that (a) point sources (effluents and tributaries) contribute pesticides to the watershed, and differences in contribution would be detected among sample types and subbasins; (b) individual and cumulative inputs of pesticides on the watershed would be detected, (c) land-use relationships with pesticide occurrence would be found, and that (d) seasonality of pesticides in select effluents would be observed.
Materials and methods
Study area
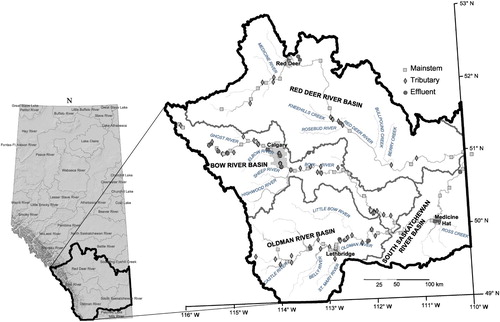
The study area consisted of the SSRB and comprised its 4 river subbasins of southern Alberta (those of the Oldman, Bow, South Saskatchewan, and Red Deer rivers) in addition to 1 mainstem site in the province of Saskatchewan after the confluence of the South Saskatchewan and Red Deer rivers (). These watersheds comprise mainly agricultural land and several major urban centers including the cities of Calgary, Red Deer, Lethbridge, and Medicine Hat, which represent >90% of the total population in the area (Alberta Agriculture and Rural Affairs Citation2010). Water use is heavily regulated in all subbasins, and irrigation is a major water user, especially in the Bow and Oldman watersheds (78% and 88% of total water use, respectively; Alberta Agriculture and Rural Affairs Citation2010).
Figure 1. Major subbasins and time-of-travel synoptic survey mainstem, tributary, and effluent sampling sites in the South Saskatchewan River Basin in southern Alberta, Canada.
Precipitation
Precipitation from May to August 2014 for Yaha Tinda, Lacombe, Bow Valley, Calgary, Livingston Gap, Lethbridge, and Medicine Hat was tabulated from Alberta Agriculture and Forestry's weather data publically available at http://www.agric.gov.ab.ca/acis/alberta-weather-data-viewer.jsp and graphed (Supplement S1). In the absence of a station in the city of Red Deer, the nearby Lacombe station was chosen to represent precipitation in the Red Deer river subbasin. Long-term August averages were queried for comparison from www.weather-ca.com.
Sample collection
Sampling was performed during arid conditions, when dilution from the mainstem is less, to identify effluent and tributary sources contributing pesticides to the watershed. The time-of-travel sampling regime offered the ability to maximize identification of anthropogenic point sources (effluents and tributaries) of pesticides to the mainstem rivers, evaluate how each individual input immediately affected the mainstem river as well as the cumulative effect of inputs, and observe longitudinal patterns (Meade and Stevens Citation1990, Ross et al. Citation1996, Iwanyshyn et al. Citation2008). Sampling was upstream to downstream, following the same water parcels in an estimated time-of-travel method using flow routing tables from Alberta Environment and Parks (AEP) SSRB natural flow model that uses the Streamflow Synthesis and Reservoir Regulation routing scheme (US Army Corps of Engineers Citation1991). The sampling schedule was determined by AEP hydrologists and finalized using 5 August flows to produce a strict site sampling schedule that was adhered to as far as allowed by safety and timing restrictions. Sampling start times were staggered in each watershed so the parcels of water from each watershed would arrive simultaneously at their respective confluences (i.e., the Bow and Oldman river parcels would simultaneously arrive at their confluence to form the South Saskatchewan river parcel, which would simultaneously arrive at the confluence with the Red Deer river parcel). During a 17 d period from 6–22 August 2014, we collected 155 samples: 67 in the Bow watershed (11 effluent, 30 tributary, and 26 mainstem), 43 in the Oldman (5 effluent, 20 tributary, and 18 mainstem), 15 in the South Saskatchewan subwatershed (4 effluent, 2 tributary, and 9 mainstem), 29 in the Red Deer (4 effluent, 11 tributary, and 14 mainstem), and 1 in the province of Saskatchewan after the confluence of the South Saskatchewan and Red Deer rivers. Effluent samples included both municipal (18) and industrial (6) facilities (power generation, chemical and fertilizer processing, oil, and gas), encompassing a variety of treatment types. Time-of-travel could not be estimated through reservoirs; therefore, sampling resumed the following day downstream of a reservoir. Snapshot sampling was followed upstream of Banff (station BM3) and the Oldman (station OM2) and Dickson (station RM4) dams because stream flow routing tables do not exist for these headwaters. Sampling sites are depicted in Supplement S2.
Water samples were manually collected once as grab samples (Alberta Environment Citation2006) from the middle or the safely wadeable portion of the streamflow at each location. Effluent samples were collected at the location of access within each facility that was closest to the river discharge point or in the discharge itself. Each sample consisted of 1 L water collected in an amber glass bottle. The water samples were kept on ice until delivery to the laboratory and then stored in a refrigerator at 4 °C until extracted and analyzed. Samples were analyzed for 106 pesticides (Supplement S3) comprising both historical-use and current-use pesticides previously detected in Alberta's surface waters (Anderson Citation2005). Eight WWTP effluents (2 WWTP effluents per subbasin) were resampled once in winter to determine whether the presence of pesticides at those sites was seasonally dependent. The winter samples were collected and processed as described for the synoptic samples. Sampling also included field measurements and observations, nutrients, total and dissolved metals, inorganics, physical parameters, and coliforms; however, evaluation of these parameters is beyond the scope of this paper.
Sample analysis
Water samples were filtered through glass wool, acidified with concentrated sulfuric acid to pH 2, and extracted by liquid–liquid partitioning with dichloromethane. Extracts were then dried with acidified Na2SO4, concentrated under nitrogen gas, methylated using diazomethane, transferred to hexane, and adjusted to a final volume of 10 mL. To determine recoveries, 1 mL of standard at known concentrations (spanning the expected concentration range in environmental samples) was pipetted separately in 1 L Milli-Q water and into a 250 mL round-bottom flask. The spiked MilliQ sample and 1L MilliQ water sample (blank) were extracted for environmental samples. First, 50 µL of 0.045M H2SO4 and 10 mL of dichloromethane were added to the spiked MilliQ sample in the round-bottom flask, and the sample derivatized. The ratio of the concentrations in the spiked water samples was then used to determine the percentage recovery of the extraction method.
Esterified extracts were analyzed (2 μL injections) using an Agilent 7890B gas chromatograph with a 7000C QQQ mass selective detector in multiple reaction monitoring mode. The column was HP-5MS UI 30 m × 0.25 mm × 0.25 um, p/n 19091S-433UI. Temperature programming was 70 °C for 2 min, ramp of 25 °C/min to 150 °C, ramp 3 °C/min to 200 °C, and then ramp of 8 °C/min to 280 °C for 7 min. Total analysis time was 38.867 min. One target ion and at least 2 qualifier ions were monitored. The limit of detection was 0.025 μg/L for most pesticides. Detections below these limits were outside the range of the external standard curve and were assigned values of zero (none detected). Method blanks were run with each set of water samples analyzed. Limits of quantification and recoveries for all pesticides are presented in Supplement S3.
Data analysis
Detection frequency represents the number of samples with at least one pesticide detected, divided by the number of sites sampled and multiplied by 100 to yield a percentage. Land use at each sample site was assigned using a GIS analysis between the hydrologic unit code (HUC)-8 watersheds and Agriculture and Agri-Food Canada's 2014 annual crop inventory publicly available at https://open.canada.ca/data/en/dataset/ba2645d5-4458-414d-b196-6303ac06c1c9. Using ArcGIS 10.3, the HUC-8 watershed polygons were converted to raster format and aligned to the crop inventory raster using the Polygon to Raster geoprocessing tool. The Combine geoprocessing tool was used to count the number of 30 × 30 m cells for each land use type inside every HUC-8 watershed. Each land-use type was expressed as a percentage of total land use and categorized into 6 groups: field crop (barley, canola and rapeseed, corn, pasture and forages, spring wheat, winter wheat, flaxseed, hemp, herbs, mustard, oats, rye, soybeans, sunflower, triticale), vegetable (beans, lentils, peas, potatoes, sugar beets), urban and developed, grass–shrubland (grassland, shrubland, fallow), water–barren (exposed land and barren, water, wetland), and forest cover (broadleaf, coniferous, mixedwood) (Supplement S4).
Total pesticide loads were calculated at each sampling station as mean daily discharge on the date of sampling multiplied by concentration. Flows were measured by Water Survey of Canada hydrometric stations (https://wateroffice.ec.gc.ca) or by the irrigation district, and all WWTP effluent flows were measured by the operator as normally mandated by AEP. Unavailable mainstem flow measurements were estimated with assistance from AEP hydrologists using cumulative summing of additions to the mainstem to the upstream gauged station. Where ungauged tributary additions occurred, the regional regression (Capesius and Stephens Citation2009), drainage area (Emerson et al. Citation2005), or pragmatic (Metcalfe et al. Citation2005, Smakhtin and Shilpakar Citation2005) methods were used to estimate flow (Supplement S5). Flow was not available and could not be estimated at 5 tributary stations in the Oldman watershed (ungauged irrigation drains), and therefore loads were not calculated for those stations.
Pesticide concentrations were compared to the Canadian Environmental Quality Guidelines of the Canadian Council of Ministers of the Environment (CCME Citation2005), which include protection of aquatic life and protection of agricultural water uses (irrigation and livestock watering). Pesticide physicochemical properties, including field half-life, water solubility, and organic carbon to water partition coefficient (log Koc), were obtained from the IUPAC Pesticides Properties Database (PPDB database, University of Hertfordshire; IUPAC Citation2013); pesticide sales (used as surrogate because pesticide use data were not available) were compiled from Alberta Environment and Sustainable Resource Development (Citation2015a); pesticides application periods (pre-emergence, post-emergence) were obtained from the Weed Science Society of America's Herbicide Handbook (WSSA Citation1994); and pesticides application rates on cereal, corn, and forage crops were obtained from Alberta's Crop Protection 2014 Handbook (Alberta Agriculture and Rural Development Citation2014).
Generalized linear mixed models were completed using Proc GLIMMIX in SAS/STAT software of the SAS System for Windows 9.4 (SAS Institute Citation2017) to evaluate the effect of river subbasin (Red Deer, Oldman, Bow, South Saskatchewan) and sample type (mainstem, tributary, effluent) on detection frequency and number of pesticides’ detected response variables. This method can account for autocorrelation among observations and unequal sample sizes and can handle numerous data distributions, including binary and binomial. Models were tested for interactions and originally run with river subbasin, sample type, and river subbasin × sample type as fixed effects. In models where the interaction term (or terms included in the interaction term) were not significant, the interaction term was removed and the model was run again. To correct for type I errors the p-values from the post hoc Tukey–Kramer with adjustment for multiple comparisons were used.
Using JMP 14.0.0 (JMP Citation1989–2007; SAS Institute), associations of total pesticide concentration with land-use groups and catchment area were assessed using Spearman's rho, which is suitable for skewed distributions and robust to extreme values. Alpha was adjusted for family-wise error rate using a Bonferroni correction. Where pesticide values were below the method detection limit, the value of zero was assigned for statistical comparisons and load calculations. Because the same parcel of water was sampled in each subbasin, total pesticides and total pesticide loads were tested with a Durbin Watson test with sample order in each river subbasin used to test for autocorrelation. Results revealed no significant autocorrelation, and therefore no amendments were applied. Seasonal results were assessed using a Wilcoxon test. The single sample in the province of Saskatchewan was not included in any statistical analyses. Unless otherwise noted, α = 0.05 for all statistical analyses.
Results
Precipitation
Precipitation was low over the length of the synoptic survey except for localized light showers (Supplement S1). Low precipitation is typical of climate conditions prevailing in August in southern Alberta, with the long-term August average ranging from 34 mm in Medicine Hat to 63 mm in Lacombe (not available for Livingston Gap or Yaha Tinda). Accumulated precipitation was near or below the long-term averages up until the time of sampling near these weather stations (www.weather-ca.com).
Synoptic survey
We detected 17 different pesticides and 1 pesticide degradation product (2,4-dichlorophenol [2,4-DCP]) in the time-of-travel synoptic water samples (, Supplement S6). All pesticides detected were current-use herbicides except for 2 obsolete compounds, the acaricide tetradifon and the herbicide chlorthiamid. Pesticides were detected in 47.7% of the samples. Detection frequencies of individual pesticides ranged from 45% for 2,4-D (70 samples) to 0.6% (chlorthiamid, clomazone, dichlobenil, dichlorprop, tetradifon, and triclopyr; 1 sample each). Pesticides with the highest detection frequencies were 2,4-D followed by dicamba, mecoprop, (4-chloro-2-methylphenoxy) acetic acid (referred to as MCPA), clopyralid, and fluroxypyr (). Pesticides most frequently detected also showed the highest maximum detected concentrations (). While the majority of samples had individual pesticide concentrations below available CCMEs Canadian Environmental Quality Guidelines, 3 pesticides (dicamba, MCPA, and bromoxynil) exceeded their irrigation guidelines (0.006, 0.025, and 0.33 µg/L, respectively) in a number of samples, and 1 sample had 2,4-D at a concentration exceeding its protection of aquatic life guideline of 4.0 µg/L (). When all pesticide concentrations in a sample were added (Σ[pesticides]), 6 samples exceeded a total concentration of 1.000 µg/L: 3 samples from the Bow (2) and Oldman (1), and 3 samples from the Red Deer (2) and South Saskatchewan (1) river subbasins. These samples were collected from municipal and industrial effluents as well as tributaries.
Table 1. Summary of pesticides detected in August synoptic survey (n = 155) and selected WWTP effluents in August 2014 (summer, n = 8) and February 2015 (winter, n = 8), including number of detections, detection frequency, range, and median of detected* concentrations. Pesticides detected in both August 2014 and February 2015 are in italics. Significant difference (p > 0.001) between seasons is indicated by results not sharing a common letter.
Pesticide occurrence in river subbasins
Detection frequency in each river subbasin varied (). The South Saskatchewan River subbasin exhibited a detection frequency (100%) higher than that of the Oldman (60%), Bow (39%), and Red Deer (24%) rivers, although not significantly different (a). The interaction effect between subbasin and sample type was not significant in the model (c). The number of different pesticide(s) detected per 1 L water sample varied from 0 (80 samples) to 7 (2 samples) for the entire synoptic survey. Although a similar number of different pesticides were detected in all river subbasins and were not significantly different, the interaction term (subbasin × sample type) in the model was significant ().
Figure 2. Pesticide detection frequency (%) according to the (a) river subbasin, (b) sample type, and (c) river subbasin and sample type. Groups not sharing a common letter indicate significant difference (p < 0.05) in a generalized linear mixed model. No significant differences in panel a or c. M = mainstem, T = tributary, E = effluent, South Sask = South Saskatchewan.
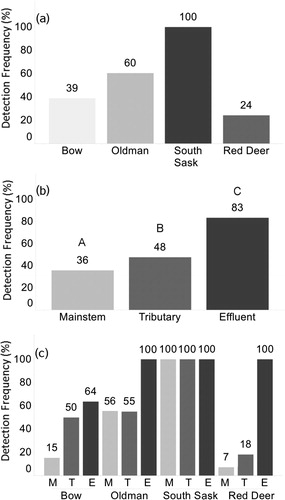
Table 2. Number of different pesticides detected per river subbasin and sampling site type, with average number of different pesticides detected per 1 L sample ± standard error in brackets. Within borders, groups not sharing a common letter indicate significant difference (p < 0.05) in a generalized linear mixed model. South Sask = South Saskatchewan.
Pesticide occurrence in mainstem, tributary, and effluent samples
Pesticides were detected in mainstems, tributaries, and effluents. Detection frequency was significantly (p < 0.05) lower in samples collected directly from the mainstem rivers (36%) and tributaries (48%) than those collected from effluents (83%) (b). Pesticides were detected in all samples collected from effluents of the Oldman, South Saskatchewan, and Red Deer river subbasins, although corresponding samples from the Bow River subbasin had a detection frequency of 64% (c). Effluent samples had a significantly (p < 0.05) higher number of different pesticides detected per sample than samples collected from tributaries and mainstems (). When each river subbasin was further analyzed according to sample type (effluent, tributary, mainstem) and the number of different pesticides detected, effluents showed a higher number of different compounds compared to their mainstems in each river basin, except for the South Saskatchewan River ().
Pesticide occurrence in relation to land use
Total pesticide concentration was examined in relation to watershed area and land use over the SSRB. Total pesticide concentration had a moderate, significant (p < 0.0001), positive correlation (ρ = 0.54, 0.31, 0.45, respectively) with combined vegetables, combined field crops, and watershed area while the remaining land use categories had significant (p < 0.001) negative (combined forest cover ρ = 0.57 and combined water-barren ρ = 0.26) or no significant (urban and developed and combined grass/shrubland–fallow) correlation (Supplement S7).
Pesticide loads
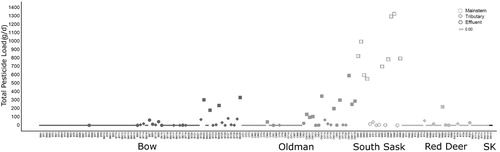
For each mainstem river, total pesticide loadings were higher downstream than those upstream except for the Red Deer River. While pesticide concentrations were lowest in mainstems, the cumulative discharge from tributaries produced increasing volumes of water downstream, resulting in higher mainstem loadings (downstream) than loadings from individual WWTP effluents and tributaries (). While effluents and tributaries contributed some of the highest concentrations of pesticides recorded in this survey to the mainstem rivers, their loads were not high enough to fully account for the difference found in the downstream mainstem sites (i.e., the cumulative load from effluents and tributaries did not equal the downstream load; ).
Figure 3. Total pesticide loads calculated at mainstem, tributary, and effluent water quality sample sites during the August 2014 synoptic survey (n = 155). South Sask = South Saskatchewan; SK = Province of Saskatchewan.
Seasonal detections in WWTP effluents
Eight WWTP effluents included in the original synoptic survey were selected for resampling during the winter season (Feb 2015) to determine whether pesticides would be detected in those effluents during a season of low to negligible pesticide use. Six of the 8 samples collected in winter contained at least 1 pesticide, with each individual pesticide having a detection frequency of 37.5% (2,4-D; 3 samples) or less (). The total number of different pesticides detected at the 8 selected WWTPs was 14 in August 2014 versus 6 in February 2015, with only 3 pesticides (2,4-D, mecoprop, and triclopyr) detected in both summer and winter (). Eleven other herbicides were detected in the August 2014 water samples while 3 other herbicides (chlorthiamid, clomazone, and dichlobenil) were detected in the February 2015 water samples (). Although overall detection frequency was high for both sampling periods (100% and 75% for summer and winter, respectively; ), results differed significantly (p < 0.001) with regard to the number of different pesticides detected per 1 L water sample (3–7 pesticides detected in Aug vs. 0–2 in Feb). The concentrations observed for 2,4-D in August 2014 were significantly higher (p < 0.001) than those obtained in February 2015.
Discussion
Synoptic survey
River low-flow conditions are considered critical to water quality and environmental pollutants such as pesticides and can be important from a land-use assessment perspective (Wynn and Spahr Citation1998). A time-of-travel synoptic survey of water quality was conducted in the 4 river subbasins of the SSRB of Alberta. Results indicated that pesticides were not detected above our limits of quantification in the headwaters of each river subbasin, but as the water traveled away from its primary source, pesticides were contributed from various tributaries and effluents (Supplement S5). While pesticide detection frequency and concentrations were higher in the tributaries and effluents, dilution of the effluents by receiving rivers (mainstems) likely prevented significant increases in individual pesticide detection downstream of these influents, a phenomenon also observed by Piel et al. (Citation2012).
Pesticides detected in this synoptic survey have been frequently detected in southern Alberta surface waters (Byrtus et al. Citation2002, Anderson Citation2005, Saffran Citation2005), urban storm waters (Derksen et al. Citation2015), irrigation waters (Charest et al. Citation2015), treated water (Byrtus et al. Citation2004), rainfall (Hill et al. Citation2002a, Citation2002b), and air (Kumar Citation2001). Similarly, these pesticides have also been detected across the Canadian Prairie region (Rawn et al. Citation1999, Donald et al. Citation2001, Citation2007). Pesticide detection frequency and concentrations observed in this survey were generally lower than those reported for other studies of surface waters in Alberta (Anderson Citation2005), in part because the synoptic survey included mountainous areas with no agriculture or large urban centers (http://www.agr.gc.ca/atlas/aci/; Supplement S4); in those areas, only effluents contributed pesticides, and at low concentrations. In addition, samples collected directly from rivers tended to have fewer pesticides than effluents and tributaries, especially upstream from urban centers. Finally, most studies of pesticides in surface waters tend to be conducted beginning in early spring (May–Jun), whereas the synoptic survey was conducted in summer when pesticides such as 2,4-D and MCPA are predominantly used (Munira et al. Citation2018) but prior to pre-harvest pesticide applications. Pesticides most frequently detected in the synoptic survey followed a similar pattern to that reported in Anderson (Citation2005) for the period 1995–2002, with 2,4-D, mecoprop, dicamba, and clopyralid the most frequently detected pesticides. However, detection frequency of picloram, triclopyr, and bromoxynil was noticeably lower in the survey compared to that reported in Anderson (Citation2005), likely a reflection of Anderson's year-round sampling as opposed to summer only.
Pesticide occurrence in river subbasins
Both the Oldman and South Saskatchewan river subbasins are located in some of the most heavily farmed regions of southern Alberta, where diverse crops include specialty crops (Alberta Agriculture and Rural Development Citation2015) such as dry beans, potatoes, and sugar beets, followed by canola and alfalfa seed (Alberta Agriculture and Rural Development Citation2015). These crops may require more frequent pesticide applications, especially fungicides and insecticides, than cereal and forage crops. While insecticides (neonicotinoids) and fungicides are commonly used as seed treatments in canola and sugar beet, their peak concentrations tends to occur during the spring freshet due to snowmelt or following planting (Cook et al. Citation2018). Pesticide data in surface waters from New Brunswick, Nova Scotia, and Prince Edward Island, where potato acreages are significant, include almost no detection of 2,4-D, dicamba, mecoprop, and MCPA (Environment Canada Citation2011). However, similar to other studies in the Canadian Prairies (Donald et al. Citation2001, Anderson Citation2005), mostly herbicides were detected in this synoptic survey, likely a reflection of pesticide use in cereal and forage crops. Studies of the occurrence of pesticides and their degradation products in Midwestern United States streams over several decades until 2011 showed that herbicides from the triazine family (triazine, simazine) were most commonly detected (Nowell et al. Citation2018). These herbicides are used mostly on corn and soybeans (Baker and Stone Citation2013) as well as in urban settings. Application rates of the 4 herbicides most frequently detected in this survey for weed control in cereals, corn, and forage are similar, except for dicamba, which has an application rate on corn twice that of cereals (Crop Protection 2014; Alberta Agriculture and Rural Development Citation2014).
Anderson (Citation2005) reported higher detection frequencies than in this survey in each river subbasin except for the Bow River, ranging from slightly below 70% (Bow) to slightly above 80% (South Saskatchewan). The Bow River subbasin includes mountainous terrain not conducive to agricultural activities, and therefore overall pesticide use in that river basin is lower than its counterparts for all pesticides detected in this study (Supplement S4). The Red Deer River subbasin also includes mountainous terrain, along with cereal, forage, and oilseed production as well as confined animal feedlot operations. These agricultural activities also require pesticide use, but the drainage area of the Red Deer River subbasin is much larger than that of the other river subbasins included in the SSRB (Alberta Agriculture and Rural Affairs Citation2010) and has fewer irrigation districts and higher precipitation averages in August, which might have been contributing factors to lower detection frequencies. Nonetheless, some of the highest maximum concentrations of the entire synoptic survey were found in the Red Deer River subbasin (Supplement S6); high concentrations of 3 pesticides (2,4-D, dicamba, and mecoprop) were found in 2 effluent samples (1 municipal, 1 industrial) and therefore were not representative of the entire river subbasin. It is unclear why higher concentrations of pesticides were detected in these effluents.
The survey was conducted in August, and pesticide detection frequency per river subbasin differed markedly from that reported in Anderson (Citation2005) for the same month over the 1995–2002 period. Apart from yearly variations expected with environmental monitoring studies, conducting water sampling in a time-of-travel synoptic manner (as the water flows) will reduce variability due to daily fluctuations in effluent and mainstem chemistry and lead to differences in detection frequency compared with standard monitoring programs with preset dates of sampling such as monthly sampling. Similar time-of-travel surveys have been conducted in the United States (Brown et al. Citation2009, Barber et al. Citation2013, Weston et al. Citation2014) and Germany (Schwientek et al. Citation2016) to assess the environmental fate and transport of pollutants and determine their sources.
Pesticide occurrence in mainstem, tributary, and effluent samples
The synoptic survey revealed that effluents are significant contributors of pesticides to natural rivers and streams; not only did they provide the largest diversity of compounds () but also at the highest detection frequencies (b) and highest individual (Supplement S6) and total concentrations (data not shown). Effluent results further supported previously reported data regarding WWTP inefficiency in removing herbicides (Byrtus et al. Citation2004, Donald et al. Citation2007, Kerr et al. Citation2008, Piel et al. Citation2012).
Overall, effluents contributed more pesticides to receiving waterbodies and at higher concentrations. But pesticide detection frequency was generally lower in the mainstems downstream from where the effluents and tributaries merged with the river, indicating that water flow in the receiving waters was seemingly sufficient to dilute the contaminants (Supplement S2).
Pesticide occurrence in relation to land use
When land use (as combined vegetables, combined field crops) and watershed area over the SSRB was considered, significant correlations were established with total pesticide concentration. While municipal effluents were significant contributors of pesticides to the mainstems, percent land use designated as urban and developed was low over all watersheds and likely explains the absence of correlation with total pesticide concentration. Many of the samples with pesticides were located in the heavily agricultural areas of the Bow and Oldman subbasins (Supplement S2, S4), which were also in the irrigated areas of the province (Charest et al. Citation2015). A study of pesticide occurrence in the waters of the Júcar River in Spain found that the incidence of pesticides was strongly correlated with irrigation farming (Aguilar et al. Citation2017). Charest et al. (Citation2015) found pesticide results in Alberta's irrigation districts similar to those found in the present study. Overall, these results indicate that pesticide concentrations and detection frequencies are more related to agricultural activity in the SSRB, including irrigation. Similarly, studies in the United States have demonstrated that the presence of pesticides is significantly correlated with agriculture (Fairbairn et al. Citation2016) or agriculture and urban land use (Silvanima et al. Citation2018). However, such correlations in a mixed watershed can be weaker and not necessarily dependent on WWTP effluents (Fairbairn et al. Citation2016).
Pesticide loadings
The occurrence of pesticides was assessed in terms of loadings to mainstems (). While individual pesticide concentrations tended to be highest in WWTP effluents (b, Supplement S6), actual total loads of pesticides were highest in mainstems (downstream) because of the total volume of water in the rivers (). This phenomenon was most obvious where the Oldman River joined the Bow River to form the South Saskatchewan River, where the total pesticide load was additive. Increased loading of individual pesticides as the water flows downstream was also observed by Moody and Goolsby (Citation1993), whereas Fairbairn et al. (Citation2016) observed higher pesticide concentrations and loadings at upstream sites, especially in early summer when most pesticides are applied and rainfall events are frequent. Increases in mainstems cannot be solely explained by the data obtained from effluents and tributaries in some river reaches (i.e., cumulative load), likely because logistical constraints prevented the measurement of every input (e.g., municipal storm drains, natural coulees, deposition).
Seasonal detections in WWTP effluents
Higher pesticide detection frequency and concentrations in surface waters are expected during periods of applications, especially in agricultural areas. In southern Alberta, peak months of pesticide detections in surface waters are June and July (Anderson Citation2005, Derksen et al. Citation2015) while pesticide detection frequency and concentrations are lower in winter (Anderson Citation2005). However, whether water quality in WWTP effluents follows a similar pattern is not clear. As part of this synoptic survey, a subset of WWTP effluents sampled in August 2014 were resampled in February 2015. Pesticides were detected in those WWTP effluents in both August and February ().
The exact sources of pesticides in WWTP effluents are unknown, but the nature of the compounds detected indicated urban (residential) and agricultural contributions. Why or how pesticides occur in WWTP effluents in winter when pesticides are not being used is unclear, especially because the herbicides most frequently detected have short half-lives (2,4-D and mecoprop, 10 d or less) and are highly water soluble. A study by Kerr et al. (Citation2008) examined the removal efficiency of a WWTP facility by membrane ultrafiltration or activated carbon filtration. Removal efficiency of 2,4-D, dicamba, MCPA, and mecoprop was <60% by activated carbon filtration and practically nonexistent by membrane ultrafiltration (Kerr et al. Citation2008). Nitschke and Schussler (Citation1998) also reported the detection of pesticides in winter WWTP effluents, as have studies of pesticides in reservoirs and drinking water in the Canadian prairie region (Byrtus et al. Citation2004, Donald et al. Citation2007). Although water reservoirs are susceptible to pesticide contamination by atmospheric deposition and runoff, these sources of pesticides are less likely in WWTP effluents, especially during winter months.
Pesticide sales, occurrence, and physicochemical properties
Pesticide occurrence in surface waters is often a reflection of pesticide use in the surrounding area and therefore of land uses (Budd et al. Citation2007). As part of this study, pesticide sales estimates in each river subbasin were used as a surrogate for pesticide use (Supplement S8). The pesticides detected in the synoptic survey are among some of the most frequently used pesticides in southern Alberta, including 2,4-D, dicamba, MCPA, mecoprop, fluroxypyr, and clopyralid, all of which were sold in each of the river subbasins studied (Alberta Environment and Sustainable Resource Development Citation2015a).
Of the pesticides detected in the synoptic survey, 2,4-D was the active ingredient with the highest sales in all river subbasins, except in the Red Deer River subbasin, and was also the pesticide with the highest detection frequency in all river subbasins (Supplement S8). By contrast, another herbicide frequently used in all river subbasins (Alberta Environment and Sustainable Resource Development Citation2015a), bromoxynil, was detected in only 6.7% or fewer samples within each river subbasin (Supplement S8). Bromoxynil has a short field half-life (1 d), low solubility, and high log Koc (IUPAC Citation2013; Pesticide Properties Database), likely responsible for its lower detection frequency in each river basin. All herbicides detected in the synoptic survey are used post weed emergence, with only 2 that are also applied pre-emergence (bromacil and dichlobenil).
Pesticides with lower sales estimates per river subbasin all had low detection frequencies in each river subbasin or were not detected (Supplement S8). Pesticides with detection frequencies of <4% (dichlorprop, picloram, triclopyr, dichlobenil, atrazine, and bromacil) except bromoxynil are herbicides used to control weeds and brushes in non-crop areas such as industrial sites, railroads, and roadsides (Weed Science Society of America Citation1994) and likely did not arise from agricultural uses. Atrazine is also used for broadleaf weed control in maize (pre- and post-emergence) and was detected in the Oldman and South Saskatchewan river subbasins only, albeit at low detection frequency (). Similar results for atrazine were reported in Anderson (Citation2005). In southern Alberta, fresh corn (sweet corn) is mainly grown in irrigation districts of the Oldman River subbasin (Taber and St-Mary's Irrigation Districts, 1621 and 825 acres, respectively; Alberta Agriculture and Rural Development Citation2015), and this river subbasin had the highest sales of atrazine (Supplement S8). Estimated sales of atrazine in southern Alberta (78 301 kg active ingredient [a.i.]; Supplement S8) are high compared to those reported for Manitoba, Canada, in 2006 (∼25 000 kg, Wilson Citation2012). However, when considering the total surface area over which atrazine treatments might have been applied in both regions (>11 M ha in Alberta's SSRB vs. 17 000 ha in Manitoba), usage in Alberta is low. Yet, a median atrazine concentration of 24.3 ng/L was observed in Manitoba's Red River (Challis et al. Citation2018), significantly less than that detected in the present study (). Sales of atrazine in Canada in 2016 were >500 000 kg a.i. according to the Health Canada 2016 Pest Control Products Sales Report, and atrazine ranked 30th in total sales for all pesticides. While atrazine is no longer approved by the European Union (EU Pesticide database 2009), it is still being detected, albeit at low concentrations, in river waters (Aguilar et al. Citation2017). Results from the present study and those in Manitoba and Europe indicate that atrazine likely can persist in agricultural soils and the environment prior to being transported to river water, so its detection at low levels in water may not be necessarily indicative of current use.
Pesticide sales estimates at the provincial level for domestic, industrial, and municipal uses are not available. But estimates for the City of Calgary in 2013 showed that the residential use of pesticides was substantially higher than that for any other urban use (parks, golf courses, landscaping), and at substantially higher rates of application (Alberta Environment and Sustainable Resource Development Citation2015b). Mecoprop, 2,4-D, dicamba, and MCPA in particular were used in residential areas for weed control in turfgrass (Alberta Environment and Sustainable Resource Development Citation2015b). Other urban centers in the South Saskatchewan River Basin (Lethbridge, Red Deer, and Medicine Hat) likely have similar pesticide use patterns.
Pesticide physicochemical properties are factors that can impact detection frequency (Gassman et al. Citation2015). Pesticides detected most frequently (2,4-D, dicamba, MCPA, mecoprop, fluroxypyr, and clopyralid) have short half-lives (25 d or less) but high water solubility and large sales estimates (Supplement S8). These pesticides belong to the phenoxy (2,4-D, mecoprop, MCPA), benzoic acid (dicamba), and pyridine (fluroxypyr, clopyralid) families, which all have the same mode of action (auxin mimic; Grossman Citation2010). Three other herbicides with this mode of action were detected at lower detection frequency, including picloram (3%), dichlorprop (1%), and triclopyr (1%). In addition, 2,4-DCP is a degradation product of 2,4-D. The log Koc values for these compounds range from 0.7 to 2.0, so this property alone could not explain the detection frequencies observed. A study of 2,4-D and MCPA in river sediments collected from Manitoba showed high detection frequency (83%) and concentrations of MCPA, ranging from nondetected to 270 ng/kg, and lower detection frequency (25%) and levels of 2,4-D (maximum 28 ng/kg; Gamhewage et al. Citation2019).
As demonstrated in this study and several others previously conducted in Alberta, 2,4-D is extremely common in surface water throughout southern Alberta and the Canadian Prairie region (Rawn et al. Citation1999, Donald et al. Citation2001, Anderson Citation2005, Donald et al. Citation2007). One study looking at organic compounds in southeastern Alberta (Basiuk et al. Citation2017) did not often detect 2,4-D, likely because of the high analytical range (2–80 µg/L) of the ELISA used to perform analysis. In our study, with a quantification limit of 0.025 µg/L, 2,4-D's mean detected concentration was 0.230 µg/L, and detected concentrations ranged from 0.120 to 1.132 µg/L, well below the limit of detection of Basiuk et al. (Citation2017) for 2,4-D. Studies on the exposure of 2,4-D on insects (Freydier and Lundgren Citation2016), fish (DeQuattro and Karasov Citation2016, Guerrero-Estévez and López-López Citation2016), and human health (Morgan et al. Citation2008) highlighted some potential impacts of this herbicide, including beneficial insect mortality, reduced larval survival, and endocrine disruption. However, concentrations of 2,4-D and all other herbicides detected in this synoptic survey are well below the US Environmental Protection Agency's Aquatic Life Benchmarks for fish, aquatic invertebrates, and nonvascular plants (US EPA Citation2018). Evidence is lacking that concentrations of 2,4-D similar to those found in this study would impact human health (Garabrant and Philbert Citation2002, Burns and Swaen Citation2012). However, the presence of auxin herbicides in Alberta rainfall has shown potential effects on peas and lentils, which are commonly grown in Alberta (Hill et al. Citation2002a, Citation2002b). Atmospheric deposition is a likely contributor of pesticides to surface waters (Bailey et al. Citation2000, Donald et al. Citation2007). A study on the occurrence of pesticides in Alberta's ambient air conducted in 1999–2000 revealed that MCPA and bromoxynil were both detected in air collected from southern Alberta (Kumar Citation2001). However, atmospheric deposition of pesticides was not considered for this survey; its extent in the SSRB region is unknown and requires further investigation.
Conclusion
A synoptic survey was conducted in 4 separate river subbasins of the South Saskatchewan River Basin of southern Alberta and provided an insightful method to evaluate inputs of pesticides to the mainstem rivers during low-flow conditions. Results indicated that pesticides were detected in all watersheds, with effluents and tributaries contributing pesticides to the mainstem rivers. Samples collected at sites along the 4 rivers located farther downstream from headwaters typically showed higher pesticide detection levels and total pesticide loads compared to upstream sites, demonstrating that rivers gain pesticides as they flow downstream through both urban and agricultural land. Total pesticide concentrations were significantly correlated with agricultural land use. Pesticides found reflected urban, industrial, and agricultural sources and were present in effluents in both summer and winter. While the intention of the study was to evaluate cumulative inputs on mainstem water quality during low-flow conditions, repeating the synoptic survey during peak pesticide use periods would be interesting to evaluate if a stronger relationship exists between agricultural land use and pesticide occurrence.
The synoptic survey highlighted the prevalence of 2,4-D at the whole watershed scale. Because 2,4-D use is expected to rise (Freydier and Lundgren Citation2016), the widespread occurrence of 2,4-D in southern Alberta rivers and streams should be taken into consideration for future pesticide monitoring programs. Several other herbicides with a similar mode of action to that of 2,4-D and relatively high water solubility have been detected frequently in this study, including dicamba, MCPA, mecoprop, and clopyralid. The environmental effect of mixtures of phenoxy herbicides remains largely unknown. Finally, further studies including year-round sampling of rivers, WWTP effluents, tributaries, stormwater, drinking water treatment plants, and atmospheric deposition should be considered to better understand the fate and transport of pesticides in natural, urban, and agricultural waters.
Supplemental Material - Figure S2
Download PDF (1.9 MB)Supplemental Material
Download MS Word (8 MB)Acknowledgements
The authors thank Ray Walker, Rachel Morse, James Zettel, Meghan Anderson, Tori Slobodzian, Jay Parsons, Jon Pedlar, Kate Forbes, Dennis Rollag, Mark Potvin, James Rogans, David Clarke, Valerie Brown, Wendell Koning, and Cecilia Chung for sample collection. Credit goes to Werner Herrera, Kunyu Zheng, Shoma Tanzeeba, Terry Chamulak, and Adithya Selvaraju for time-of-travel hydrology calculations and flow estimations. Tara Vucurevich, Scott Spengler, Ryan Kung, Kyo Farrington, and Monique Dawson are acknowledged for sample extraction and processing. We thank Madison Kobryn for assistance with SAS statistical analyses. Janelle Villeneuve is acknowledged for technical support. Funding for this research project was provided by AEP and Agriculture and Agri-Food Canada. Finally, the authors thank the reviewers for their comments and suggestions.
Disclosure statement
No potential conflict of interest was reported by the authors.
References
- Aguilar JAP, Andreu V, Campo J, Picó Y, Masiá A. 2017. Pesticide occurrence in the waters of Jucar River, Spain for different farming landscapes. Sci Total Environ. 607–608:752–760. doi: 10.1016/j.scitotenv.2017.06.176
- Alavanja MCR. 2009. Pesticide use and exposure extensive worldwide. Rev Environ Health. 24:303–309. doi: 10.1515/REVEH.2009.24.4.303
- Alberta Agriculture and Rural Development. 2010. South Saskatchewan River Basin water supply study summary. http://www1.agric.gov.ab.ca/$Department/deptdocs.nsf/all/irr13053/$FILE/ssrb2010.pdf
- Alberta Agriculture and Rural Development. 2014. Crop Protection 2014. Edmonton (AB): Information Management Division; 540 p.
- Alberta Agriculture and Rural Development. 2015. Agriculture statistics factsheet. Agdex 853. Edmonton, (AB): Canada Economics and Competitiveness Division, Alberta Agriculture and Forestry; 2 p.
- Alberta Environment. 2006. Aquatic ecosystems field sampling protocols. Edmonton (AB): Alberta Environment. https://open.alberta.ca/dataset/8bbadf46-6795-42b5-8324-f49b38bed799/resource/ce758929-5564-42e4-b7c7-fed08994afcb/download/7805.pdf
- Alberta Environment and Sustainable Resource Development. 2015a. Overview of 2013 pesticide sales in Alberta. Edmonton (AB): Land Policy Branch. http://aep.alberta.ca/lands-forests/land-industrial/programs-and-services/pesticide-management/pesticide-sales/documents/Overview2013PesticideSales-Aug-2015.pdf
- Alberta Environment and Sustainable Resource Development. 2015b. Urban pesticide use estimates: City of Calgary 2013 data. Prepared by the Policy Division; 6 p.
- Anderson A-M. 2005. Overview of pesticide data in Alberta’s surface waters since 1995. Alberta. Edmonton (AB): Alberta Environment; 179 p. http://aep.alberta.ca/water/programs-and-services/surface-water-quality-program/documents/PesticideDataAlbertaSurfaceWater-Nov2005.pdf
- Anesio AHC, Santos MV, Silveira RR, Ferreira EA, Dos Santos JB, Da Silva LD. 2018. Persistence of auxinic herbicides applied on pasture and toxicity for succeeding crops. Ann Braz Acad Sci. 90:1717–1732. doi: 10.1590/0001-3765201820170134
- Bailey HC, Deanovic L, Reves E, Kimbali T, Larson K, Cortright K, Connor V, Hinton DE. 2000. Diazinon and chlorpyrifos in urban waterways in Northern California, USA. Environ Toxicol Chem. 19:82–87. doi: 10.1002/etc.5620190109
- Baker NT, Stone WW. 2013. Preliminary estimates of annual agricultural pesticide use for counties of the conterminous United States, 2010–11: U.S. Geological Survey Open-File Report, 2-p. pamphlet, 14 tables. http://dx/doi.org/10.3133/ofr20131295
- Barber LB, Keefe SH, Kolpin DW, Schnoebelen DJ, Flynn JL, Brown GK, Furlong ET, Glassmeyer ST, Gray JL, Meyer MT, et al. 2011. Lagrangian sampling of wastewater treatment plant effluent in Boulder Creek, Colorado, and Fourmile Creek, Iowa, during the summer of 2003 and spring of 2005—Hydrological and chemical data: US Geological Survey Open-File Report 2011–1054; 84 p.
- Barber LB, Keefe SH, Brown GK, Furlong ET, Gray JL, Kolpin DW, Meyer MT, Sandstrom MW, Zaugg SD. 2013. Persistence and potential effects of complex organic contaminant mixtures in wastewater-impacted streams. Environ Sci Technol. 47:2177–2188. doi: 10.1021/es303720g
- Basiuk M, Brown RA, Cartwright D, Davison R, Wallis PM. 2017. Trace organic compounds in rivers, streams, and wastewater in southeastern Alberta, Canada. Inland Waters. 7:283–296. doi: 10.1080/20442041.2017.1329908
- Blanchoud H, Farrugia F, Mouchel JM. 2004. Pesticide uses and transfers in urbanised catchments. Chemosphere. 55:905–913. doi: 10.1016/j.chemosphere.2003.11.061
- Brown JB, Battaglin WA, Zuellig RE. 2009. Lagrangian sampling for emerging contaminants through an urban stream corridor in Colorado. J Am Water Res As. 45:68–82. doi: 10.1111/j.1752-1688.2008.00290.x
- Budd R, Bondarenko S, Haver D, Kabashima J, Gan J. 2007. Occurrence and bioavailability of pyrethroids in a mixed land use watershed. J Environ Qual. 36:1006–1012. doi: 10.2134/jeq2006.0249
- Burkhardt M, Kupper T, Hean S, Haag R, Schmid P, Kohler M, Boller M. 2007. Biocides used in building materials and their leaching behavior in sewer systems. Water Sci Technol. 56:63–67. doi: 10.2166/wst.2007.807
- Burns CJ, Swaen GMH. 2012. Review of 2,4-dichlorophenoxyacetic acid (2,4-D) biomonitoring and epidemiology. Critical Rev Toxicol. 42:768–786. doi: 10.3109/10408444.2012.710576
- Byrtus G, Anderson A-M, Saffran K, Bruns G, Checknita L. 2002. Determination of new pesticides in Alberta’s surface waters (1999-2000). Alberta Environment publication No. T/674. Edmonton; 22 p.
- Byrtus G, Pongar K, Browning C, Burland R, McGuinness E, Humphries D. 2004. A summary of pesticide residues from the Alberta Treated Water Survey, 1995-2003. Edmonton (AB): Alberta Environment, Environmental Assurance Service; 57 p.
- Cahill MG, Caprioli G, Stack M, Vittori S, James KJ. 2011. Semi-automated liquid chromatography-mass spectrometry (LC-MS/MS) method for basic pesticides in wastewater effluents. Anal Bioanal Chem. 400:587–594. doi: 10.1007/s00216-011-4781-1
- [CCME] Canadian Council of Ministers of the Environment. 2005. Canadian water quality guidelines for protection of agricultural water uses: summary table. Updated October 2005. In: Canadian environmental quality guidelines, 1999. Winnipeg (MB): Canadian Council of Ministers of the Environment.
- Capesius JP, Stephens VC. 2009. Regional regression equations for estimation of natural streamflow statistics in Colorado: US Geological Survey Scientific Investigations Report 2009–5136; 46 p.
- Carpenter KD, Kuivila KM, Hladik ML, Haluska T, Cole MB. 2016. Storm-event transport of urban-use pesticides to streams likely impairs invertebrate assemblages. Environ Monit Assess. 188:345. doi: 10.1007/s10661-016-5215-5
- Challis JK, Cuscito LD, Joudan S, Luong KH, Knapp CW, Hanson ML, Wong CS. 2018. Inputs, source appointment, and transbounderary transport of pesticides and other polar organic contaminants along the lower Red River, Manitoba, Canada. Sci Total Environ. 635:803–816. doi: 10.1016/j.scitotenv.2018.04.128
- Charest J, Olson B, Kalischuk A, Gross D, editors. 2015. Water quality in Alberta’s irrigation districts 2011 to 2015: 2014 progress report. Lethbridge (AB): Alberta Agriculture and Forestry; 215 p.
- Cook SR, Kerr JL, Kobryn M, Piorkowski G, Zuzak K, Olson BM, Pekrul M, Feindel D, Kalischuk A. 2018. Neonicotinoids in surface water from Alberta’s agricultural areas: 2018 report. Lethbridge (AB): Alberta Agriculture and Forestry.
- DeQuattro ZA, Karasov WH. 2016. Impacts of 2,4-dichlorophenoxyacteic acid aquatic herbicide formulations on reproduction and development of the fathead minnow (Pimephales promelas). Environ Toxicol Chem. 35:1478–1488. doi: 10.1002/etc.3293
- Derksen J, Inglis GD, Sheedy C. 2015. Lethbridge storm water outfalls monitoring study, microbiological, pesticides and nutrients analysis (2012-2014). Lethbridge (AB): Oldman Watershed Council; 78 p.
- Donald DB, Cessna AJ, Sverko E, Glozier NE. 2007. Pesticides in surface drinking-water supplies of the Northern Great Plains. Environ Health Perspect. 115:1183–1191. doi: 10.1289/ehp.9435
- Donald DB, Gurprasad NP, Quinnett-Abbott L, Cash K. 2001. Diffuse geographic distribution of herbicides in northern prairie wetlands. Environ Toxicol Chem. 20:273–279. doi: 10.1002/etc.5620200207
- Emerson DG, Vecchia AV, Dahl AL. 2005. Evaluation of drainage-area ratio method used to estimate streamflow for the Red River of the North Basin, North Dakota and Minnesota: US Geological Survey Scientific Investigations Report 2005–5017; 13 p.
- Ensminger MP, Budd R, Kelley KC, Goh KS. 2013. Pesticide occurrence and aquatic benchmark exceedances in urban surface waters and sediments in three urban areas of California, USA, 2008–2011. Environ Monit Assess. 185:3697–3710. doi: 10.1007/s10661-012-2821-8
- Environment Canada. 2011. Presence and levels of priority pesticides in selected Canadian aquatic ecosystems. Water Science and Technology Directorate; 8 p.
- Fairbairn DJ, Karpuzcu ME, Arnold WA, Barber BL, Kaufenberg EF, Koskinen WC, Novak PJ, Rice PJ, Swackhamer DL. 2016. Sources and transport of contaminants of emerging concern: a two-year study of occurrence and spatiotemporal variation in a mixed land use watershed. Sci Total Environ. 551–552:605–613. doi: 10.1016/j.scitotenv.2016.02.056
- Freydier L, Lundgren JG. 2016. Unintended effects of the herbicides 2,4-D and dicamba on lady beetles. Ecotoxicology. 25:1270–1277. doi: 10.1007/s10646-016-1680-4
- Gagnon P, Sheedy C, Farenhorst A, McQueen RDA, Cessna AJ, Newlands NK. 2014. A coupled stochastic/deterministic model to estimate the evolution of the risk of water contamination by pesticides across Canada. Integr Environ Assess Manag. 10(3):429–436. doi: 10.1002/ieam.1533
- Gagnon P, Sheedy C, Farenhorst A, Cessna AJ, Newlands NK, McQueen RDA. 2016. Pesticides. In: Clearwater RL, Martin T, Hoppe T, editors. Environmental sustainability of Canadian agriculture: agri-environmental indicator report series Report #4, Agriculture and Agri-Food Canada, Chapter 14; p. 153–165. http://publications.gc.ca/collections/collection_2016/aac-aafc/A22-201-2016-eng.pdf
- Gamhewage M, Farenhorst A, Sheedy C. 2019. Phenoxy herbicides interactions with river bottom sediments. Sediments. doi: 10.1007/s11368-019-02339-x
- Garabrant DH, Philbert MA. 2002. Review of 2,4-dichlorophenoxyacetic acid (2,4-D) epidemiology and toxicology. Crit Rev Toxicol. 32:233–257. doi: 10.1080/20024091064237
- Gasperi J, Sebastian C, Ruban V, Delamain M, Percot S, Wiest L, Mirande C, Caupos E, Demare D, Diallo Kessoo Kessoo M, et al. 2014. Micropollutants in urban stormwater: occurrence, concentrations, and atmospheric contributions for a wide range of contaminants in three French catchments. Environ Sci Pollut Res. 21:5267–5281. doi: 10.1007/s11356-013-2396-0
- Gassman M, Olsson O, Stamm C, Weiler M, Kummerer K. 2015. Physico-chemical characteristics affect the spatial distribution of pesticide and transformation product loss to an agricultural brook. Sci Total Env. 532:733–743. doi: 10.1016/j.scitotenv.2015.06.068
- Gerecke AC, Schärer M, Singer HP, Müller SR, Scharzenbach RP, Sägesser M, Ochsenbein U, Popow G. 2002. Sources of pesticides in surface waters in Switzerland: pesticide load through waste water treatment plants-current situation and reduction potential. Chemosphere. 48:307–315. doi: 10.1016/S0045-6535(02)00080-2
- Grossman K. 2010. Auxin herbicides: current status of mechanism and mode of action. Pest Manag Sci. 66:113–120.
- Guerrero-Estévez SM, López-López E. 2016. Effects of endocrine disruptors on reproduction in viviparous teleosts with intraluminal gestation. Rev Fish Biol Fish. 26:563–587. doi: 10.1007/s11160-016-9443-0
- Health Canada. 2014. Pest control products sales report for 2014. Ottawa. https://www.canada.ca/en/health-canada/services/consumer-product-safety/reports-publications/pesticides-pest-management/corporate-plans-reports/pest-control-products-sales-report-2014.html
- Hill BD, Harker KN, Hasselback P, Inaba DJ, Byers SD, Moyer JR. 2002a. Herbicides in Alberta rainfall as affected by location, use and season: 1999 to 2000. Water Qual Res J. 37:515–542. doi: 10.2166/wqrj.2002.035
- Hill BD, Harker KN, Hasselback P, Moyer JR, Inaba DJ, Byers SD. 2002b. Phenoxy herbicides in Alberta rainfall: potential effects on sensitive crops. Can J Plant Sci. 82:481–484. doi: 10.4141/P01-136
- Hladik ML, Domagalski JL, Kuivila KM. 2009. Concentrations and loads of suspended sediment-associated pesticides in the San Joaquin River, California and tributaries during storm events. Sci Total Environ. 408:356–364. doi: 10.1016/j.scitotenv.2009.09.040
- Hoffman RS, Capel PD, Larson SJ. 2000. Comparison of pesticides in eight U.S. urban streams. Environ Toxicol Chem. 19:2249–2258. doi: 10.1002/etc.5620190915
- [IUPAC] International Union of Pure and Applied Chemistry. 2013. Pesticide properties database online. http://sitem.herts.ac.uk/aeru/iupac/atoz.htm.
- Iwanyshyn M, Ryan MC, Chu A. 2008. Separation of physical loading from photosynthesis/respiration processes in rivers by mass balance. Sci Total Environ. 390:205–214. doi: 10.1016/j.scitotenv.2007.09.038
- JMP. 1989–2007. Version 14.0.0. Cary (NC): SAS Institute Inc.
- Johnson HM, Domagalski JL, Saleh DK. 2011. Trends in pesticide concentrations in streams of the Western United States, 1993–2005. J Am Water Resour Assoc. 47:265–286.
- Kerr JL, Guo Z, Smith DW, Goss GG, Belosevic M. 2008. Use of goldfish to monitor wastewater and reuse water for xenobiotics. J Environ Eng Sci. 7:369–383. doi: 10.1139/S08-011
- Kimbrough RA, Litke DW. 1996. Pesticides in streams draining agricultural and urban areas in Colorado. Environ Sci Technol. 30:908–916. doi: 10.1021/es950353b
- Kock-Schulmeyer M, Villagrasa M, de Alda M L, Céspedes-Sánchez R, Ventura F, Barceló D. 2013. Occurrence and behavior of pesticides in wastewater treatment plants and their environmental impact. Sci Total Environ. 458–460:466–476. doi: 10.1016/j.scitotenv.2013.04.010
- Kumar Y. 2001. Pesticides in ambient air in Alberta. ISBN 0-7785-1889-4. Report prepared for the Air Research Users Group. Edmonton (AB): Alberta Environment.
- Lammoglia SK, Kennedy MC, Barriuso E, Alletto L, Justes E, Munier-Jolain N, Mamy L. 2017. Assessing human health risks from pesticide use in conventional and innovative cropping systems with the BROWSE model. Environ Int. 105:66–78. doi: 10.1016/j.envint.2017.04.012
- López-Doval JC, Montagner CC, de Alburquerque AF, Moschini-Carlos V, Umbuzeiro G, Pompêo M. 2017. Nutrients, emerging pollutants and pesticides in a tropical urban reservoir: spatial distributions and risk assessment. Sci Total Environ. 575:1307–1324. doi: 10.1016/j.scitotenv.2016.09.210
- Meade RH, Stevens HH. 1990. Strategies and equipment for sampling suspended sediment and associated toxic chemicals in large rivers – with emphasis on the Mississippi River. Sci Total Environ. 97–98:125–135. doi: 10.1016/0048-9697(90)90235-M
- Metcalfe RA, Chang C, Smakhtin V. 2005. Tools to support the implementation of environmentally sustainable flow regimes at Ontario’s waterpower facilities. Can Water Resour J. 30:97–110. doi: 10.4296/cwrj3002097
- Monteith HD, Parker WJ, Bell JP, Melcer H. 1995. Modeling the fate of pesticides in municipal wastewater treatment. Water Environ Res. 67:964–970. doi: 10.2175/106143095X133194
- Moody JA, Goolsby DA. 1993. Spatial variability of triazine herbicides in the lower Mississippi River. Environ Sci Technol. 27:2120–2126. doi: 10.1021/es00047a018
- Morgan MK, Sheldon LS, Thomas KW, Egeghy PP, Croghan CW, Jones PA, Chuang JC, Wilson NK. 2008. Adult and children’s exposure to 2,4-D from multiple sources and pathways. J Expo Sci Environ Epidemiol. 18:486–494. doi: 10.1038/sj.jes.7500641
- Munira S, Farenhorst A, Sapkota K, Nilsson D, Sheedy C. 2018. Auxin herbicides and pesticide mixtures in groundwater of a Canadian Prairie province. J Environ Qual. 47(6):1462–1467. doi: 10.2134/jeq2018.05.0202
- Nitschke L, Schussler W. 1998. Surface water pollution by herbicides from effluents of waste water treatment plants. Chemosphere. 36:35–41. doi: 10.1016/S0045-6535(97)00286-5
- Nowell LH, Moran PW, Schmidt TS, Norman JE, Nakagaki N, Shoda ME, Mahler BJ, Van Metre PC, Stone WW, Sandstrom MW, Hladik ML. 2018. Complex mixtures of dissolved pesticides show potential aquatic toxicity in a synoptic study of Midwestern U.S. streams. Sci Total Environ. 613–614:1469–1488. doi: 10.1016/j.scitotenv.2017.06.156
- Phelan C. 2012. Pesticides in Alberta’s agricultural watersheds: a synthesis. Edmonton (AB): Alberta Agriculture and Rural Development.
- Phillips PJ, Bode RW. 2004. Pesticides in surface water runoff in south-eastern New York State, USA: seasonal and stormflow effects on concentrations. Pest Manag Sci. 60:531–543. doi: 10.1002/ps.879
- Piel S, Baurès E, Thomas O. 2012. Contribution to surface water contamination understanding by pesticides and pharmaceuticals, at a watershed scale. Int J Environ Res Public Health. 9:4433–4451. doi: 10.3390/ijerph9124433
- Rawn DFK, Halldorson THJ, Lawson BD, Muir DCG. 1999. A multi-year study of four herbicides in air and precipitation from a small prairie watershed. J Environ Qual. 28:898–906. doi: 10.2134/jeq1999.00472425002800030022x
- Rippy MA, Deletic A, Black J, Aryal R, Lampard J-L, Tang JY-M, McCarthy D, Kolotelo P, Sidhu J, Gernjak W. 2017. Pesticide occurrence and spatio-temporal variability in urban run-off across Australia. Water Res. 115:245–255. doi: 10.1016/j.watres.2017.03.010
- Ross LJ, Stein R, Hsu J, White J, Hefner K. 1996. Distribution and mass loading of insecticides in the San Joaquin River, California: environmental hazards assessment program, environmental monitoring and pest management branch, Department of Pesticide Regulation. Sacramento, California Report EH 96-06; 3 p.
- Saffran KA. 2005. Oldman River Basin water quality initiative surface water quality summary report April 1998 – March 2003.
- SAS Institute Inc. 2017. The SAS system for windows, version 9.4. Cary (NC): SAS Institute.
- Schwientek M, Guillet G, Rugner H, Kuch B, Grathwohl P. 2016. A high-precision sampling scheme to assess persistence and transport characteristics of micropollutants to rivers. Sci Total Environ. 540:444–454. doi: 10.1016/j.scitotenv.2015.07.135
- Silvanima J, Woeber A, Sunderman-Barnes S, Copeland R, Sedlacek C, Seal T. 2018. A synoptic survey of selecte wastewater-tracer compounds and the pesticide imidacloprid in Florida’s ambient freshwaters. Environ Monit Assess. 190:435. doi: 10.1007/s10661-018-6782-4
- Smakhtin VU, Shilpakar RL. 2005. Planning for environmental water allocations: an example of hydrology-based assessment in the East Rapti River, Nepal. Research Report 89. Colombo (Sri Lanka): International Water Management Institute.
- University of Hertfordshire. 2013. The Pesticide Properties DataBase (PPDB) developed by the Agriculture and Environment Research Unit (AERU), University of Hertfordshire, funded by UK national sources and through EU-funded projects, 2006–2013.
- US Army Corps of Engineers. 1991. User manual SSARR model streamflow synthesis and reservoir regulation. Portland (OR): North Pacific Division.
- [US EPA] US Environmental Protection Agency. 2018. https://www.epa.gov/pesticide-science-and-assessing-pesticide-risks/aquatic-life-benchmarks-and-ecological-risk
- Weed Science Society of America. 1994. Herbicide handbook seventh edition. Champaign (IL): Weed Science Society of America.
- Weston DP, Asbell AM, Lesmeister SA, The SJ, Lydy MJ. 2014. Urban and agricultural pesticide inputs to a critical habitat for the threatened delta smelt (Hypomesus transpacificus). Environ Toxicol Chem. 33:920–929. doi: 10.1002/etc.2512
- Wilson J. 2012. Agricultural pesticide use trends in Manitoba and 2,4-D fate in soil [dissertation]. Winnipeg (MB): University of Manitoba.
- Wittmer IK, Bader HP, Scheidegger R, Singer H, Luck A, Hanke I, Carlsson C, Stamm C. 2010. Significance of urban and agricultural land use for biocide and pesticide dynamics in surface waters. Water Res. 44:2850–2862. doi: 10.1016/j.watres.2010.01.030
- Wittmer IK, Scheidegger R, Bader HP, Singer H, Stamm C. 2011. Loss rates of urban biocides can exceed those of agricultural pesticides. Sci Total Environ. 409:920–932. doi: 10.1016/j.scitotenv.2010.11.031
- Wynn KH, Spahr NE. 1998. Low-flow water-quality characterization of the Gore Creek watershed, Upper Colorado River Basin, Colorado, August 1996: US Geological Survey Fact Sheet FS-160-97; 4 p.