
 ?Mathematical formulae have been encoded as MathML and are displayed in this HTML version using MathJax in order to improve their display. Uncheck the box to turn MathJax off. This feature requires Javascript. Click on a formula to zoom.
ABSTRACT
The advent of climate change has placed aquatic ecosystems at risk for potential declines in water quality, including an increase in the number of lakes experiencing substantial dissolved oxygen (O2) depletion. Through its influence on the thermal structure of lakes via elevated water temperatures and alterations in stratification phenology, climate change intensifies biogeochemical and ecological processes involved in O2 consumption, giving rise to conditions like hypoxia/anoxia. However, predicting O2 dynamics is difficult, with in situ O2 depletion rates showing considerable lake-dependent variability, underpinned by distinct underlying mechanisms. Our study attempts to overcome these lake-specific features and targets distilling key components of O2 depletion into a simple and transferable conceptual model applicable across a diverse array of lakes and at large scales. Using O2 depletion rates from literature reflecting variability in trophic state, we quantified the typical O2 depletion rate ranges for oligotrophic, mesotrophic, and eutrophic lakes and assessed their temperature sensitivity for a broader climate impact assessment. Our model gave reasonable estimates for O2 depletion and risks of anoxia through 3 explanatory variables: trophic state, stratification duration, and hypolimnion temperature. We validated our model predictions using data from 5 German lakes and assessed the relative importance of the 3 influencing factors. This easy-to-use approach has potential for lake management to attain rapid assessments of possible future problems with O2 dynamics in a given lake, even in the absence of in situ data. Moreover, it allows scaling of O2 dynamics continentally/globally without lake-specific hydrological or morphological details.
Introduction
Dissolved oxygen (O2) is a crucial component of aquatic environments that governs the functions of ecosystems (Wetzel Citation2001). The reliance on dissolved O2 by biological (Spoor Citation1990, Plumb and Blanchfield Citation2009) and biogeochemical processes (North et al. Citation2014) occurring in lakes has long been viewed as a fundamental aspect in limnology (Hutchinson Citation1957), thus highlighting the importance of this critical parameter in lake water quality and management (European Commission Citation2000, Cooke et al. Citation2016). However, bottom water deoxygenation, documented in recent studies (Jones et al. Citation2008, Jenny et al. Citation2016, Jane et al. Citation2021), detrimentally affects aquatic biodiversity (Marcus Citation2001, Pollock et al. Citation2007, Jones et al. Citation2008), potentially increasing both greenhouse gas emissions (Encinas Fernández et al. Citation2014, Marotta et al. Citation2014) and internal nutrient loading (Brothers et al. Citation2014, North et al. Citation2014). Consequently, dissolved O2 thresholds have been widely adopted to describe critical concentrations for bottom waters (Vaquer-Sunyer and Duarte Citation2008). The definition of such threshold values depends on their context in management strategies and intended human water uses (Nürnberg Citation2002). For example, dissolved O2 concentrations in lake hypolimnia are said to foster detrimental biogeochemical developments when <0.5 mg L−1 (anoxic; Encinas Fernández et al. Citation2014, North et al. Citation2014, Jane et al. Citation2022), be unsuitable for a majority of fish species when <2.0 mg L−1 (hypoxic; Turner et al. Citation2005, Vaquer-Sunyer and Duarte Citation2008, Roberts et al. Citation2009), and be uninhabitable for cold-dwelling trout species when <5.0 mg L−1 (Spoor Citation1990).
In monomictic and dimictic lakes, climate change manifests its influence on O2 dynamics through multiple process chains involving its effects on lake stratification, vertical mixing processes, and biogeochemical processing. During stratification, the distinct detachment between the epilimnion and the hypolimnion render the latter inaccessible to atmospheric exchange, therefore restricting its O2 replenishment (Livingstone Citation2003, Jankowski et al. Citation2006, Boehrer and Schultze Citation2008, Woolway and Merchant Citation2019). Climate warming leads to milder winters (Livingstone Citation1997, Straile et al. Citation2003), warmer lakes (Woolway et al. Citation2020), and enhanced thermal stability (Kraemer et al. Citation2015, Pilla et al. Citation2020), with dire consequences for hypolimnetic O2 concentrations (Fang and Stefan Citation2009, Mi et al. Citation2020, Woolway et al. Citation2021). Long-term studies have shown that stratification phenology in individual lakes is altered (Livingstone Citation2003, Coats et al. Citation2006, Foley et al. Citation2012), starting earlier and ending later than previously observed (Foley et al. Citation2012), therefore prolonging the duration of O2 depletion. Thus, with a prolonged stratified period (Adrian et al. Citation1995) and lower chances of O2 replenishment during the shortened spring mixing timeframe (Pilla and Williamson Citation2022), lakes can be exposed to critical O2 thresholds (Van Bocxlaer et al. Citation2012, North et al. Citation2014, Palmer et al. Citation2014). However, the effects of stratification phenology on O2 concentrations are lake specific, influenced by morphometry (Livingstone and Imboden Citation1996), hypolimnion temperatures, local climate, and trophic characteristics (Rippey and McSorley Citation2009, Rhodes et al. Citation2017).
Trophic characteristics of a lake not only directly influence O2 depletion rates, with higher depletion occurring in more eutrophic waters (Steinsberger et al. Citation2020), they are also predicted to be indirectly affected by climate change (Moss et al. Citation2011, Trolle et al. Citation2011, Kong et al. Citation2022). For example, climate warming-induced changes to precipitation patterns and evaporation rates (Huntington Citation2006, Knutti and Sedláček Citation2013) may result in altered watershed hydrological processes, thus heightening external nutrient loading (Jeppesen et al. Citation2009, Carey et al. Citation2012) or accelerating internal nutrient loading by intensifying sediment release (North et al. Citation2014). In general, eutrophication of lake systems is closely associated with anthropogenic activities, driving increased nutrient inputs (Jeppesen et al. Citation2009, Gregersen et al. Citation2022) into aquatic systems stemming from industrialization, agricultural intensification, and urbanization (Dubois et al. Citation2018). Ultimately, these human pressures have led to increased productivity in lake epilimnia (Maheaux et al. Citation2016, Beaulieu et al. Citation2019, Gregersen et al. Citation2022), resulting in heightened hypolimnetic O2 demand (HOD) for organic matter decomposition (Moss et al. Citation2011).
Lake trophic status is well represented by hypolimnetic O2 consumption (Borowiak et al. Citation2011, Steinsberger et al. Citation2021), and widely accepted frameworks for determining HOD related to lake trophy include the areal hypolimnetic O2 depletion rate (AHOD; Lasenby Citation1975, Beutel Citation2003, Matthews and Effler Citation2006) and volumetric hypolimnetic O2 depletion rate (VHOD; Rosa and Burns Citation1987, LaBounty and Burns Citation2007). Previous models of O2 depletion required detailed O2 measurements for parameterization and were lake-specific (Couture et al. Citation2015). However, implementing the interactions of trophic characteristics and climate change on hypolimnetic O2 depletion dynamics in a transferable, simple predictive tool is advantageous for multi-lake applications and is needed for upscaling studies targeted at continental/global scales. Therefore, a simple approach integrating water temperature increases, prolonged stratification, and trophic state effects is crucial to quickly and universally assess the climate-driven pressures on hypolimnetic O2 concentrations and the threat of hypoxia/anoxia, without requiring extensive local data.
Many existing ecological models for lake O2 dynamics are complex and lack the required ease of use for widespread applications in lake management and global-scale studies. Hence, this study aimed to formulate a simple O2 depletion model in lake hypolimnia, emphasizing trophic characteristics, hypolimnetic temperatures, and stratification duration effects. The model parameters were identified from a literature survey and have a solid empirical basis. We also validated our model using independent data from yearly observations in 5 German lakes with varying stratification regimes, hypolimnion temperatures, and trophic statuses. Furthermore, we implemented the model on actual lake systems by utilizing data from 13 German lakes. Subsequently, we assessed the sensitivity of the model by examining the interplay of trophic state, hypolimnion temperature, and the duration of stratification in attaining critical O2 thresholds.
Methods
Literature survey on O2 depletion data
To obtain realistic VHOD rates for our O2 depletion model we conducted a literature search of empirical VHOD rates from previous studies. For this, we used search terms VHOD, HOD, oxygen depletion, and hypolimnion oxygen rate to find peer reviewed articles through the Google Scholar electronic database (https://scholar.google.com/). The lake VHOD rates obtained from these search terms, after inspection of the detected publications, are denoted as method A (). For most lakes, VHOD rates were reported according to the year the field measurements were performed, and as such, the individual yearly VHOD rates of a lake were treated as independent from one another. This approach is justified because our dataset lacks oligomictic lakes, ensuring complete annual mixing, and thus, subsequent years remain uninfluenced by prior years. When VHOD rates were given as a range, we derived the median of that range as a suitable rate to represent the study.
Table 1. Empirical estimates of VHOD rates obtained from literature for corresponding lakes, years, and trophic status.
The VHOD rates obtained from the literature search were further supplemented by applying conversions of areal hypolimnetic O2 depletion (AHOD) rates of lakes (Cornett Citation1982) into VHOD rates. Here, we retrieved VHOD rates by dividing the individual AHOD rates of each lake by their corresponding mean hypolimnion thickness values, , using equation 1:
(1)
(1) VHOD rates for lakes acquired through equation 1 are denoted as method B ().
Furthermore, we modified the O2 depletion rates established for both Lake Aegeri (Livingstone and Imboden Citation1996) and Lake Constance (Rhodes et al. Citation2017), which were in the form of the Livingstone and Imboden devised morphometry-based O2 depletion model (Livingstone and Imboden Citation1996), to obtain their VHOD rates. This process involved retrieving the area of the whole hypolimnion of each lake from the upper boundary of the hypolimnion, (Imboden Citation1973, Imboden and Joller Citation1984):
(2)
(2) where
represents the lake surface area,
the depth of the upper boundary of the hypolimnion,
the maximum depth of the lake, and a nondimensional exponent
(0.73) as explained in Livingstone and Imboden (Citation1996). With the values of the area of hypolimnion from both lakes, the calculation of the hypolimnetic volume,
, of each lake was conducted by multiplying
by
:
(3)
(3) Using the reported volumetric and areal O2 consumption rates associated with the pelagic zone,
, and the benthic zone,
, respectively, of both lakes (Livingstone and Imboden Citation1996, Rhodes et al. Citation2017), we calculated the VHOD rates for each respective lake:
(4)
(4) One
value (3.9 g O2 m−3 yr−1) and 2
values (47 g O2 m−2 yr−1 corresponded with 1950–1951 and 113 g O2 m−2 yr−1 with 1968–1983) for mesotrophic Lake Aegeri (Livingstone and Imboden Citation1996), resulting in 2 VHOD rates for the lake aligned with each
timeframe. In the case of Lake Constance, the
and
rates were reported for 3 separate timeframes associated with the different trophic states the lake underwent. Lake Constance was eutrophic from 1977 to 1987 (
= 0.00543 g O2 m−3 d−1,
= 0.0750 g O2 m−2 d−1), mesotrophic from 1988 to 1999 (
= 0.00458 g O2 m−3 d−1,
= 0.0640 g O2 m−2 d−1), and oligotrophic from 2000 to 2010 (
= 0.00393 g O2 m−3 d−1,
= 0.0640 g O2 m−2 d−1) (Rhodes et al. Citation2017). Given the distinctions in the depletion rates aligned with the trophic states of Lake Constance, we obtained 3 VHOD rates for the lake across the 3 timeframes. VHOD rates associated with Lake Aegeri and Lake Constance are shown as method C ().
We obtained 90 VHOD estimates from individual lakes or different time periods within a lake. We matched each VHOD estimate with the trophic state using total phosphorus (TP) concentrations based on Carlson’s trophic state index (Carlson Citation1977). For cases lacking TP data, we conducted additional literature searches to find lake-specific TP values for the observed VHOD timeframe. In the absence of TP concentrations, we categorized VHOD rates using chlorophyll a concentrations, adhering to Carlson’s indexing guidelines, resulting in 28 eutrophic, 24 mesotrophic, and 38 oligotrophic VHOD rates (). All the lakes included here were either dimictic or monomictic.
Given varying hypolimnion temperatures in the lakes, we standardized the VHOD estimates to a common temperature for accurate comparison and model application. Thus, we utilized a well-documented temperature standardization equation (Salisbury and Ross Citation1978) that follows the Q10 rule, commonly applied in temperature-dependent biological processes such as microbial mineralization (Gudasz et al. Citation2010):
(5)
(5) where
corresponds with the VHOD rate at a given temperature
and
is associated with the VHOD rates from the empirical studies at their respective reference temperatures,
(in this case 4 °C). The value for the temperature coefficient
used was 1.0869 (Gudasz et al. Citation2010). By rearranging equation 5 we calculated the estimated VHOD, referenced to 4°C, the temperature of maximum density of water and a widespread hypolimnion temperature in cold deep temperate lakes:
(6)
(6) Afterward, the same temperature correction was applied to analyze temperature sensitivity of the VHOD estimates for different trophic states over a range of temperatures between 0 and 20°C, based on the reference temperature of TREF = 4°C according to equation 5.
A simple model of hypolimnetic O2 depletion
We defined the O2 concentration (mg L−1) at the start of the stratification period (d) to be at 100% saturation, making the initial O2 concentration,
, a sole function of hypolimnetic water temperature in Kelvin (K). First, the temperature-dependent Henry coefficient for O2,
(mol L−1 bar−1) was calculated using a Taylor expansion equation (Boehrer et al. Citation2021):
(7)
(7) where
are O2-specific coefficients (
= −58.3877,
= 85.8079, and
= 23.8439), temperature is
(K), and
(= 986.9/22391) is a unit conversion factor incorporated to account for the variations in solubility units. The O2 concentration at 100% saturation at a given temperature,
, then defined the initial O2 concentration,
, as:
(8)
(8) where the partial pressure of O2 in the atmosphere is represented by
(bar) and is dependent on the altitude of the lake.
Finally, a simple difference equation calculated the O2 concentration at end of stratification using the stratification period and VHOD. Assuming no O2 fluxes from the atmosphere into the hypolimnion, this end-of-stratification O2 concentration constitutes the minimum O2 in a lake, characterized by a given trophic state and hypolimnion water temperature:
(9)
(9)
(10)
(10) where the O2 concentration (mg L−1) in the hypolimnion at the end-of-stratified period
(d) is represented by
,
is the initial O2 concentration at the start of stratification influenced by hypolimnetic water temperature (K) as described in equation 8, and
(d) denotes the duration of the stratification period. The
value is based on the median of corresponding literature survey estimates for the respective trophic state and adjusted to the relevant hypolimnion temperature according to equations 5 and 6 (Supplemental Table S1) as outlined in equation 10. Note that equation 9 can deliver negative O2 concentrations, which were then set as 0. Although negative O2 concentrations are unrealistic, they nevertheless contain meaningful information because they correspond to a chemical O2 demand of the respective lake as reflected by the presence of reduced substances such as, for example, NH4+, H2S, Fe2+, and Mn2+ (Müller et al. Citation2012). In that sense, negative O2 concentrations could be interpreted as a deficit with that amount of O2 required to oxidize these reduced substances in the water. In a real lake, this interpretation would imply the O2 deficit has to be filled (e.g., by atmospheric imports during circulation) before positive O2 concentrations can be achieved.
Note that because of the simplifications we included in our model approach, we made the following assumptions. The model (1) treats the hypolimnion as a single compartment without vertical gradients, (2) assumes a linear O2 decrease over time, (3) operates with one VHOD value per lake, and (4) does not distinguish sediment O2 demand from pelagic O2 depletion and hence does not explicitly account for morphometric features of the hypolimnion.
Model validation
Model performance was evaluated using observed hypolimnion O2 concentrations from 5 dimictic German lakes. The measurements from these lakes represented the average hypolimnion O2 concentrations over the season and hence contain information about O2 concentration at the end-of-stratified period, compatible to our model output. This validation dataset (Supplemental Table S2) included 27 individual observations from the 5 lakes, with 1 measurement per year for any given lake treated as an independent measurement (described earlier). Because average hypolimnion concentrations were measured a few days before, we utilized our model to predict O2 concentrations corresponding to the actual measurement date in the field. Note that the validation dataset was independent from the data used to parameterize the model.
Model application
We tested the model suitability for real lake systems using 13 dimictic German lakes (, ), a dataset completely independent of the literature data used to parameterize the model (). We used 45 different yearly datasets from 2 oligotrophic lakes, 6 mesotrophic lakes, and 5 eutrophic lakes (). Using aggregated daily water surface and bottom (i.e., 5 m) temperatures, we defined stratification duration based on temperature differences. The start of stratification was regarded as the first day the temperature difference between the surface water and the deep water was ≥2 K, considered the end-of-stratification period. For the period bounded by these established stratifications start and end dates, the difference in temperatures between the top water and bottom water had to exceed the 2 K threshold to be considered truly stratified. When the predicted final O2 concentration was ≤0, anoxia was assigned/assumed.
Figure 1. Study lakes in Germany (black points) denoting where stratification duration and mean hypolimnion temperature data were observed. Points for Breiter Luzin, Schmaler Luzin, and Feldberger Haussee overlap.
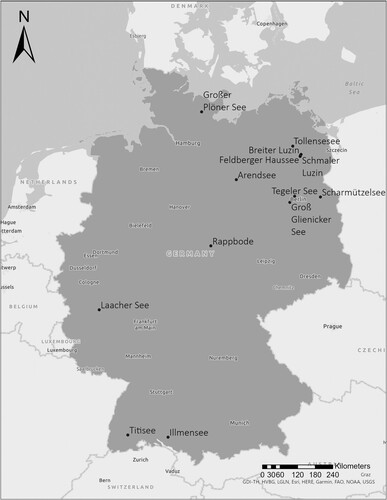
Table 2. Mean hypolimnion temperature, stratification duration, and model-based VHOD estimates in 13 German lakes.
We considered the application to empirical lake data important to identify the most relevant parameter space in the hypolimnion temperature versus stratification duration for typical Central European lakes. In other climates and regions, this area of interest varies; for instance, subtropical lakes often have warmer hypolimnion temperatures. Given the extensive empirical data from our literature survey, which covered diverse lakes in terms of trophic state, hypolimnion temperatures, and climates, our model should apply effectively across various climates and regions.
Additionally, we used the yearly mean deep-water temperatures of the lakes during stratification as an estimate of hypolimnion temperatures by averaging temperatures 3 m above the bottom for lakes <20 m deep and 5 m for lakes >20 m deep during stratification, assuming this mean temperature represented the entire hypolimnion. Ultimately, we used lake-specific stratification duration, hypolimnion temperature, and trophic state (characterized by TP concentrations using Carlson’s trophic state index; Carlson Citation1977) to estimate end-of-stratification O2 concentrations for each lake on a given year using our model.
Furthermore, we utilized 3 critical O2 concentration thresholds identified in literature (5, 2, and 0.5 mg L−1) to interpret the predicted end-of-stratification O2 concentrations concerning their impact on the ecosystem (Jane et al. Citation2022). Oxygen concentrations below ∼5 mg L−1 affect sensitive, cold-adapted fish species like brook trout (Spoor Citation1990), whereas a concentration of O2 <2–3 mg L−1 has been associated with a hypoxic state (Diaz and Rosenberg Citation2008, Vaquer-Sunyer and Duarte Citation2008). O2 concentrations <0.5 mg L−1 are commonly seen as indicators of the onset of anoxia in lakes (Vaquer-Sunyer and Duarte Citation2008, North et al. Citation2014), affecting the production of reduced substances and massive losses of higher organisms, and even representative of actual anoxia (Jane et al. Citation2022).
Relative importance of stratification duration, hypolimnetic temperature, and trophic state with respect to critical O2 concentrations and climate adaptation potential
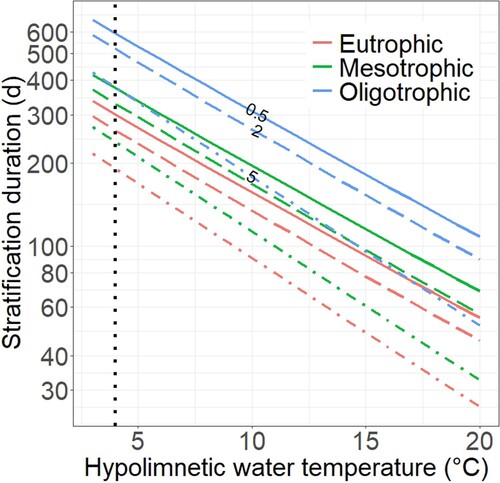
As a synthesis, we analyzed the sensitivity of our model to examine the influence of hypolimnion temperature, stratification duration, and trophic state for reaching critical end-of-stratification O2 concentrations. By rearranging the model equation, we computed stratification durations for the applied critical O2 concentrations thresholds (5, 2, and 0.5 mg L−1, discussed earlier) as a function of a given hypolimnetic temperature and trophic state:
(11)
(11) The resulting sensitivity diagram reveals how enhancing trophic state impacts the climate adaptation potential of a lake. In this context, a decrease in productivity (such as transitioning from eutrophic to mesotrophic conditions) allows the tolerance of a certain stratification prolongation and hypolimnetic warming without deteriorating O2 conditions. It therefore informs decision makers about lake management targets and tolerable increases in hypolimnetic temperature and stratification duration that a lake can withstand without reaching critical O2 concentrations, provided a targeted improvement of trophic state of a lake is implemented.
The R 4.1.2 statistical programming environment (R Core Team Citation2021) was used in all analyses, model calculations, and figure generation.
Results
O2 depletion rates for different temperatures and trophic states
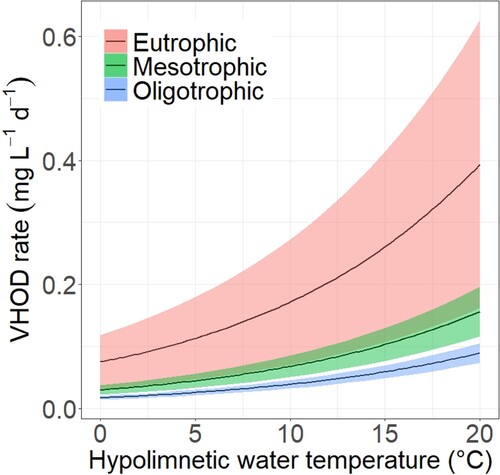
Literature-based VHOD rates provided a clear pattern with increasing VHOD from oligotrophic to mesotrophic and eutrophic lakes (). The variability in VHOD among different studies or lakes and years, respectively, increases with rising trophic state. Eutrophic lake VHOD values partially overlapped with high values observed in mesotrophic lakes. Notably, temperature had a nonlinear effect on VHOD (), causing larger differences in VHOD between trophic states at higher temperatures. Hence, shifting from mesotrophic to eutrophic trophic states had more pronounced effects on hypolimnion O2 concentrations in warmer conditions than colder conditions. For example, at 4.00°C, mean VHOD estimates for mesotrophic and eutrophic states are 0.0412 and 0.104 mg L−1 d−1 (a difference in VHOD of 0.0628 mg L−1 d−1), respectively. However, at a hypolimnion temperature of 12.00°C, these values increase to 0.0802 and 0.203 mg L−1 d−1, respectively, (a difference in VHOD of 0.123 mg L−1 d−1). This temperature effect is important, not only for model applicability across lakes of different morphologies and climates that exhibit significant hypolimnion temperature variations, but also because hypolimnion temperature is an influential variable over the further progression of climate warming.
Figure 2. Mean (black lines) VHOD rates as a function of hypolimnetic temperature for different trophic status. The shaded regions illustrate the 99% confidence interval of each trophic state VHOD mean.
Model validation
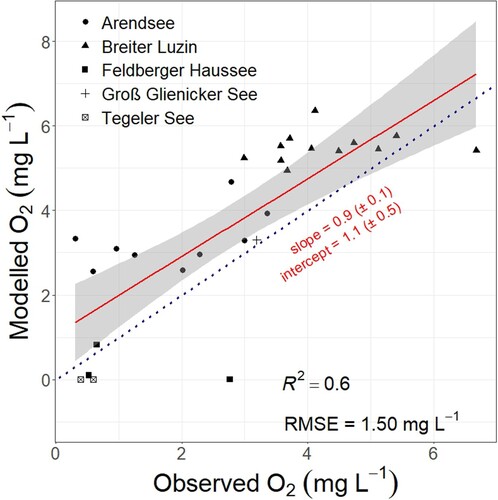
To evaluate our O2 depletion model, we conducted a linear regression between predicted and in situ O2 concentrations. The estimated O2 concentrations during stratification showed a significant linear correlation with the in situ measured O2 concentrations. Values of R2 (0.6) and RMSE (1.50 mg L−1; ) attest to good model performance in predicting O2 concentrations (Santhi et al. Citation2001, Pilla and Couture Citation2021) given the simplicity of our approach. The regression line had a slope of 0.9 ± 0.1, suggesting it is not significantly different from 1. Furthermore, the intercept was 1.1 ± 0.5 mg L−1, indicating no significant deviation from 0 (). In summary, the regression line between predicted and observed O2 concentrations was closely aligned with the 1:1 line (). Ultimately, these validation results demonstrate the satisfactory performance of our model and documents its transferability and potential to predict O2 concentration dynamics in stratifying lakes, particularly in larger-scale applications.
Figure 3. Validation of predicted O2 concentrations from our model with in situ measured O2 concentrations from 5 German lakes (Arendsee, Feldberger Haussee, and Tegler See are eutrophic; Breiter Lutzin and Groß Glienicker See are mesotrophic). The regression line (red) is shown with 95% confidence interval (shaded grey area). Blue and dotted line indicates the 1:1 line.
Model application: predicting hypolimnion O2 concentrations for lakes of diverse trophic states
Model-based predictions for hypolimnetic O2 depletion showed a strong dependence on both hypolimnion water temperature and stratification duration. Essentially, O2 depletion speeds up with rising hypolimnion temperatures, and the response is nonlinear because of the exponential effect of water temperature on VHOD (discussed earlier; ). Concurrently, extended periods of stratification inherently lead to increased O2 depletion, following a linear scaling pattern (equation 8). In co-action, higher hypolimnion temperatures and the prolongation of the stratified period, as expected in a warming climate, will further increase hypolimnetic O2 depletion in lakes, thus markedly increasing the risk of anoxia/hypoxia. The specific quantitative outcomes vary significantly based on the trophic state.
The trophic state-dependent nomograms () enable the determination of O2 concentration estimates at the end-of-stratified period when the hypolimnion temperature, stratification duration, and trophic state of a lake are known. A prolongation of stratification duration (e.g., by climate warming) will shift the lake farther to the right (i.e., parallel to x-axis). Any increase in hypolimnion temperatures shifts the lake upward (i.e., parallel to y-axis). The combined effects of hypolimnion temperature (acting nonlinearly) and stratification duration (acting linearly; ) induce a concave curvature in the isolines for final hypolimnetic O2 concentration. In cases where hypolimnion temperature and stratification both increase—likely when warming is intense—a shift along the diagonal (i.e., towards the upper right corner) occurs, and isolines are crossed perpendicularly, representing a fast drop in final hypolimnetic O2 concentration. Moreover, we stress that hypolimnion temperature acts via a second chain because it also determines the starting conditions for hypolimnetic O2 conditions seen as O2 concentrations along the y-axis (i.e., at duration of 0 days). The warmer the hypolimnion, the lower the initial concentration because of the decrease in O2 solubility with increasing temperatures.
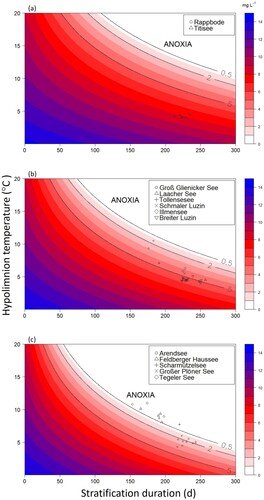
Figure 4. Contour plots displaying the predicted O2 concentration (color scale) in (a) oligotrophic, (b) mesotrophic, and (c) eutrophic lakes as a function of stratification and hypolimnion temperature. Points denote separate years in a respective lake. Isolines represent O2 concentrations.
Model application for oligotrophic lakes
In oligotrophic lakes, the model predicts relatively low VHOD, but anoxia can nevertheless be reached if temperatures rise to, for example, >10.00°C (a). If the hypolimnion temperature gets warmer, for example >20.00°C, as in many tropical lakes, anoxic conditions in the hypolimnion can even be expected under oligotrophy if stratification persists only for a few months. Consequently, as the hypolimnion temperature rises, the VHOD increases and the availability of O2 for ecological and biological processes decreases, thus reinforcing the occurrence of low O2 concentrations.
Nevertheless, oligotrophic lakes have a high resistance against loss of O2 and never reach anoxia when stratification remains <300 days and the hypolimnion temperature <10.00°C. But lakes with high hypolimnion temperature, for example ≥15.00°C, can indeed become anoxic if stratification lasts >7 months. The example data for German oligotrophic lakes clearly show they are never at risk of anoxia, even if the hypolimnion temperature and stratification duration rise considerably (a). The 2 oligotrophic lakes, Rappbode and Titisee, with a stratification period of 213–235 days and hypolimnion temperatures 3.99–4.50°C (), were predicted to reach O2 concentrations of 6.67–7.99 mg L−1 at end-of-stratification (a; Supplemental Table S3), well above the 3 thresholds identified as indicative of lakes facing threats to their ecological functioning.
Model application for mesotrophic lakes
The rate of O2 depletion is more pronounced in mesotrophic lakes, resulting in a more rapid depletion of hypolimnetic O2 concentrations as the stratification period progresses (b). The depletion of O2 concentrations influenced by hypolimnion temperatures for mesotrophic lakes is shown to occur much faster than in oligotrophic lakes, a logical consequence from the higher median VHOD rates for mesotrophic lakes (0.0330 mg L−1 d−1) than for oligotrophic lakes (0.0209 mg L−1 d−1; , Supplemental Table S1). However, mesotrophic lakes remain resistant against anoxia and reach this condition only if stratification goes >300 days and hypolimnion temperature is >9.00°C. But in warmer lakes the risk of anoxia becomes real. For example, if a hypolimnion temperature of 15.00°C is assumed, a mesotrophic lake becomes anoxic when stratification persists longer than 5 months (b), which could be a typical situation in a subtropical lake.
The example dataset for German mesotrophic lakes shows they never reach anoxia but can be hypoxic and reach low O2 concentrations of ∼0.90 mg L−1 with a hypolimnion temperature markedly >4.00°C (b). The set of mesotrophic German lakes covered a range in stratification from 176 to 257 days and in hypolimnion temperature between 4.06 and 10.50°C (). At end-of-stratification, most mesotrophic lakes exhibited O2 concentrations ranging from ∼0.87 to ∼5.37 mg L−1. As a result, most had O2 levels below the 5.00 mg L−1 threshold, with the exception of Groß Glienicker See in 2019, where O2 levels dropped to 0.87 mg L−1 (b, Supplemental Table S3).
Model application for eutrophic lakes
When applying the model to eutrophic lakes, O2 depletion during stratification significantly outpaces that in oligotrophic and mesotrophic lakes. The literature search yielded a median eutrophic VHOD rate of 0.0412 mg L−1 d−1 in hypolimnion temperatures of 4.00°C (Supplemental Table S1), markedly higher than both the oligotrophic and mesotrophic median VHOD rates. Evidently the risk of hypoxia and anoxia is higher in eutrophic systems, even at a temperature of 4.00°C, the typical hypolimnion temperature in deep dimictic lakes, when stratification persists for >10 months (c). Furthermore, the likelihood of a lake having O2 concentrations below the 3 thresholds is higher in eutrophic lakes than in other trophic states, particularly in systems where hypolimnion temperatures are >5.00°C, underscoring the decisive influence of temperature on lake hypolimnion O2 dynamics. For example, at hypolimnion temperatures ∼10.00°C, anoxia is reached after 5 months of stratification while conditions with O2 <5.00 mg L−1 are realized after 3 months (c).
In this context, we stress that the model delivers whole-hypolimnion averages for dissolved O2 concentration and cannot resolve potential gradients within the hypolimnion. Under conditions of low average hypolimnion concentrations (i.e., 1.00 mg L−1), an already large share of the initial O2 is likely depleted. For example, at 5.00°C hypolimnion temperature, corresponding to an initial O2 concentration of 12.00 mg L−1, a critical O2 concentration of 2.00 mg L−1 is reached after 240 days, meaning that 83% of the initial O2 storage is lost. In a real-world lake that loses >80% of hypolimnetic O2, the occurrence of fully anoxic conditions in the deep hypolimnion is highly likely, whereas the upper parts of the hypolimnion probably retain O2 concentrations above the average (details discussed later).
Eutrophic lakes in the dataset consistently ended stratification periods with O2 concentrations <4.00 mg L−1 (c). Stratification duration varied among these 5 lakes, ranging from 153 days in Tegeler See (2021) to 243 days in Lake Arendsee (2014 and 2019; Supplemental Table S3). Simultaneously, mean hypolimnion temperatures ranged from 4.29°C (Lake Arendsee 2013) to 10.99°C (Tegeler See 2019; ). Feldberger Haussee and Tegeler See, owing to their relatively moderate depth (<20 m) and consequently shallower hypolimnion, exhibited higher average hypolimnion temperatures than the 3 deeper lakes. Furthermore, by end-of-stratification, the O2 concentrations in these shallow lakes, including Scharmützelsee, had already dipped into the anoxic range.
Relative importance of stratification duration, hypolimnetic temperature, and trophic state with respect to critical O2 concentrations and climate adaptation potential
Our model quantifies the sensitivity of end-of-stratification O2 conditions with respect to all 3 influential variables; trophic state, stratification duration, and hypolimnetic temperature (). A hypothetical oligotrophic lake with a hypolimnion temperature of 6°C, for example, would take 294 days of stratification to reach an O2 concentration of 5 mg L−1. By comparison, at the same temperature a mesotrophic lake would require only 186 days and a eutrophic lake only 149 days. Raising the temperature of a mesotrophic lake from 6 to 7°C reduces the time to reach critical O2 thresholds: 31 days less for 0.5 mg L−1, 28 days less for 2 mg L−1, and 21 days less for 5 mg L−1 (; Supplemental Table S4). This difference reflects the high sensitivity of temperature on hypolimnetic O2 conditions; an increase of only 1°C corresponds to changes in stratification duration on the order of a month. In warming lakes with increased hypolimnetic temperature and longer stratification, temperature effects can therefore become dominant. These results underscore the effectiveness of eutrophication control and trophic state reduction measures as climate adaptation strategy. For example, converting a eutrophic lake of 4°C and 200 days of stratification into a mesotrophic lake allows it to tolerate a hypolimnetic warming of 2°C or a 100-day extension in stratification without adversely affecting its hypolimnetic O2 levels.
Figure 5. Stratification duration for a lake of a specific trophic state at a given hypolimnetic temperature to reach critical O2 biological and ecological thresholds; anoxia = 0.5 mg L−1 (solid line), hypoxia = 2 mg L−1 (long dash), uninhabitable by cold dwelling fish species = 5 mg L−1 (dot dash). Our reference temperature of 4°C is denoted by the black dotted line.
Discussion
Our model illustrates the impact both hypolimnetic water temperature and stratification duration have on lake O2 concentration dynamics at the end-of-stratified period in conjunction with lake trophic level. Our approach proves reasonable in predicting yearly trends in end-of-stratification O2 concentrations and assessing the risk of breaching 3 crucial biological and ecological thresholds. Furthermore, our model documents the susceptibility of lakes to future warming by indicating that critical O2 thresholds will be reached earlier with rising hypolimnion temperatures and prolonged stratification periods unless measures to reduce trophic state are implemented.
Model assumptions
Neglecting vertical gradients in the hypolimnion and obtaining averaged O2 concentrations leads to overlooking variations specific to different depths. First, when our model indicates an end-of-stratification O2 concentration of 2.00 mg L−1 in a lake, the actual O2 distribution in the hypolimnion is probably not uniform. The upper hypolimnion probably has higher concentrations while the deep hypolimnion may already be in an anoxic state. Second, processes such as photosynthesis in the hypolimnion (Burns Citation1995, Burns et al. Citation2005), observed in studies by Lucas and Thomas (Citation1972) and Mitchell and Burns (Citation1979), could challenge our assumption of linear O2 decrease over time and no O2 inputs during stratification through the metalimnion following a first-order O2 decrease. Other potential processes would be the delivery of O2-rich water via lake inflows (Vincent et al. Citation1984, Gibbs Citation1992, Burns Citation1995) or diffusive fluxes through the thermocline becoming significant, either through internal wave activities (Bocaniov et al. Citation2014) or downward diffusion (Burns Citation1995). However, the transport through the thermocline depends on turbulent diffusion and lake morphometry and is usually small (Kreling et al. Citation2017, Dong et al. Citation2020), but it reached up to 18% in the relatively shallow Lake Erie with considerable Poincaré wave activity as a source of turbulence (Bouffard et al. Citation2013).
Unlike our VHOD-focused model, the widely used Livingstone and Imboden (Citation1996) model (L&I model) in applied limnology accounts for lake morphometry and offers depth-dependent O2 depletion rates. This depth resolution enables the L&I model to predict dynamic changes in vertical O2 gradients during the stratified season. Although their assumption of vertically constant rates of sediment O2 demand and pelagic O2 depletion is a simplification (Schwefel et al. Citation2018, LaBrie et al. Citation2023), distinguishing between benthic and pelagic fluxes is advantageous because benthic fluxes often dominate the hypolimnetic O2 depletion, unless the lake is exceptionally large with a high volume-to-area ratio. Because our model does not account for these morphometric features (i.e., the ratio of sediment area to hypolimnion water depth), it is simpler and requires fewer parameters. In addition to its simplicity, another reason to opt for our VHOD-based model over a morphometric approach like the L&I model is the broader availability of literature values for VHOD rates. This extensive literature evidence facilitated a comprehensive examination of the impact of various trophic states and allowed us to incorporate temperature as a crucial factor, which is not included in the L&I model.
Morphometry, coupled with climate, influences hypolimnion temperatures in lakes, with shallower lakes usually having a warmer hypolimnion. Our model indirectly considers this effect through hypolimnion temperature influenced by morphometry. Nevertheless, studies such as Molot et al. (Citation1992) have documented the interplay of O2 depletion with morphometry, suggesting that hypolimnetic O2 depletion is largely influenced by lake morphometry. Lakes with a low hypolimnion volume-to-area ratio rely more on sediments for their O2 dynamics, whereas those with a high ratio rely primarily on pelagic processes (Steinsberger et al. Citation2020). Rhodes et al. (Citation2017) argue that pelagic respiration dominates O2 consumption in lakes with hypolimnetic depths >20 m. Livingstone and Imboden (Citation1996) acknowledge that in shallow eutrophic lakes, O2 depletion is primarily driven by the benthic interface, whereas in deeper oligotrophic lakes it is largely governed by the pelagic zones. Although we did not follow the L&I model approach of explicitly separating pelagic from sedimentary O2 demand, a factor clearly shown to impact O2 depletion in stratifying waters (Burns and Ross Citation1972, Butts and Evans Citation1977, Butts Citation1978), our model has wider applicability because we included water temperature and trophic state. Also, our model has transferrable parameters and does not require local calibrations. Thus, our model is more applicable at larger scales (e.g., in global scale assessments), enabling the generation of generalized, conceptual conclusions and patterns rather than precise, depth-resolving predictions for specific lakes.
Impacts of trophic state and VHOD on O2 concentration dynamics
We demonstrate that trophic state strongly influences lake O2 depletion rates and hypolimnion O2 concentrations at end-of-stratification. Our literature search shows distinct VHOD rate variations based on trophic state (), an observation aligning with prior research indicating that increased lake productivity correlates with higher organic matter mineralization rates in the water column (Beutel Citation2003), leading to greater O2 consumption (Müller et al. Citation2012, Steinsberger et al. Citation2020, Jane et al. Citation2021). Hence, eutrophic lakes, with wider ranges of TP levels as per Carlson’s trophic index, have more VHOD variability than other trophic states. Despite numerous case studies and textbook definitions of eutrophic lakes with anoxic hypolimnia, we found no comprehensive literature review quantifying O2 depletion variations across trophic states. Therefore, the data gathered in this study represent an unexplored and vital empirical foundation. The robust empirical basis of our model has several strengths: (1) it enhances transferability, (2) it transforms qualitative knowledge into a precise predictive tool, and (3) the literature survey not only provided characteristic VHOD rates for the different trophic states, but also their variability and uncertainty bounds.
Our model predicts all eutrophic lakes in our sample lakes have O2 concentrations below some of the outlined biological and ecological O2 thresholds. All these lakes had concentrations <4.00 mg L−1 at end-of-stratification (c), with a majority characterized as experiencing either hypoxia or anoxia. Rosa and Burns (Citation1987), Evans et al. (Citation1996), and Rhodes et al. (Citation2017) observed similar interactions of eutrophication with hypolimnetic O2 concentration dynamics. The influence trophic status has on hypolimnetic O2 concentrations is further shown in our observed mesotrophic lakes, which tended to have higher O2 concentrations (0.85–5.40 mg L−1). While some of these mesotrophic lakes had end-of-stratification O2 concentrations below the 5.00 mg L−1 threshold; Groß Glienicker See, by contrast, experienced hypoxia in 2019. Our oligotrophic lakes had O2 concentrations 6.00–7.00 mg L−1 at the end-of-stratified period. Hence, our model effectively links O2 depletion rates to trophic state, as described by Edmondson (Citation1961) and Vincent et al. (Citation1984), offering a straightforward and broadly applicable predictive framework. Nevertheless, our study also documents that the simplified generalizations (e.g., in textbooks) of eutrophic lakes always experiencing anoxic hypolimnia and mesotrophic lakes tending not to are not always valid. Mesotrophic lakes can turn anoxic when stratification is long and temperature is high. Even oligotrophic lakes can become anoxic if the hypolimnion is sufficiently warm, such as in the tropics.
Model sensitivity analysis
In evaluating the significance of the input parameters of the model (stratification duration, hypolimnion temperature, and trophic state) in reaching the delineated critical O2 thresholds, we found all 3 to be relatively important. For instance, our model indicates that increasing hypolimnion temperature or stratification duration of a lake leads to decreased O2 levels at end-of-stratification. Importantly, the combined impact of hypolimnion warming and prolonged stratification rapidly accelerates deoxygenation. Although our model treats both factors as additive rather than synergistic, the nonlinear, 2-way (initial O2 and O2 depletion rate) effect from hypolimnion temperature renders the temperature effect particularly influential. Moreover, the trophic state of a lake influences the speed of O2 concentration depletion, with depletion and arrivals of O2 concentrations at critical thresholds occurring much quicker at higher trophic states (, Supplemental Table S4).
Climate change frequently functions like eutrophication (Moss et al. Citation2011), particularly in lakes with altered catchments that lead to increased nutrient loading and eutrophication (Rose et al. Citation2016, Woolway et al. Citation2020, Jane et al. Citation2021), which in turn leads to heightened lake productivity (Lee and Biggs Citation2015, Ho et al. Citation2019), increasing VHOD rates, and ultimately lower O2 concentrations at end-of-stratification (Jane et al. Citation2021). Thus, trophic state, and its vulnerability to climate change, significantly influences lake O2 concentration dynamics in response to warming climates (Rose et al. Citation2016, Rogora et al. Citation2018). Therefore, reduction of lake trophic levels through measures such as nutrient loading controls becomes a fundamental strategy in mitigating the effects of climate warming and should be exploited by decision makers for climate adaptation of lake and reservoirs.
The temperature effect on O2 concentration dynamics
Our model emphasizes the significance of hypolimnion water temperatures in lake O2 concentration dynamics. This temperature influence is first evident from the end of the spring turnover, when O2 saturation at the water–air interface is dependent on the water temperature (Boehrer et al. Citation2021). During the vertical mixing periods (spring turnover), O2 saturation is attained because lake temperatures are relatively homogeneous, allowing for uniform atmospheric exchange and equilibrium throughout the water column. Stratification renders the hypolimnion inaccessible for atmospheric gas exchange, preventing the replenishment of O2 concentrations. Our model calculates the initial O2 concentration based on the average hypolimnion temperature. The importance of temperature on initial O2 concentrations in hypolimnion waters is well described in literature. Hanson et al. (Citation2006) described the role of temperature in dissolved gas concentrations, observing a downturn in lake O2 concentrations with rising water temperature.
Moreover, our model highlights the importance of hypolimnion water temperatures in O2 consumption during stratification. Our model quantifies the temperature effect on VHOD rates, with higher hypolimnion temperatures resulting in higher O2 consumptions. For example, an increase from 4.00 to 8.00°C in an oligotrophic lake increases the O2 depletion rate by ∼40%. The temperature-related acceleration of biochemical processes, including O2 depletion, is widely reported in literature (Rosa and Burns Citation1987, Burns Citation1995, Foley et al. Citation2005, Gudasz et al. Citation2010). Hence, in calculating the VHOD rates for our observational lakes according to their hypolimnion temperatures (), the highest rate within each trophic state corresponds to the lake with the highest average hypolimnion temperature, and the lake with the lowest hypolimnion temperature had the lowest rates. In eutrophic lakes, Tegle/r See in 2019, with an average hypolimnion temperature of 10.99°C, had a VHOD rate of 0.0738 mg L−1 d−1, whereas Arendsee in 2013, with an average hypolimnion temperature of 4.29°C, had a VHOD rate of 0.0422 mg L−1 d−1. The effect of hypolimnion temperature on biogeochemical activities and the eventual decline of O2 concentrations in the compartment is also described in Blumberg and Di Toro (Citation1990).
While historical surface water temperature increases due to climate warming are well documented, the rate of temperature rise in bottom waters has been reported to be slower. Livingstone (Citation2003), for example, found hypolimnion temperature increments of ∼0.13 K decade−1 from 1950 to 1990 in Lake Zurich. Pilla et al. (Citation2020) showed that changes in hypolimnion temperatures were lake specific, with trends ranging between −0.65 and 0.65 K decade−1 in a global analysis of 102 lakes. Bottom water temperatures remain relatively stable throughout the year, shielded from the influence of warmer air temperatures during stratification, as long as winter conditions permit sufficient lake cooling (Livingstone Citation2003). Ultimately, the climate warming-mediated differential temperature increase in both surface and bottom waters influences stratification prolongation. Dokulil et al. (Citation2006), and Richardson et al. (Citation2017), however, observed that bottom temperature increases in the hypolimnion are not occurring congruently. For example, large and deep lakes have been observed to show increases in hypolimnion temperatures, probably stemming from heat carryover from previous years (Livingstone Citation2003, Dokulil et al. Citation2006, Arvola et al. Citation2010, Rogora et al. Citation2018, Anderson et al. Citation2021). By comparison, shallow lakes experience faster heat loss in autumn and lower winter temperatures (North et al. Citation2013, Winslow et al. Citation2015), resulting in weaker hypolimnion warming trends.
Studies incorporating future climate scenario modeling have, nonetheless, shown that bottom temperatures are projected to increase in temperate lakes under moderate scenarios (Shatwell et al. Citation2019, Mi et al. Citation2020). With warmer winter air temperatures projected in the future, Mi et al. (Citation2020) suggested reduced occurrences of ice cover and inverse stratification during winter, resulting in Rappbode Reservoir experiencing a shift in lake mixing regime, transitioning from dimictic to monomictic. Such shifts from dimictic to warm-monomictic are predicted for many lakes worldwide (Woolway et al. Citation2021), demarcating a critical tipping point where any further warming will directly affect the hypolimnion temperature. This subsequent hypolimnion temperature increase will result in dire consequences to lake ecosystems by accelerating VHOD and lowering initial O2 concentrations.
However, research on the importance of hypolimnion temperature on O2 consumption is limited, with an overrepresentation of deep dimictic lakes. Hence, lakes with hypolimnion temperatures significantly above 4.00°C are often understudied. This approach is flawed because lakes in subtropical/tropical regions, which undergo stratification, have relatively warmer hypolimnia. Additionally, Central European lakes of intermediate depth (i.e., with shallower hypolimnion depths) have hypolimnion temperatures >4.00 °C (i.e., Lake Scharmützelsee in our dataset). Given the potential impacts of climate warming on lakes, a comprehensive understanding of the global-scale implications of deep-water temperatures increase on O2 concentration dynamics is essential.
O2 concentrations in relation to stratification duration
Stratification duration plays a crucial role in hypolimnion O2 depletion dynamics. Prolonged stratification raises anoxia risk, especially in eutrophic lakes or warmer hypolimnia. We established a linear relation between O2 decrease and stratification period length. When comparing 2 lakes/years with similar hypolimnion temperatures and VHOD rates, a longer stratification period led to a greater decline in O2 concentrations. In our case studies, the stratification duration effect was evident when comparing O2 concentrations between 2 relatively similar years in Arendsee. In 2014, with a 243-day stratification period (hypolimnion temperature = 5.07°C and VHOD = 0.0451 mg L−1 d−1), the O2 concentration at end-of-stratification was lower than in 2016, which had a 230-day stratification period (hypolimnion temperature = 5.06°C and VHOD = 0.0450 mg L−1 d−1; Supplemental Table S3, c). Several studies have described the connection between longer stratification and increased O2 depletion (Fang and Stefan Citation2009, Foley et al. Citation2012, Jane et al. Citation2021, Pilla and Williamson Citation2022). Furthermore, longer stratification periods can lead to shorter spring turnover times, reducing O2 replenishment to bottom hypolimnetic waters (Pilla and Williamson Citation2022), therefore promoting O2 concentrations below the critical thresholds (Fang and Stefan Citation2009, Foley et al. Citation2012).
Numerous observational and modeling studies have associated stratification prolongation with climate warming (Foley et al. Citation2012, Ficker et al. Citation2017, Shatwell et al. Citation2019) and the eventual decreased O2 concentrations (Foley et al. Citation2012, North et al. Citation2014, Woolway et al. Citation2021). Changes in stratification patterns driven by climate warming have been observed in Heiligensee (Germany; Adrian et al. Citation1995), Lake Washington (Washington State, USA; Winder and Schindler Citation2004), Blelham Tarn (Foley et al. Citation2012), and Austrian lakes Irrsee, Mondsee, and Hallstätter See (Ficker et al. Citation2017), resulting in earlier onset. By comparison, the later stratification breakup has been observed and modeled in Lake Tahoe (California/Nevada, USA; 4.4 d decade−1), Blehlam Tarn (UK; 18 d decade−1), and in the upper North American Great Lakes (average 3.5 d decade−1) (Woolway et al. Citation2021).
Practical relevance of our results for lake management
Our results also have implications for lake management by providing quantitative predictions for hypolimnetic O2 concentrations, which are highly relevant for the ecological status of lakes (European Commission Citation2000) and at the same time heavily impacted by climate change. With ongoing climate warming, hypolimnetic O2 concentrations will decrease, and currently oxic lakes (e.g., in a mesotrophic state) will face future anoxia. Eutrophic lakes already experiencing anoxia will nevertheless suffer as the biogeochemical O2 deficit increases and the production of reduced substances (Müller et al. Citation2012), including greenhouse gases (Encinas Fernández et al. Citation2014, Steinsberger et al. Citation2019), intensifies. Oligotrophic lakes will likely remain oxic but may lose their habitat suitability for salmonids by undercutting the critical O2 threshold of 5 mg L−1. The degree of climate warming risk varies based on the context of a particular lake ecosystem, and therefore determining which type of lake is more vulnerable becomes subjective. However, the following points are pertinent for lake management:
Lakes susceptible to hypolimnetic warming are particularly sensitive, including stratified lakes of moderate depth (≤20–30 m) in temperate zones, warm-monomictic lakes predicted not to reach the temperature at maximum water density during winter mixing in the foreseeable future, and numerous reservoirs with deep water release.
Because lake managers cannot stop climate warming, adapting to its changes necessitates strategic approaches. The most efficient adaptation is to reduce the trophic state of a lake. Transitioning a eutrophic lake to a mesotrophic state, for instance, will substantially improve O2 conditions. Thus, achieving the goals of the European Water Framework Directive will indeed mediate climate adaptation.
In systems where reductions of trophic state cannot be realized, technical interventions like aeration may offer a solution. Alternatively, decision makers may need to acknowledge and tolerate the impending ecosystem degradation as an unfortunate reality.
Supplementary Table 1.docx
Download MS Word (15.8 KB)Supplementary Table 4.docx
Download MS Word (14.9 KB)Supplementary Table 3.docx
Download MS Word (16.3 KB)Sup._Fig._1_VHOD_box_plots.jpeg
Download JPEG Image (245.5 KB)
Supplementary Table 2.docx
Download MS Word (14.7 KB)Acknowledgements
The authors thank our colleagues at the Helmholtz Centre for Environmental Research (UFZ) for their valuable exchanges during the course of the study. We also thank Dr. Ian Jones for his advice during the writing process.
Disclosure statement
No potential conflict of interest was reported by the author(s).
Additional information
Funding
References
- Adrian R, Mischke U, Stellmacher R, Lederer P. 1995. A long-term study of the heiligensee (1975–1992). Evidence for effects of climatic change on the dynamics of eutrophied lake ecosystems. Arch Hydrobiol. 133:315–337.
- Anderson EJ, Stow CA, Gronewold AD, Mason LA, McCormick MJ, Qian SS, Ruberg SA, Beadle K, Constant SA, Hawley N. 2021. Seasonal overturn and stratification changes drive deep-water warming in one of Earth’s largest lakes. Nat Commun. 12(1):1688.
- Arvola L, George G, Livingstone DM, Järvinen M, Blenckner T, Dokulil MT, Jennings E, Aonghusa CN, Nõges P, Nõges T. 2010. The impact of the changing climate on the thermal characteristics of lakes. In: George G, editor. The impact of climate change on European lakes. Berlin: Springer; p. 85–101.
- Axler RP, Larsen C, Tikkanen CA, McDonald ME, Host GE. 1992. Limnological assessment of mine pit lakes for aquaculture use. NRRI Technical Report, NRRI/TR-92-03. Duluth (MN): University of Minnesota, Natural Resources Research Institute.
- Beaulieu JJ, DelSontro T, Downing JA. 2019. Eutrophication will increase methane emissions from lakes and impoundments during the 21st century. Nat Commun. 10(1):1375.
- Bella DA. 1970. Dissolved oxygen variations in stratified lakes. J Sanit Eng Div. 96(5):1129–1146.
- Beutel MW. 2003. Hypolimnetic anoxia and sediment oxygen demand in California drinking water reservoirs. Lake Reservoir Manag. 19(3):208–221.
- Biddanda BA, Weinke AD, Kendall ST, Gereaux LC, Holcomb TM, Snider MJ, Dila DK, Long SA, VandenBerg C, Knapp K. 2018. Chronicles of hypoxia: time-series buoy observations reveal annually recurring seasonal basin-wide hypoxia in Muskegon Lake—a Great Lakes estuary. J Gt Lakes Res. 44(2):219–229.
- Blumberg AF, Di Toro DM. 1990. Effects of climate warming on dissolved oxygen concentrations in Lake Erie. Trans Am Fish Soc. 119(2):210–223.
- Bocaniov SA, Ullmann C, Rinke K, Lamb KG, Boehrer B. 2014. Internal waves and mixing in a stratified reservoir: insights from three-dimensional modeling. Limnologica. 49:52–67.
- Boehrer B, Jordan S, Leng P, Waldemer C, Schwenk C, Hupfer M, Schultze M. 2021. Gas pressure dynamics in small and mid-size lakes. Water. 13(13):1824.
- Boehrer B, Schultze M. 2008. Stratification of lakes. Rev Geophys. 46(2):RG2005.
- Borowiak D, Nowiński K, Barańczuk J, Marszelewski W, Skowron R, Solarczyk A. 2011. Relationship between areal hypolimnetic oxygen depletion rate and the trophic state of five lakes in northern Poland. Limnol Rev. 11(4):135–142.
- Bouffard D, Ackerman JD, Boegman L. 2013. Factors affecting the development and dynamics of hypoxia in a large shallow stratified lake: hourly to seasonal patterns. Water Resour Res. 49(5):2380–2394.
- Brothers S, Köhler J, Attermeyer K, Grossart H-P, Mehner T, Meyer N, Scharnweber K, Hilt S. 2014. A feedback loop links brownification and anoxia in a temperate, shallow lake. Limnol Oceanogr. 59(4):1388–1398.
- Burns N, Ross C. 1972. Oxygen-nutrient relationships within the central basin of Lake Erie. In: Burns NM, Ross C, editors. Project Hypo—an intensive study of the Lake Erie central basin hypolimnion and related surface water phenomena. Canadian Center for Inland Waters Paper 6, and US Environmental Protection Agency, Tech. Rep. TS-05 1-71-208-24; p 85–119.
- Burns NM. 1995. Using hypolimnetic dissolved oxygen depletion rates for monitoring lakes. N Z J Mar Freshw Res. 29(1):1–11.
- Burns NM, Rockwell DC, Bertram PE, Dolan DM, Ciborowski JJ. 2005. Trends in temperature, Secchi depth, and dissolved oxygen depletion rates in the central basin of Lake Erie, 1983–2002. J Great Lakes Res. 31:35–49.
- Butts T, Evans R. 1977. The art and science of measuring sediment oxygen demand in the field. Unpublished mimeo presented at AMSA-MSD Water Quality Conference, Chicago (IL), 20–22 Apr 1977.
- Butts TA. 1978. Sediment oxygen demand studies of selected northeastern Illinois streams. Chicago (IL): Illinois State Water Survey. Circular no 129.
- Carey CC, Ibelings BW, Hoffmann EP, Hamilton DP, Brookes JD. 2012. Eco-physiological adaptations that favour freshwater cyanobacteria in a changing climate. Water Res. 46(5):1394–1407.
- Carlson RE. 1977. A trophic state index for lakes. Limnol Oceanogr. 22(2):361–369.
- Coats R, Perez-Losada J, Schladow G, Richards R, Goldman C. 2006. The warming of Lake Tahoe. Clim Change. 76(1–2):121–148.
- Conroy JD, Boegman L, Zhang H, Edwards WJ, Culver DA. 2011. “Dead zone” dynamics in Lake trie: the importance of weather and sampling intensity for calculated hypolimnetic oxygen depletion rates. Aquat Sci. 73(2):289–304.
- Cooke GD, Welch EB, Peterson S, Nichols SA, editors. 2005. Restoration and management of lakes and reservoirs. 3rd ed. Boca Raton (FL): CRC press.
- Cornett JL. 1982. Prediction and interpretation of rates of hypolimnetic oxygen depletion [dissertation]. Montreal (QC): McGill University.
- Couture RM, de Wit HA, Tominaga K, Kiuru P, Markelov I. 2015. Oxygen dynamics in a boreal lake responds to long-term changes in climate, ice phenology, and doc inputs. J Geophys Res Biogeosci. 120(11):2441–2456.
- Denkenberger JS, Driscoll CT, Effler SW, O’Donnell DM, Matthews DA. 2007. Comparison of an urban lake targeted for rehabilitation and a reference lake based on robotic monitoring. Lake Reservoir Manag. 23(1):11–26.
- Diaz RJ, Rosenberg R. 2008. Spreading dead zones and consequences for marine ecosystems. Science. 321(5891):926–929.
- Dokulil MT, Jagsch A, George GD, Anneville O, Jankowski T, Wahl B, Lenhart B, Blenckner T, Teubner K. 2006. Twenty years of spatially coherent deepwater warming in lakes across Europe related to the North Atlantic Oscillation. Limnol Oceanogr. 51(6):2787–2793.
- Dong F, Mi C, Hupfer M, Lindenschmidt KE, Peng W, Liu X, Rinke K. 2020. Assessing vertical diffusion in a stratified lake using a three-dimensional hydrodynamic model. Hydrol Processes. 34(5):1131–1143.
- Dubois N, Saulnier-Talbot É, Mills K, Gell P, Battarbee R, Bennion H, Chawchai S, Dong X, Francus P, Flower R. 2018. First human impacts and responses of aquatic systems: a review of paleolimnological records from around the world. Anth Rev. 5(1):28–68.
- Edmondson W. 1961. Changes in Lake Washington following an increase in the nutrient income: with 5 figures and 2 tables in the text. SIL Proc 1922–2010. 14(1):167–175.
- Encinas Fernández J, Peeters F, Hofmann H. 2014. Importance of the autumn overturn and anoxic conditions in the hypolimnion for the annual methane emissions from a temperate lake. Environ Sci Technol. 48(13):7297–7304.
- European Commission. 2000. Directive 2000/60/EC of the European parliament and of the council establishing a framework for the community action in the field of water policy. OJ L327, 22.12.2000.
- Evans DO, Nicholls KH, Allen YC, McMurtry MJ. 1996. Historical land use, phosphorus loading, and loss of fish habitat in Lake Simcoe, Canada. Can J Fish Aquat Sci. 53(S1):194–218.
- Fang X, Stefan HG. 2009. Simulations of climate effects on water temperature, dissolved oxygen, and ice and snow covers in lakes of the contiguous U.S. under past and future climate scenarios. Limnol Oceanogr. 54(6 part 2):2359–2370.
- Ficker H, Luger M, Gassner H. 2017. From dimictic to monomictic: Empirical evidence of thermal regime transitions in three deep alpine lakes in Austria induced by climate change. Freshw Biol. 62(8):1335–1345.
- Foley B, Jones ID, Maberly SC, Rippey B. 2012. Long-term changes in oxygen depletion in a small temperate lake: effects of climate change and eutrophication. Freshw Biol. 57(2):278–289.
- Foley JA, DeFries R, Asner GP, Barford C, Bonan G, Carpenter SR, Chapin FS, Coe MT, Daily GC, Gibbs HK. 2005. Global consequences of land use. Science. 309(5734):570–574.
- Gibbs M. 1992. Influence of hypolimnetic stirring and underflow on the limnology of Lake Rotoiti, New Zealand. N Z J Mar Freshw Res. 26(3–4):453–463.
- Göncü S, Albek E. 2019. An integrated approach to assess the ecological and chemical status of lakes with HOD/AHOD: a case study of two lakes. J Oceanol Limnol. 37(1):146–159.
- Gregersen R, Howarth JD, Wood SA, Vandergoes MJ, Puddick J, Moy C, Li X, Pearman JK, Moody A, Simon KS. 2022. Resolving 500 years of anthropogenic impacts in a mesotrophic lake: nutrients outweigh other drivers of lake change. Environ Sci Technol. 56(23):16940–16951.
- Gudasz C, Bastviken D, Steger K, Premke K, Sobek S, Tranvik LJ. 2010. Temperature-controlled organic carbon mineralization in lake sediments. Nature. 466(7305):478–481.
- Hanson PC, Carpenter SR, Armstrong DE, Stanley EH, Kratz TK. 2006. Lake dissolved inorganic carbon and dissolved oxygen: changing drivers from days to decades. Ecol Monogr. 76(3):343–363.
- Ho JC, Michalak AM, Pahlevan N. 2019. Widespread global increase in intense lake phytoplankton blooms since the 1980s. Nature. 574(7780):667–670.
- Huntington TG. 2006. Evidence for intensification of the global water cycle: review and synthesis. J Hydrol. 319(1–4):83–95.
- Hutchinson GE. 1957. A treatise on limnology. Vol 1: Geography, physics and chemistry. Hoboken (NJ): John Wiley & Sons.
- Imboden D, Joller T. 1984. Turbulent mixing in the hypolimnion of Baldeggersee (Switzerland) traced by natural radon-2221. Limnol Oceanogr. 29(4):831–844.
- Imboden DM. 1973. Limnologische transport-und nährstoffmodelle [Limnological transport and nutrient models]. Schweiz Z Hydrol. 35(1):29–68.
- Jane SF, Hansen GJ, Kraemer BM, Leavitt PR, Mincer JL, North RL, Pilla RM, Stetler JT, Williamson CE, Woolway RI. 2021. Widespread deoxygenation of temperate lakes. Nature. 594(7861):66–70.
- Jane SF, Mincer JL, Lau MP, Lewis AS, Stetler JT, Rose KC. 2022. Longer duration of seasonal stratification contributes to widespread increases in lake hypoxia and anoxia. Global Change Biol. 29(10):1009–1023.
- Jankowski T, Livingstone DM, Bührer H, Forster R, Niederhauser P. 2006. Consequences of the 2003 European heat wave for lake temperature profiles, thermal stability, and hypolimnetic oxygen depletion: implications for a warmer world. Limnol Oceanogr. 51(2):815–819.
- Jenny JP, Francus P, Normandeau A, Lapointe F, Perga ME, Ojala A, Schimmelmann A, Zolitschka B. 2016. Global spread of hypoxia in freshwater ecosystems during the last three centuries is caused by rising local human pressure. Global Change Biol. 22(4):1481–1489.
- Jeppesen E, Kronvang B, Meerhoff M, Søndergaard M, Hansen KM, Andersen HE, Lauridsen TL, Liboriussen L, Beklioglu M, Özen A. 2009. Climate change effects on runoff, catchment phosphorus loading and lake ecological state, and potential adaptations. J Environ Qual. 38(5):1930–1941.
- Jónasson P, Lastein E, Rebsdorf A. 1974. Production, insolation, and nutrient budget of eutrophic Lake Esrom. Oikos. 25(3):255–277.
- Jones ID, Winfield IJ, Carse F. 2008. Assessment of long-term changes in habitat availability for Arctic charr (Salvelinus alpinus) in a temperate lake using oxygen profiles and hydroacoustic surveys. Freshw Biol. 53(2):393–402.
- Kerekes JJ. 1974. Limnological conditions in five small oligotrophic lakes in Terra Nova National Park, Newfoundland. J Fish Res Board Can. 31(5):555–583.
- Knutti R, Sedláček J. 2013. Robustness and uncertainties in the new cmip5 climate model projections. Nat Clim Change. 3(4):369–373.
- Kong X, Ghaffar S, Determann M, Friese K, Jomaa S, Mi C, Shatwell T, Rinke K, Rode M. 2022. Reservoir water quality deterioration due to deforestation emphasizes the indirect effects of global change. Water Res. 221:118721.
- Kraemer BM, Anneville O, Chandra S, Dix M, Kuusisto E, Livingstone DM, Rimmer A, Schladow SG, Silow E, Sitoki LM. 2015. Morphometry and average temperature affect lake stratification responses to climate change. Geophys Res Lett. 42(12):4981–4988.
- Kreling J, Bravidor J, Engelhardt C, Hupfer M, Koschorreck M, Lorke A. 2017. The importance of physical transport and oxygen consumption for the development of a metalimnetic oxygen minimum in a lake. Limnol Oceanogr. 62(1):348–363.
- LaBounty JF, Burns NM. 2007. Long-term increases in oxygen depletion in the bottom waters of boulder basin, Lake Mead, Nevada-Arizona, USA. Lake Reserv Manag. 23(1):69–82.
- LaBrie R, Hupfer M, Lau MP. 2023. Anaerobic duration predicts biogeochemical consequences of oxygen depletion in lakes. Limnol Ocean Lett. 8(4):666–674.
- Lasenby DC. 1975. Development of oxygen deficits in 14 southern Ontario lakes. Limnol Oceanogr. 20(6):993–999.
- Lee RM, Biggs TW. 2015. Impacts of land use, climate variability, and management on thermal structure, anoxia, and transparency in hypereutrophic urban water supply reservoirs. Hydrobiologia. 745:263–284.
- Livingstone DM. 1997. An example of the simultaneous occurrence of climate-driven “sawtooth” deep-water warming/cooling episodes in several Swiss lakes. Int Verein Theor Angew Limnol Ver. 26(2):822–828.
- Livingstone DM. 2003. Impact of secular climate change on the thermal structure of a large temperate central European lake. Clim Change. 57(1–2):205–225.
- Livingstone DM, Imboden DM. 1996. The prediction of hypolimnetic oxygen profiles: a plea for a deductive approach. Can J Fish Aquat Sci. 53(4):924–932.
- Lucas A, Thomas N. 1972. Sediment oxygen demand in Lake Erie’s central basin, 1970. In: Burns NM, Ross M, editors. Project Hypo—an intensive study of the Lake Erie central basin hypolimnion and related surface water phenomena. USEPA Tech Report TS-05-71208-24.
- Maheaux H, Leavitt PR, Jackson LJ. 2016. Asynchronous onset of eutrophication among shallow prairie lakes of the northern Great Plains, Alberta, Canada. Global Change Biol. 22(1):271–283.
- Marcus NH. 2001. Zooplankton: responses to and consequences of hypoxia. In: Rabalais NN, Turner RE, editors. Coastal hypoxia: consequences for living resources and ecosystems. Washington (DC): American Geophysical Union; p. 49–60.
- Marotta H, Pinho L, Gudasz C, Bastviken D, Tranvik LJ, Enrich-Prast A. 2014. Greenhouse gas production in low-latitude lake sediments responds strongly to warming. Nat Clim Change. 4(6):467–470.
- Matthews DA, Effler SW. 2006. Long-term changes in the areal hypolimnetic oxygen deficit (AHOD) of Onondaga Lake: evidence of sediment feedback. Limnol Oceanogr. 51(1 part 2):702–714.
- Mi C, Shatwell T, Ma J, Xu Y, Su F, Rinke K. 2020. Ensemble warming projections in Germany’s largest drinking water reservoir and potential adaptation strategies. Sci Total Environ. 748:141366.
- Michalski M, Johnson M, Veal D, Brydges T. 1973. Muskoka lakes water quality evaluation. Rpt. No. 3, Eutrophication of the Muskoka Lakes. Toronto (ON): Ontario Ministry of the Environment, Water Resources Branch.
- Mitchell S, Burns CW. 1979. Oxygen consumption in the epilimnia and hypolimnia of two eutrophic, warm-monomictic lakes. N Z J Mar Freshw Res. 13(3):427–441.
- Molot L, Dillon P, Clark B, Neary B. 1992. Predicting end-of-summer oxygen profiles in stratified lakes. Can J Fish Aquat Sci. 49(11):2363–2372.
- Moss B, Kosten S, Meerhoff M, Battarbee RW, Jeppesen E, Mazzeo N, Havens K, Lacerot G, Liu Z, De Meester L. 2011. Allied attack: climate change and eutrophication. Inland Waters. 1(2):101–105.
- Müller B, Bryant LD, Matzinger A, Wüest A. 2012. Hypolimnetic oxygen depletion in eutrophic lakes. Environ Sci Technol. 46(18):9964–9971.
- Nicholls KH. 1976. Comparative limnology of Harp and Jerry Lakes, adjacent cottaged and uncottaged lakes on southern Ontario's Precambrian Shield. Toronto (ON): Ontario Ministry of the Environment, Water Resources Branch.
- North RP, Livingstone DM, Hari RE, Köster O, Niederhauser P, Kipfer R. 2013. The physical impact of the late 1980s climate regime shift on Swiss Rivers and lakes. Inland Waters. 3(3):341–350.
- North RP, North RL, Livingstone DM, Köster O, Kipfer R. 2014. Long-term changes in hypoxia and soluble reactive phosphorus in the hypolimnion of a large temperate lake: consequences of a climate regime shift. Global Change Biol. 20(3):811–823.
- Nürnberg GK. 2002. Quantification of oxygen depletion in lakes and reservoirs with the hypoxic factor. Lake Reserv Manag. 18(4):299–306.
- Palmer ME, Yan ND, Somers KM. 2014. Climate change drives coherent trends in physics and oxygen content in North American lakes. Clim Change. 124:285–299.
- Pilla RM, Couture RM. 2021. Attenuation of photosynthetically active radiation and ultraviolet radiation in response to changing dissolved organic carbon in browning lakes: modeling and parametrization. Limnol Oceanogr. 66(6):2278–2289.
- Pilla RM, Williamson CE, Adamovich BV, Adrian R, Anneville O, Chandra S, Colom-Montero W, Devlin SP, Dix MA, Dokulil MT. 2020. Deeper waters are changing less consistently than surface waters in a global analysis of 102 lakes. Sci Rep. 10(1):20514.
- Pilla RM, Williamson CE. 2022. Earlier ice breakup induces changepoint responses in duration and variability of spring mixing and summer stratification in dimictic lakes. Limnol Oceanogr. 67:S173–S183.
- Plumb JM, Blanchfield PJ. 2009. Performance of temperature and dissolved oxygen criteria to predict habitat use by lake trout (Salvelinus namaycush). Can J Fish Aquat Sci. 66(11):2011–2023.
- Pollock M, Clarke L, Dubé M. 2007. The effects of hypoxia on fishes: from ecological relevance to physiological effects. Environ Rev. 15(NA):1–14.
- R Core Team. 2021. R: a language and environment for statistical computing. Vienna, Austria: R foundation for statistical computing.
- Rhodes J, Hetzenauer H, Frassl MA, Rothhaupt K-O, Rinke K. 2017. Long-term development of hypolimnetic oxygen depletion rates in the large Lake Constance. Ambio. 46(5):554–565.
- Richardson DC, Melles SJ, Pilla RM, Hetherington AL, Knoll LB, Williamson CE, Kraemer BM, Jackson JR, Long EC, Moore K. 2017. Transparency, geomorphology and mixing regime explain variability in trends in lake temperature and stratification across northeastern North America (1975–2014). Water. 9(6):442.
- Rippey B, McSorley C. 2009. Oxygen depletion in lake hypolimnia. Limnol Oceanogr. 54(3):905–916.
- Roberts JJ, Höök TO, Ludsin SA, Pothoven SA, Vanderploeg HA, Brandt SB. 2009. Effects of hypolimnetic hypoxia on foraging and distributions of Lake Erie yellow perch. J Exp Mar Biol Ecol. 381:S132–S142.
- Rogora M, Buzzi F, Dresti C, Leoni B, Lepori F, Mosello R, Patelli M, Salmaso N. 2018. Climatic effects on vertical mixing and deep-water oxygen content in the subalpine lakes in Italy. Hydrobiologia. 824:33–50.
- Rosa F, Burns NM. 1987. Lake Erie central basin oxygen depletion changes from 1929–1980. J Great Lakes Res. 13(4):684–696.
- Rose KC, Winslow LA, Read JS, Hansen GJ. 2016. Climate-induced warming of lakes can be either amplified or suppressed by trends in water clarity. Limnol Ocean Lett. 1(1):44–53.
- Rutherford J, Dumnov S, Ross A. 1996. Predictions of phosphorus in Lake Rotorua following load reductions. N Z J Mar Freshw Res. 30(3):383–396.
- Salisbury FB, Ross CW. 1978. Plant physiology. Belmont (CA): Wadsworth Publishers.
- Santhi C, Arnold JG, Williams JR, Dugas WA, Srinivasan R, Hauck LM. 2001. Validation of the SWAT model on a large river basin with point and nonpoint sources. J Am Wat Res Assoc. 37(5):1169–1188.
- Schwefel R, Steinsberger T, Bouffard D, Bryant LD, Müller B, Wüest A. 2018. Using small-scale measurements to estimate hypolimnetic oxygen depletion in a deep lake. Limnol Oceanogr. 63(S1):S54–S67.
- Shapiro J. 1960. The cause of a metalimnetic minimum of dissolved oxygen 1. Limnol Oceanogr. 5(2):216–227.
- Shatwell T, Thiery W, Kirillin G. 2019. Future projections of temperature and mixing regime of European temperate lakes European temperate lakes. Hydrol Earth Syst Sci. 23(3):1533–1551.
- Spoor W. 1990. Distribution of fingerling brook trout, Salvelinus fontinalis (Mitchill), in dissolved oxygen concentration gradients. J Fish Biol. 36(3):363–373.
- Stadelmann P. 1971. Stickstoffkreislauf und primärproduktion im mesotrophen Vierwaldstättersee (Horwer Bucht) und im eutrophen Rotsee, mit besonderer berücksichtigung des nitrats als limitierenden factors [Nitrogen cycle and primary production in the mesotrophic Lake Lucerne (Horwer Bucht) and the eutrophic Rotsee, with special consideration of nitrate as a limiting factor]. Schweiz Z Hydrol. 33(1):1–65.
- St. John B, Carmack E, Daley R, Gray C, Pharo C. 1976. The limnology of Kamloops Lake, British Columbia. Vancouver (BC): Environment Canada: Inland Waters Directorate Pacific and Yukon Region.
- Steinsberger T, Müller B, Gerber C, Shafei B, Schmid M. 2019. Modeling sediment oxygen demand in a highly productive lake under various trophic scenarios. PLoS One. 14(10):e0222318.
- Steinsberger T, Schwefel R, Wüest A, Müller B. 2020. Hypolimnetic oxygen depletion rates in deep lakes: effects of trophic state and organic matter accumulation. Limnol Oceanogr. 65(12):3128–3138.
- Steinsberger T, Wüest A, Müller B. 2021. Net ecosystem production of lakes estimated from hypolimnetic organic carbon sinks. Water Resour Res. 57(5):e2020WR029473.
- Straile D, Jöhnk K, Henno R. 2003. Complex effects of winter warming on the physicochemical characteristics of a deep lake. Limnol Oceanogr. 48(4):1432–1438.
- Trolle D, Hamilton DP, Pilditch CA, Duggan IC, Jeppesen E. 2011. Predicting the effects of climate change on trophic status of three morphologically varying lakes: implications for lake restoration and management. Environ Model Softw. 26(4):354–370.
- Turner RE, Rabalais NN, Swenson E, Kasprzak M, Romaire T. 2005. Summer hypoxia in the northern Gulf of Mexico and its prediction from 1978 to 1995. Mar Environ Res. 59(1):65–77.
- Van Bocxlaer B, Schultheiss R, Plisnier PD, Albrecht C. 2012. Does the decline of gastropods in deep water herald ecosystem change in lakes Malawi and Tanganyika? Freshw Biol. 57(8):1733–1744.
- Vant W. 1987. Hypolimnetic dissolved oxygen: survey and interpretation. Wellington (New Zealand): Lake Managers Handbook NWASCA.
- Vaquer-Sunyer R, Duarte CM. 2008. Thresholds of hypoxia for marine biodiversity. Proc Natl Acad Sci USA. 105(40):15452–15457.
- Vincent W, Gibbs M, Dryden S. 1984. Accelerated eutrophication in a New Zealand lake: Lake Rotoiti, central North Island. N Z J Mar Freshw Res. 18(4):431–440.
- Von Zimmerman U. 1969. Okologische und physiologische untersucnungen un der plaktiaehen blaralge Oseillatorla rubescens D. C. inter besonderer berucksichtigung von lieht und temperatur [Ecological and physiological studies on the plaktiae algae Oseillatorla rubescens D. C. with special consideration of light and temperature]. Schweiz Z Hydrol. 38:71–96.
- Von Zimmermann U, Suter-Weider P. 1976. Beiträge zur limnologie des walen-, zürich-ober-und zürichsees [Contributions to the limnology of Lake Walen and Lake Zurich]. Schweiz Z Hydrol. 38(2):71–96.
- Wetzel RG. 2001. Limnology: lake and river ecosystems. Houston (TX): Gulf Publishing.
- Winder M, Schindler DE. 2004. Climatic effects on the phenology of lake processes. Global Change Biol. 10(11):1844–1856.
- Winslow LA, Read JS, Hansen GJ, Hanson PC. 2015. Small lakes show muted climate change signal in deepwater temperatures. Geophys Res Lett. 42(2):355–361.
- Woolway RI, Kraemer BM, Lenters JD, Merchant CJ, O’Reilly CM, Sharma S. 2020. Global lake responses to climate change. Nat Rev Earth Env. 1(8):388–403.
- Woolway RI, Merchant CJ. 2019. Worldwide alteration of lake mixing regimes in response to climate change. Nat Geosci. 12(4):271–276.
- Woolway RI, Sharma S, Weyhenmeyer GA, Debolskiy A, Golub M, Mercado-Bettín D, Perroud M, Stepanenko V, Tan Z, Grant L. 2021. Phenological shifts in lake stratification under climate change. Nat Commun. 12(1):2318.