
ABSTRACT
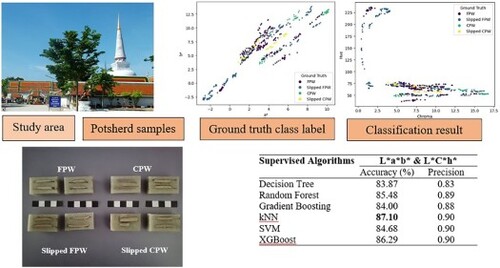
Potsherds from Phra Mahathat Woramahawihan, a revered Buddhist temple in Thailand’s Nakhon Si Thammarat Province, were studied in the context of maritime Southeast Asia and local craftsmanship during the thirteenth–fourteenth century. The CIE L*a*b* and CIE L*C*h* colors of fine- and coarse-paste wares were analyzed using unsupervised and supervised machine learning algorithms. An illustrative example demonstrated the classification capability and cluster prediction. The example showed that supervised machine learning algorithms effectively discriminated between classes with similar characteristics, making colorimetry classification feasible. The kNN classifier achieved an overall accuracy of 87.10%, with high precision measurements (0.90). The supervised approach outperformed in color recognition and classification accuracy for the L*C*h* and combination of L*a*b* and L*C*h*. This strong inter-site discrimination capability is valuable in pottery research. The significantly lower color values of potsherds from Phra Mahathat Woramahawihan temple suggest multiple earthenware production sites in peninsular Thailand during the thirteenth–fourteenth century.
GRAPHICAL ABSTRACT
1. Introduction
Phra Mahathat Woramahawihan temple, or Wat Phra That as the local people would call it, is highly revered by Buddhists in Nakhon Si Thammarat Province in southern Thailand. It has been the longest-living religious site in peninsular Thailand, the improbable thin ribbon of land between the Indian and Pacific Oceans, where travelers traversed, and trading polities eventually developed in the late centuries BCE. At the center of this temple stands the Great Reliquary, which is the largest stupa in peninsular Thailand and in which the local chronicles proclaim that the very relics of the Buddha were enshrined by the legendary righteous king (Noonsuk Citation2022). This reliquary magnificently rises 55.78 meters in height, topped with a finial wrapped around with approximately 600 kilograms of gold sheets. A series of excavations produced thermoluminescence (TL) dates that point to the initial construction of the Great Reliquary around the second half of the ninth–tenth century (Noonsuk Citation2018; Ueasaman Citation2017).
It is notable that this temple and the sacred place it occupies has a long history. Within the monastery precinct itself, three square yonis and stone architectural parts, probably related to Hindu shrines dated to circa the seventh–eighth century, have been discovered. Only 650 meters from the temple to the south, an ancient brick foundation with a TL date of around the eighth–ninth century was found at Thao Khot temple. Nevertheless, the increase of population and Chinese ceramic consumption in this general area seems to take place around the thirteenth century, coinciding with the major restoration of the Great Reliquary with the Sri Lankan artistic influences (Noonsuk Citation2018; Citation2022; Ueasaman Citation2017).
Ceramic fragments are among the most common artifacts discovered during archaeological excavations. Archaeometry, encompassing provenance and production investigations of materials (Casas et al. Citation2023), can provide insights into age, technology, and cultural relationships by identifying local and imported productions at archaeological sites (Anglisano et al. Citation2022). To establish patterns of exploitation, trade routes, tool manufacturing, and the distribution of products in ancient periods, correctly assigning archaeological artifacts to their original geological sources is essential (López-García et al. Citation2024).
From at least the thirteenth century, if not earlier, earthenware was extensively traded across maritime Southeast Asia, connecting regions encompassing present-day peninsular Thailand, northern Sumatra and Java of Indonesia, and the southern Philippines (Miksic and Yap Citation1988). Akin to the classification of potteries found in Nueva Esperanza, El Salvador (Ichikawa, Kanegae, and Nanamura Citation2021), the clay texture of maritime Southeast Asia’s earthenware varied between coarse-paste ware (CPW) and fine-paste ware (FPW). Fine-paste ware was characterized by its wheel-made production using fine clay, sometimes incorporating Kaolin, and lacking any visible temper. The tempering, often found in archaeological ceramics in other continents (Chaves, Veiga, and Soares Citation2022; Mika et al. Citation2023; Morandi and Amicone Citation2023; Pérez-Monserrat et al. Citation2023), reduces possible crack propagation but the limited technology and costs may be the reason for its absence in some earthenware. The firing took place in an oxidizing atmosphere, and in some cases, the slip (colored liquid clay) was applied before firing as a surface decoration.
During the tenth–fourteenth century, the predominant form of fine-paste ware was the kendi, a Malay term referring to an ewer or globular vessel with a spout for pouring liquid, usually water (Miksic and Yap Citation1988). The clay composition allowed for the classification of fine-paste ware into red-slipped fine-paste ware produced in Java of Indonesia and Kaolin-rich white fine-paste ware with Sathing Phra in present-day Songkhla Province of Thailand, being a probable production center (Ueda et al. Citation2017). While Sathing Phra has been regarded as the sole production center in peninsular Thailand due to the discovery of Pa-O kilns (Srisuchat Citation2003), emerging research suggests the possibility of fine-paste ware production in other areas, including Nakhon Si Thammarat Province (Jutimoosik et al. Citation2017; Ueda et al. Citation2017), warranting further scientific investigation.
Color holds significant importance in ceramics, serving as a distinctive attribute linked to their provenance and production. Earthenware’s color varies depending on the ingredients of the clay, firing time, and conditions. However, color measurements can be affected by lighting conditions and various other parameters, thereby imposing limitations (Plutino and Simone Citation2021). Despite these challenges, comparative colorimetry has proven effective in the classification of stained glass (Capobianco et al. Citation2021), glazed tiles (Fahim, Ghasemi, and Hosseini-Zori Citation2023), and has been instrumental in heritage restoration, as exemplified by Prieto et al. (Citation2011). The application of digital image colorimetry using digital cameras has gained prominence in cultural heritage studies (Milotta et al. Citation2018; Sanmartín et al. Citation2014). Additionally, smartphone-based colorimetry has been employed for the analysis of siliceous artifacts (Ramacciotti et al. Citation2023) and fine-paste ware from seven archaeological sites across India and Southeast Asia, including the Phra Mahathat Woramahawihan temple (Sirisathitkul et al. Citation2020).
In the past decade, artificial intelligence has become increasingly prevalent in archaeological research (Mantovan and Nanni Citation2020). For machine learning and classification, provenance studies typically analyze petrographic data using methods such as principal component analysis, hierarchical cluster analysis, and other unsupervised clustering methods. Other kinds of data, including spectroscopic profiles and visible colors, could be used in unsupervised and supervised classifications to differentiate archaeological ceramics based on their provenance and production technologies (Anglisano et al. Citation2022). For example, archaeological ceramics from Kastrouli, Central Greece, were analyzed for their color index chromatic scale using distinct RGB, HSB, and L*a*b* color components through unsupervised methods (Bratitsi et al. Citation2018). Unlike unsupervised methods, supervised machine learning algorithms utilize previously labeled data to classify unlabeled data. These models have successfully discriminated three sets of archaeological marbles from different sites in Catalonia, Spain (Casas et al. Citation2023). Ruschioni et al. (Citation2023) employed supervised machine learning algorithms to classify ancient potteries based on chemical analysis data. Based on X-ray data from archaeological feature soils and regional background soils, geochemical values were predicted using supervised machine learning methods (Oonk and Spijker Citation2015). Furthermore, the Random Forest algorithm has been employed to quantify archaeological site deterioration, offering an innovative and cost-effective approach to assessing the remains of historically recorded archaeological landscapes in Peru (Payntar Citation2023).
In this study, the colors of 50 fine-paste ware and 12 coarse-paste ware samples excavated from the Phra Mahathat Woramahawihan temple are compared, alongside four fine-paste ware samples from Sathing Phra dated to the same period. Such a larger number of potsherds from the temple are parts of kendi and other types of vessels (Ueda et al. Citation2017). The colors were measured according to the CIE L*a*b* and CIE L*C*h* color spaces, consistent with previous potsherd characterizations (Gebremariam et al. Citation2022; Sirisathitkul et al. Citation2020). This colorimetric analysis using unsupervised and supervised machine learning algorithms will complement the existing petrographic and X-ray analyses of maritime Southeast Asia’s earthenware (Jutimoosik et al. Citation2017; Ueda et al. Citation2017), contributing to the understanding of their provenance and production.
2. Materials and methods
2.1. Earthenware from Phra Mahathat Woramahawihan temple
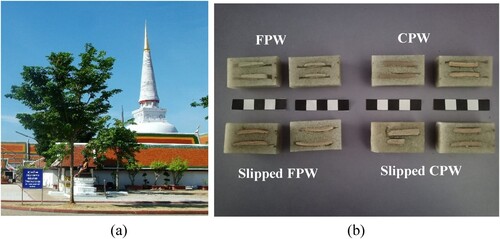
In 2009, an archaeological excavation led by W. Noonsuk was conducted at Phra Mahathat Woramahawihan temple in Nakhon Si Thammarat Province of Thailand (8°24’41″N 99°58’00″E) ((a)). This excavation unearthed various artifacts, including bricks, earthenware, and porcelain sherds discovered in multiple test pits. This study included 50 fine-paste ware (FPW) and 12 coarse-paste ware (CPW) samples from Basket 7 of Pit PT.09.04. The latest datable artifacts in this basket were the Chinese porcelains dating from the late Southern Song to the early Yuan Dynasties, approximately from the middle to late thirteenth century (Noonsuk Citation2018). For cross-sectional analyses, the potsherds were mounted using epoxy, with each epoxy block containing two samples, as exemplified in (b). Among the coarse-paste ware, four samples were discovered with slips, while the remaining eight samples were devoid of any slip. Within the 50 remaining fine-paste ware samples, traces of clay slips were detected on 18 samples. Notably, these slipped ceramics originated from the same excavation layer, specifically from Basket 7 of pit PT.09.04, and were dated to the same period.
Figure 1. Images of (a) Phra Mahathat Woramahawihan temple with the Great Reliquary landmark, and (b) examples of fine-paste ware (FPW) and coarse-paste ware (CPW), without and with slips.
2.2. Color measurements
The color analysis of the potsherds was conducted using a portable colorimeter (NH310, 3nh, China). Cross-sectional areas of 8 mm in diameter were subjected to LED blue light excitation, and the reflected colors were captured employing an Illuminating/Viewing Geometry of 8/d. Parameters including darkness to lightness (L: 0–100), greenness to redness (-a* to + a*), blueness to yellowness (-b* to + b*), chroma, and hue based on the CIE L*a*b* and CIE L*C*h* color spaces were derived. The CIE L*a*b* and CIE L*C*h* color space are related but they specify colors using different coordinates. Analyzing both color spaces is occasionally advantageous as demonstrated by Martínez, Calero, and Valeroa (Citation2020). Ten measurements from different areas of each sample were averaged and compared with those of four fine-paste ware samples sourced from Sathing Phra, analyzed using an identical methodology. The cross-section texture of fine-paste ware samples from the two sites were also compared using field-emission scanning electron microscope (FESEM; FEI Quanta 450 FEG) operating at 15 kV.
2.3. Data processing, modeling and class prediction
The color classification utilized the machine learning techniques available in the Google Colab environment using Scikit Learn and Python. In the first stage, the color parameters were grouped into four different clusters using seven clustering methods, i.e. K-means, Spectral, Agglomerative, Mini-Batch K-means, Birch, Gaussian, and Bisecting. Clustering algorithms divide the unlabeled dataset into K separate clusters, with each dataset belonging to only one group that shares similar properties. Here, k denotes the number of predefined clusters that must be established during the procedure; for example, if K = 4, there will be four clusters. K-means is a centroid-based or distance-based algorithm that assigns points to clusters by calculating their distances. Spectral is a variation of the clustering algorithm that clusters data points based on their connection. Agglomerative is a bottom-up method in which each data point is initially considered a cluster and the algorithm then merges clusters based on their similarity.
Mini Batch K-means is a variant of the K-means algorithm that iterates on mini-batches of samples rather than the entire dataset. Birch can cluster huge datasets by first creating a small and compact summary of the dataset that contains as much information as feasible. Gaussian group data points according to their probability distributions. Bisecting is a modification of the K-Means algorithm that creates clusters with a more regular large-scale structure. These methods were tested with the L*a*b*, L*C*h*, and L*a*b* with L*C*h* to identify the most essential color components for each cluster’s well-separation. The unsupervised approaches were utilized to investigate the internal variability and compare the commonalities of the samples.
In the second stage, a number of supervised algorithms were evaluated using a train–test split procedure to determine their performance in classifying and discriminating samples. The training data consisted of 620 records. The randomly 80-20 train–test split used 496 samples to train the models, and only 124 samples were left to test them. After the training, supervised approaches were employed to classify unlabeled samples. The supervised classification models used to predict classes from unlabeled data are as follows.
Decision tree: The model predicts the value of a target variable by learning simple decision rules derived from data attributes.
Random forest: The algorithm relies on a combination of several uncorrelated decision trees working together as an ensemble.
Gradient boosting: The algorithm combines numerous weak learners into strong learners, with each new model trained to minimize the preceding model’s loss function, such as mean squared error or cross-entropy, via gradient descent.
k-nearest neighbors (kNN): The algorithm makes classifications or predictions about the category of an individual data point based on the similarity between the new data and existing classes.
Support vector machine (SVM): The algorithm determines the best hyperplane in an N-dimensional space that can split data points into different classes in the feature space.
eXtreme gradient boosting (XGBoost): The algorithm employs a boosting strategy to generate an extraordinarily accurate ensemble model by having each weak learner repair the errors of its predecessors.
3. Results and discussion
3.1. Cross-sectional texture, color values, and scatter plots
Electron microscopy confirms that the fine-paste ware samples are composed of small-grain clay. illustrates the contrasting cross-sectional textures between a slipped fine-paste ware sample from the Phra Mahathat Woramahawihan temple, which appears smoother, and a fine-paste ware sample from Sathing Phra. In , the color measurements of potsherds from the Phra Mahathat Woramahawihan temple reveal that the average a* and b* values of fine-paste ware samples are notably lower than those of the coarse-paste ware counterparts. Particularly noteworthy is a much higher hue exhibited by the slipped fine-paste ware, accompanied by considerably lower L*, a*, b*, and chroma values. Because the standard deviations in a*, b*, chroma, and hue among these slipped fine-paste ware samples in are significant, the color distribution of all potsherds is further investigated using scatter plots.
Figure 2. Cross-sectional FESEM micrographs of (a) a slipped fine-paste ware sample from the Phra Mahathat Woramahawihan temple and (b) a fine-paste ware sample from Sathing Phra.
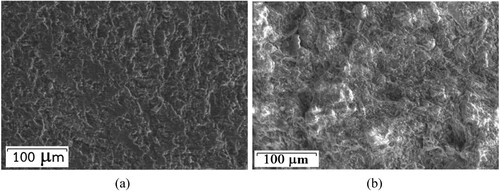
Table 1. Average values and standard deviations of CIE L*C*h* and CIE L*a*b* colors of 62 potsherds from the Phra Mahathat Woramahawihan temple, compared to four fine-paste ware samples from Sathing Phra.
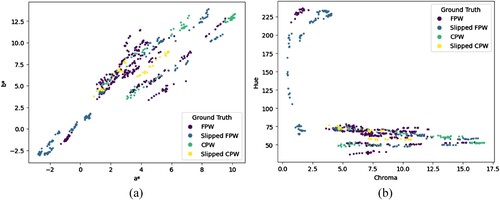
depicts the number of individual data point within a cluster, suggesting that the degree of separation between the clusters appears to be relatively minimal. The scatter plots in (a and b) depict a* against b*, and chroma against hue, respectively. The samples can be roughly categorized into two groups based on these plots. The first group consists exclusively of fine-paste ware, identifiable by their low a* and b* values. Within this group, some samples exhibit negative a* and b* values, along with exceptionally high hue values. In contrast, the second group includes all types of earthenware, with a* values above 1, b* values above 3, and chroma values ranging approximately from 4 to 17. While the colors of fine-paste ware and unslipped coarse-paste ware are scattered throughout this range, the slipped coarse-paste ware samples form a closely grouped cluster characterized by moderate a*, b*, and chroma values, along with elevated hue. Given the similarity of the reference groups based on the color of different earthenware types, the high degree of overlap between fine- and coarse-paste wares in the second group is not surprising. The data are scattered in a cloud across all tested setups, with samples from various reference groups fully intermingled. As a result, classifying the four clusters with only the color components a* and b* or chroma and hue is challenging. The archaeological samples, dispersed rather than closely grouped, could benefit from analysis using machine learning techniques.
Figure 3. Scatter plots of ground truth class label of (a) a* against b* and (b) chroma against hue of fine-paste ware (FPW) and coarse-paste ware (CPW), without and with slips from the Phra Mahathat Woramahawihan temple.
3.2. Clustering approach
When faced with an archaeological challenge, it is often difficult to gather information from a large number of samples due to limited availability. To overcome this, multiple measurements can be taken from a single unique sample to increase the dataset size. In this study, each sample was measured ten times, resulting in a total of 320 measurements for fine-paste ware, 180 for slipped fine-paste ware, 80 for coarse-paste ware, and 40 for slipped coarse-paste ware. Various clustering algorithm setups (L*a*b*, L*C*h*, and combinations of both) were explored. The results of unsupervised clustering algorithms suggest that color data can effectively identify main groupings for further detailed characterization. This approach could aid in selecting samples for destructive analyses and can be seamlessly integrated into the photographic recording process. Additionally, color data can be used alongside chemical data in data analysis.
The accuracy of clustering algorithms is a key factor in evaluating their performance. There are various metrics for measuring accuracy, including the accuracy score, purity, cohesion and separation, the silhouette score, the adjusted Rand index, normalized mutual information, and the Fowlkes-Mallows index. Based on knowing the ground truth of each data point, the accuracy score can be calculated by comparing the anticipated values to the labels. The accuracy_score method in Python’s sklearn.metrics module calculates the percentage of data points that the clustering algorithm accurately assigns to their true labels. presents the accuracy of the seven selected clustering algorithms. Overall, the accuracy was low, with an average score below 50% across all algorithms. Furthermore, the results indicate that combining CIE L*a*b* with CIE L*C*h* increases the clustering algorithm’s performance. When comparing the K-means clustering results with the Birch clustering, illustrates that the samples from the four reference groups were successfully separated. Both Birch and K-means clustering effectively separated most fine- and coarse-paste wares, with and without slips. However, when compared to , which illustrates the ground truth cluster, it was discovered that the clustering algorithms failed to appropriately classify clusters that were path of the same true class. However, it is important to note that unsupervised algorithms, as suggested by Anglisano et al. (Citation2022), can struggle when distinguishing among comparable feature classes.
Figure 4. Scatter plots of (a) Birch clustering of a* against b* and (b) K-means clustering of chroma against hue of fine-paste ware (FPW) and coarse-paste ware (CPW), without and with slips from the Phra Mahathat Woramahawihan temple.
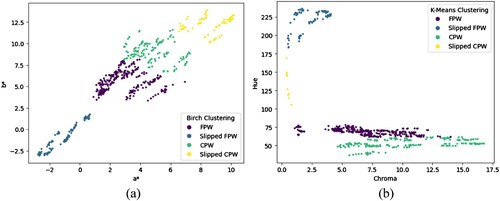
Table 2. Accuracy metric of clustering algorithms for four clusters based on each color component and combination of CIE L*a*b* and CIE L*C*h*.
3.3. Supervised classification models
The dataset was divided into training and testing sets, with 80% allocated to training and 20% to testing. This division ensured that the models were evaluated on unseen data, allowing for a robust assessment of their performance. The evaluation metrics used included accuracy, which measures the proportion of correctly classified instances, and precision, which measures the proportion of correctly classified positive instances out of all instances classified as positive. The supervised classification process consisted of two stages. First, the models were trained on the training set. Then, their performance was evaluated on the testing set. Once the models were successfully trained and evaluated, they were used to classify unlabeled samples. A confusion matrix was then generated to assess the models’ performance, including their accuracies.
presents the accuracy measurements of the six selected supervised models. Overall, the validation accuracy of the algorithms was high, with an average accuracy exceeding 80% across all models. Even the lowest accuracies for all other models were above 75%. The kNN classifier demonstrated an overall accuracy of 87.10%, with high precision (0.90) measurements indicating strong performance. The SVM model exhibited the lowest performance among the models tested, while all other models showed high proficiency in distinguishing between classes. It is notable that models using the L*C*h* color space, as well as combinations of L*a*b* with L*C*h*, consistently outperformed those using the L*a*b* alone. Of all the tested approaches, the supervised approach outperforms all other algorithms examined in terms of color recognition and classification accuracy.
Table 3. Classification results using supervised machine learning algorithms.
While unsupervised algorithms often struggle to categorize unlabeled samples into reference clusters, trained and supervised systems in this study achieve accuracies exceeding 80%. Each training subset creates a trained model, which can then classify unknown data in a subsequent stage. Unlabeled samples are classified based on their likelihood of belonging to different reference groupings. The presented supervised approach demonstrates how, in the context of a highly constrained archaeological classification problem, archaeological hypotheses can be statistically assessed for correctness. While the supervised technique in was effective, the accuracy of prediction outcomes depends on the quality of the labeled sample database. Expanding the dataset size, when feasible in certain archaeological studies (Oonk and Spijker Citation2015), is advantageous. However, this study, along with a prior publication by Ruschioni et al. (Citation2023), has demonstrated the effectiveness of this technique even with a limited dataset size.
3.4. Provenance and production of earthenware
The colors of the slipped and unslipped earthenware pieces are different because the slips contained pigments that distinguish their exterior colors. Additionally, the comparison of cross-sectional color and texture in 3.1–3.3 suggests that the slipped fine-paste ware was crafted using different raw materials and subjected to distinct firing conditions compared to those lacking slips. The X-ray fluorescence analysis, combined with X-ray absorption data, provides evidence-based support for the differences in provenance and production (Jutimoosik et al. Citation2017). The slipped fine-paste ware samples exhibit significantly lower percentages of silica and hematite than other earthenware types from the Phra Mahathat Woramahawihan temple. Some samples also show substantial carbon composition, likely stemming from the ash glazing process (Sirisathitkul et al. Citation2019). Relatively more labor, time, and resources were required to make the slipped earthenware, regarded as prestige goods or a special category of objects. Such items may have been sourced from a production site connected within maritime Southeast Asia. The fact that there is a concentration of slipped earthenware from the Phra Mahathat Woramahawihan temple suggests that this site was an important religious site where special pottery, e.g. kendi, had most likely been used for offerings, ceremonial containers, utensils for monks, and other significant rituals. The discovery of the kendi from the shipwreck provides evidence of the trade of high-quality fine-paste ware in maritime Southeast Asia (Miksic Citation2019).
The unslipped fine-paste ware samples retrieved from the Phra Mahathat Woramahawihan temple exhibit color values akin to those observed in coarse-paste ware. The petrographic study by Ueda et al. (Citation2017) revealed that both the fine- and coarse-paste wares from the maritime Southeast Asia utilized similar clay sources, so the colors highly depend on the firing temperature in the kilns. The congruent colors of unslipped fine- and coarse-paste wares likely stemmed from firing at comparable temperature, perhaps even in the same kilns. The pottery makers were evidently “skillful” in producing pottery with consistent colors indicating the control to attain the desired temperature, time and time again. It also signifies the robustness of the pottery-making tradition, demonstrating a strong lineage of trained artisans with adept control over the process.
also shows average color values of white fine-paste ware from Sathing Phra, known for Kaolin-rich raw materials (Ueda et al. Citation2017). Four potsherds display markedly elevated L*, a*, b*, and chroma values. Such a marked difference, in line with the previous smartphone colorimetry of earthenware from Kota China in Indonesia, Otein Taung in Myanmar, and Periyapattinam in India (Sirisathitkul et al. Citation2020), confirms a distinct color range of fine- and coarse-paste wares from the Phra Mahathat Woramahawihan temple. Although no kilns have been discovered in Nakhon Si Thammarat, it can be argued that at least one “local” workshop in this vicinity seems to have proficiency in crafting both fine- and coarse-paste wares and consistently achieving optimal firing temperatures within their kilns. Thus, the local potters had the skills to make both high- and low-quality products, meeting diverse demands and suggesting craft diversification that would help them more resilient in coping with the market fluctuation if that occurred (Balkansky and Croissier Citation2009).
The ancient city of Nakhon Si Thammarat was a sufficiently large and rich market for the skillful potters to produce earthenware locally. In around the thirteenth–fourteenth century, the fine-paste ware potters themselves might also have migrated from Sathing Phra (about 146 kilometers apart), where fine-paste ware was manufactured first in peninsular Thailand. Although the ancient Nakhon Si Thammarat city could produce its own earthenware, there were also some fine-paste wares imported from Sathing Phra or other production sites, perhaps because it was considered having a higher quality or status (Noonsuk Citation2018).
4. Conclusions
Supervised machine learning techniques exhibited significant capability in discriminating archaeological ceramics. The application could be extended to similar classification challenges in cultural heritage studies, using a consistent train and test protocol to develop high-accuracy models for classifying unlabeled samples. In this study, the viability of this approach was demonstrated on 62 potsherds excavated from the Phra Mahathat Woramahawihan temple, a central monastery of the ancient city of Nakhon Si Thammarat. The supervised machine learning modeling applied to the color data enabled discrimination between fine- and coarse-paste wares, both with and without slips. Different models, using train-test splits, were successfully trained to discriminate between colors from the four classes, achieving accuracies generally above 80%. The results show that 32 fine- and eight coarse-paste ware samples without slips exhibit comparable values of chroma, hue, and L*a*b* colors. The current study is a step toward incorporating color data and machine learning into archeological prediction modeling. The obtained results demonstrate that machine learning can be reliable and effective in archaeological applications, even when constrained by the size of the dataset. Nevertheless, additional samples should be included in the dataset in future study.
These moderate color variations suggest that both types shared a production origin in the same workshop, with comparable firing temperatures, reflecting the skills of potters in achieving consistent temperatures in the kilns. In contrast, the provenance and production process likely differed for fine-paste ware with slips. Characterized by significantly higher hue and lower L*, a*, b*, and chroma values, the slipped fine-paste ware was crafted with relatively greater labor, time, and resources, implying its status as prestige goods or belonging to a distinct category of objects. Interestingly, the L*, a*, b*, and chroma values of potsherds from the Phra Mahathat Woramahawihan are substantially lower than those of fine-paste ware from Sathing Phra, a renowned pottery production site in maritime Southeast Asia. This study demonstrates that facile colorimetry and color classification by machine learning techniques, complementing X-ray and petrographic analyses, support the notion of more than one earthenware production site in ancient peninsular Thailand.
Disclosure statement
No potential conflict of interest was reported by the author(s).
Additional information
Notes on contributors
Chitnarong Sirisathitkul
Chitnarong Sirisathitkul obtained his D.Phil. in 2000 from the University of Oxford, UK. He has been working at Walailak University, Thailand, since 2001, where he was awarded the Best Teacher in 2005 and the Best Researcher in 2017. He is currently an associate professor and head of the Division of Physics at the School of Science. His publications in Scopus-indexed journals cover topics such as magnetic materials, nanoparticles, and traditional ceramics.
Yaowarat Sirisathitkul
Yaowarat Sirisathitkul obtained her M.Sc. in computer science from the National Institute of Development Administration, Thailand, in 2004. She currently serves as an assistant professor in the School of Engineering and Technology at Walailak University, Thailand. Her research focuses on computer programming and simulation, digital image processing, machine vision, and machine learning. She has also been involved in integrating smartphone sensors into engineering education, with published works on smartphone-based digital image colorimetry in forensic science and cultural heritage studies.
Wannasan Noonsuk
Wannasan Noonsuk is an assistant professor in the department of art, design, and art history, at California State University, USA. He obtained his Ph.D. in history of art and archaeology from Cornell University, under a scholarship from the King of Thailand. He was also awarded post-doctoral studies at the École Française d'Extrême-Orient (EFEO) in Paris, under a fellowship from the French Government. He directed his excavation program in southern Thailand and published books and articles related to early Southeast Asian ceramic trade, state formation, and social roles of art.
References
- Anglisano, A., L. Casas, I. Queralt, and R. Di Febo. 2022. “Supervised Machine Learning Algorithms to Predict Provenance of Archaeological Pottery Fragments.” Sustainability 14:11214. https://doi.org/10.3390/su141811214.
- Balkansky, A. K., and M. M. Croissier. 2009. “Multicrafting in Prehispanic Oaxaca.” Archaeological Papers of the American Anthropological Association 19 (1): 58–74. https://doi.org/10.1111/j.1551-8248.2009.01013.x.
- Bratitsi, M., I. Liritzis, A. Vafiadou, V. Xanthopoulou, E. Palamara, I. Iliopoulos, and N. Zacharias. 2018. “Critical Assessment of Chromatic Index in Archaeological Ceramics by Munsell and RGB: Novel Contribution to Characterization and Provenance Studies.” Mediterranean Archaeology and Archaeometry 18 (2): 175–212. https://doi.org/10.5281/zenodo.1297163.
- Capobianco, N., M. O. J. Y. Hunault, C. Loisel, B. Trichereau, F. Bauchau, N. Trcera, L. Galoisy, and G. Calas. 2021. “The Representation of Skin Colour in Medieval Stained Glasses: The Role of Manganese.” Journal of Archaeological Science: Reports 38:103082. https://doi.org/10.1016/j.jasrep.2021.103082.
- Casas, L., A. Anglisano, R. Di Febo, B. Pedreño, and I. Queralt. 2023. “Supervised Machine Learning Algorithms to Discriminate two Similar Marble Varieties, a Case Study.” Minerals 13: 861. https://doi.org/10.3390/min13070861.
- Chaves, R. C., J. P. Veiga, and A. Monge Soares. 2022. “Characterization of Chalcolithic Ceramics from the Lisbon Region, Portugal: An Archaeometric Study.” Heritage 5:2422–2443. https://doi.org/10.3390/heritage5030126.
- Fahim, J., E. Ghasemi, and M. Hosseini-Zori. 2023. “A Study on the Colored Glazed Tiles of Soltaniyeh Dome: An Analytical Approach.” Progress in Color, Colorants and Coatings 16:113–124. https://doi.org/10.30509/PCCC.2022.167010.1182.
- Gebremariam, A. Z., P. Davit, M. Gulmini, L. Maritan, A. Re, R. Giustetto, S. Massa, C. Mandelli, Y. Gebreyesus, and A. L. Giudice. 2022. “The Contribution of Colour Measurements to the Archaeometric Study of Pottery Assemblages from the Archaeological Site of Adulis, Eritrea.” Acta IMEKO 11:1–8. https://doi.org/10.21014/acta_imeko.v11i1.1094.
- Ichikawa, A., K. Kanegae, and K. Nanamura. 2021. “Pottery Production in Salt Workshops: Petrographic and XRF Analyses of Pottery from Nueva Esperanza, El Salvador.” Science & Technology of Archaeological Research 7 (1): 49–61. https://doi.org/10.1080/20548923.2021.1927349.
- Jutimoosik, J., C. Sirisathitkul, W. Limmun, R. Yimnirun, and W. Noonsuk. 2017. “Synchrotron XANES and ED-XRF Analyses of Finepaste Ware from 13th to 14th Century Maritime Southeast Asia.” X-ray Spectrometry 46 (6): 492–496. https://doi.org/10.1002/xrs.2780.
- López-García, P. A., V. H. García-Gómez, G. Acosta-Ochoa, and D. L. Argote. 2024. “Semi-supervised Classification to Determine the Provenance of Archaeological Obsidian Samples.” Archaeometry 66 (1): 142–159. https://doi.org/10.1111/arcm.12901.
- Mantovan, L., and L. Nanni. 2020. “The Computerization of Archaeology: Survey on Artificial Intelligence Techniques.” SN Computer Science 1 (5): 267. https://doi.org/10.1007/s42979-020-00286-w.
- Martínez, MÁ, A. I. Calero, and E. M. Valeroa. 2020. “Colorimetric and Spectral Data Analysis of Consolidants Used for Preservation of Medieval Plasterwork.” Journal of Cultural Heritage 42:64–71. https://doi.org/10.1016/j.culher.2019.08.010.
- Mika, A., M. I. Eren, R. S. Meindl, M. J. O’Brien, and M. R. Bebber. 2023. “On the Evolution of Limestone-Tempered Pottery in the American Midwest: An Experimental Assessment of Vessel Weight and its Relationship to Other Functional/Mechanical Properties.” Science & Technology of Archaeological Research 9 (1): 1–14. https://doi.org/10.1080/20548923.2022.2160087.
- Miksic, J. N. 2019. “The Bakau or Maranei Shipwreck: A Chinese Smuggling Vessel and its Context.” Current Science 117 (10): 1640–1646. https://doi.org/10.18520/cs/v117/i10/1640-1646.
- Miksic, J. N., and C. T. Yap. 1988. “Fine-bodied White Earthenwares of Southeast Asia: Some X-ray Fluorescence Tests.” Asian Perspective 28 (1): 45–60. http://www.jstor.org/stable/42928188.
- Milotta, F. L. M., F. Stanco, D. Tanasi, and A. M. Gueli. 2018. “Munsell Color Specification Using ARCA (Automatic Recognition of Color for Archaeology).” Journal on Computing and Cultural Heritage 11:17. https://doi.org/10.1145/3216463.
- Morandi, L. F., and S. Amicone. 2023. “Ceramic Traditions and Technological Choices Revealed by Early Iron Age Vessels: The Case of Vetulonia (Southern Tuscany).” Science & Technology of Archaeological Research 9 (1): 2217558. https://doi.org/10.1080/20548923.2023.2217558.
- Noonsuk, W. 2018. Tambralinga and Nakhon Si Thammarat: Early Kingdoms on the Isthmus of Southeast Asia. Nakhon Si Thammarat: Nakhon Si Thammarat Provincial Government.
- Noonsuk, W. 2022. “Chronicles and Archaeology: The Initial Foundation of the City and Great Reliquary of Nakhon Si Thammarat, Peninsular Thailand.” In Decoding Southeast Asian Art: Studies in Honor of Prof. Piriya Krairiksh’s 80th Birthday, edited by N. Revire and P. Soomjinda, 104–117. Bangkok: River Books & The Piriya Krairiksh Foundation.
- Oonk, S., and J. Spijker. 2015. “A Supervised Machine-learning Approach Towards Geochemical Predictive Modelling in Archaeology.” Journal of Archaeological Science 59: 80–88. https://doi.org/10.1016/j.jas.2015.04.002.
- Payntar, N. D. 2023. “A Multi-Temporal Analysis of Archaeological Site Destruction Using Landsat Satellite Data and Machine Learning, Moche Valley, Peru.” Journal on Computing and Cultural Heritage 16 (3): 47. https://doi.org/10.1145/3586079.
- Pérez-Monserrat, E. M., L. Maritan, V. Baratella, and M. Vidale. 2023. “Production Technologies and Provenance of Ceramic Materials from the Earliest Foundry of Pre-Roman Padua, NE Italy.” Heritage 6:2956–2977. https://doi.org/10.3390/heritage6030157.
- Plutino, A., and G. Simone. 2021. “The Limits of Colorimetry in Cultural Heritage Applications.” Coloration Technology 137 (1): 56–63. https://doi.org/10.1111/cote.12500.
- Prieto, B., P. Ferrer, P. Sanmartín, V. Cárdenes, and B. Silva. 2011. “Color Characterization of Roofing Slates from the Iberian Peninsula for Restoration Purposes.” Journal of Cultural Heritage 12 (4): 420–430. https://doi.org/10.1016/j.culher.2011.02.001.
- Ramacciotti, M., G. Gallello, S. Columbu, D. Fancello, A. Diez-Castillo, O. García-Puchol, A. Pastor, and M. L. Cervera. 2023. “Smartphone Photos as a Non-destructive Approach to Characterise Siliceous Artefacts.” Science & Technology of Archaeological Research 9 (1): e2240175. https://doi.org/10.1080/20548923.2023.2240175.
- Ruschioni, G., D. Malchiodi, A. M. Zanaboni, and L. Bonizzoni. 2023. “Supervised Learning Algorithms as a Tool for Archaeology: Classification of Ceramic Samples Described by Chemical Element Concentrations.” Journal of Archaeological Science: Reports 49:103995. https://doi.org/10.1016/j.jasrep.2023.103995.
- Sanmartín, P., E. Chorro, D. Vázquez-Nion, F. M. Martínez-Verdú, and B. Prieto. 2014. “Conversion of a Digital Camera Into a non-Contact Colorimeter for use in Stone Cultural Heritage: The Application Case to Spanish Granites.” Measurement 56:194–202. https://doi.org/10.1016/j.measurement.2014.06.023.
- Sirisathitkul, C., K. Ekmataruekul, Y. Sirisathitkul, and W. Noonsuk. 2020. “Smartphone Colorimetry of Fine-Paste Ware in Hindu-Buddhist Rituals.” European Journal of Science and Theology 16:179–186.
- Sirisathitkul, C., J. Jutimoosik, S. Abbasi, and W. Noonsuk. 2019. “Investigations of Fine-Paste Ware Production and Exchange in Maritime Southeast Asia by Electron Microscopy and Synchrotron X-ray Absorption.” Processing and Applications of Ceramics 13 (3): 250–256. https://doi.org/10.2298/PAC1903250S.
- Srisuchat, A. 2003. “Earthenware from Archaeological Sites in Southern Thailand: The First Century BC to the Twelfth Century AD.” In Earthenware in Southeast Asia, edited by J. Miksic, 249–260. Singapore: Singapore University Press.
- Ueasaman, P. 2017. “The Dating of the Great Reliquary of Nakhon Si Thammarat Based on Recent Archaeological Work.” In Proceeding of Fine Arts Department, Bangkok, August 31, 2017. p. 126–132.
- Ueda, K., J. N. Miksic, S. C. Wibisono, N. Harkantiningsih, G. Y. Goh, E. E. McKinnon, and A. M. Z. Shah. 2017. “Trade and Consumption of Fine Paste Ware in Southeast Asia: Petrographic and Portable X-ray Fluorescence Analyses of Ninth to Fourteenth-century Earthenware.” Archaeological Research in Asia 11:58–68. https://doi.org/10.1016/j.ara.2017.05.004