
ABSTRACT
In this study we show the successful deployment of Ground Penetrating Radar (GPR) together with Electrical Resistivity Surveys (ERS) in guiding the archeological excavations at Ashdod-Yam (southern coast of Israel). This approach enabled the precise identification of excavation targets relating to an Early Byzantine ecclesiastical complex located in a residential neighborhood of the modern city of Ashdod. Applied over the course of five years, the combined use of GPR and ERS, interspersed with phases of archeological excavation, not only facilitated an efficient exploration but also ensured the preservation of valuable historical structures. The geophysical data, corroborated by drone images of the post-excavation site, revealed a striking correlation between excavation and non-intrusive survey data. This study not only charts a successful excavation journey but serves as a methodological blueprint for future archeological explorations. The techniques and strategies detailed here have broader implications for the preservation and public presentation of historical sites.
1. Introduction
The advantages of using various geophysical techniques to identify buried archeological features are globally well-established (e.g. Conyers and Goodman Citation1997; Conyers Citation2004; Citation2015; Citation2023; Cozzolino et al. Citation2019; Cozzolino et al. Citation2020; Darvasi, Agnon, and Finkelstein Citation2022; Gaffney Citation2008; Goodman and Piro Citation2013; Garrison Citation2016, 115–143). In this paper, we report the results of an integrated geophysical investigation prior to and during the excavations of a recently discovered Byzantine religious complex, located at the ancient city of Azotos Paralios – Ashdod-Yam, Israel.
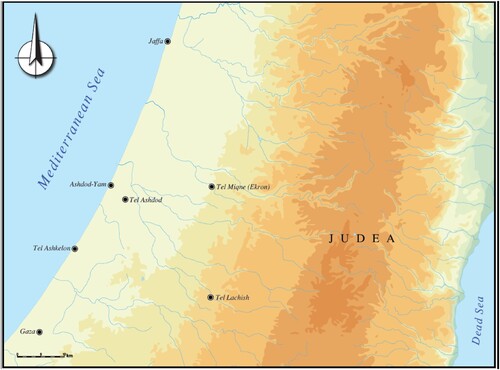
Ashdod-Yam (Ashdod-by-the-Sea) is a coastal archeological site within the modern city of Ashdod in southern Israel. The site is located about 5 km north-west of the ancient Philistine capital at Tel Ashdod (), and its fate was always intertwined with that of the ancient capital.
Figure 1. General Ashdod-Yam site location (created by Itamar Ben-Ezra).
The latter site was extensively and systematically excavated over the years, revealing a wealth of important discoveries (Dothan Citation1971; Dothan and Ben-Shlomo Citation2005; Dothan and Freedman Citation1967; Dothan and Porath Citation1982; Citation1993). Ashdod-Yam also yielded significant archeological remains, marked by distinct occupation horizons that stretch from the Late Bronze Age up to the Early Islamic Period.
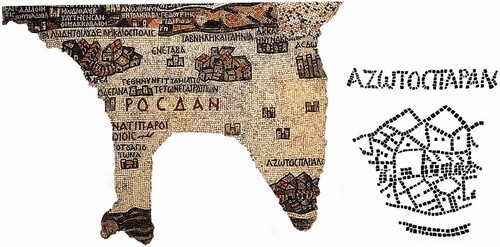
The archeological site of Ashdod-Yam is currently surrounded by modern buildings and, to an extent, enjoys a protected zone status. A mound (acropolis) in the site’s southern part is incorporated into an artificial enclosure, constructed and occupied during the Iron Age IIB – IIC (eighth – seventh centuries BCE) and also during the Hellenistic period, signifying its strategic and defensive importance (Ashkenazi and Fantalkin Citation2019; Fantalkin Citation2014; Citation2018; Fantalkin, Johananoff, and Krispin Citation2016; Kaplan Citation1969). The remains of the Roman-Byzantine period city, covered by dunes, are spread to the north of the enclosure. The Byzantine city was extensive and covered an area of at least 2 km from north to south and about 1.5 km from east to west. This expanse is evident from aerial photographs taken in 1944 (). Until recently, however, except for a few excavated cemeteries (Ganor Citation2017; Pipano Citation1990), archeological excavations have revealed little about this city, even though the Byzantine period represents the peak of ancient settlement at Ashdod-Yam (ca. fourth to early seventh century CE) (Bäbler and Fantalkin Citation2023). Known as Azotos Paralios in Late Antiquity, this coastal city’s importance is underscored by its visual prominence in the sixth-century CE Madaba mosaic map, surpassing its inland counterpart Azotos (Azotos Mesogaios, also known as Azotos Hippenos) located at Tel Ashdod (Isaac Citation2014; Tsafrir, Di Segni, and Grin Citation1994, 72–73) (). This shift in the region’s centre of gravity from Ashdod to Ashdod-Yam likely occurred much earlier, potentially during the Iron Age (Fantalkin Citation2014). An impressive fortress (40 × 60 m) dating from the Early Islamic period, which has been identified as the ribat mentioned by al-Muqaddasi (tenth century CE), is located in the northern part of the site. The fortress was erected on top of the Byzantine period remains, and has been excavated by the Israel Antiquities Authority (IAA) (Nachlieli Citation2008; Raphael Citation2014).
Figure 2. Aerial photograph of Ashdod-Yam, 1944 (courtesy Survey of Israel).
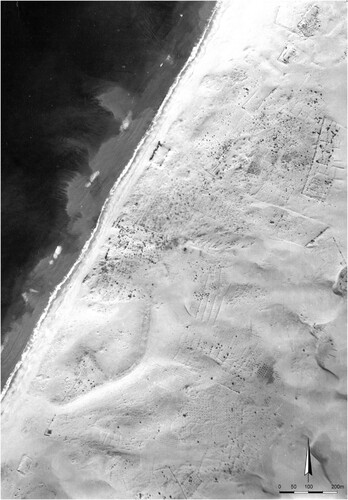
Figure 3. Close-up representation of Ashdod-Yam (Azotos Paralios) and Ashdod (Azotos Mesogaios) on a sixth century CE Madaba mosaic map section (after Alliata Citation1999: figs. on pp. 81, 83). The full original mosaic map measured ca. 21 × 7 m, containing more than two million tesserae.
Renewed excavations at Ashdod-Yam were initiated in 2013 under the directorship of A. Fantalkin, on behalf of the Institute of Archeology at Tel Aviv University. In August 2017, during the third excavation season on the acropolis, it was decided to conduct a limited excavation in the site’s northern part, ca. 1 km north-east of the acropolis and some 350–400 m eastwards, inland from the Early Islamic fortress. The excavated area was located between the villas of modern Ashdod, at the place where, more than 40 years ago, traces of mosaic floors were detected during modern construction activities. Since then, colorful mosaic tesserae have occasionally appeared on the surface, pointing to a Late-Antiquity site’s presence, awaiting discovery and preservation. This small pilot excavation yielded promising indications of finding a Byzantine church, including one almost fully-preserved dedicatory Greek inscription and part of another.Footnote1 Systematic large-scale excavations of the complex undertaken in July/August 2019 and in July/August 2021 (permits G-50/2017;Footnote2 G-26/2021)Footnote3 focused on the exposure of the entire church complex and associated structures. These excavations revealed the remains of a large three-aisled basilica-style church with decorative mosaic floors, an elaborate chapel and additional structures north and west of the church. Unfortunately, unsupervised construction activity in the 1980s severely damaged the complex’s south-western section (see below).
We describe in the following pages a range of geophysical techniques deployed during the archeological investigation of this complex, to highlight their immense contribution towards establishing a reliable excavation strategy.
2. Geological background
The southern Levantine Mediterranean coast is dominated by aeolian beach ridges, comprised of aeolian sandstone interbedded with minor sandy-to-silty soils. Mauz et al. (Citation2013) summarized decades of research on their origin. They dated representative samples using optical luminescence to determine the relationships between the beach ridges and global Quaternary glacial cycles. The resultant dates established that most of the exposed stratigraphic column was deposited during the last two glacial cycles (circa 200 millennia BP). Gvirtzman, Netser, and Katsav (Citation1998) described the sections close to Ashdod-Yam. They correlated the upper indurated 2–6 m of aeolian sandstone with the Tel Aviv stratigraphic unit, dated to 3.5 millennia BP. A silty red soil, 2 m thick – the Netanya stratigraphic unit – underlies it. The Ashdod-Yam site is dominated by the upper sandstone unit.
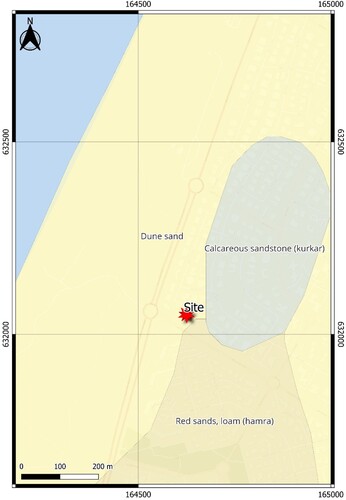
More recently, Sneh and Rosensaft (Citation2004) mapped the geology of the 1:50,000 Ashdod Sheet. They did not attempt regional correlations, but defined four stratigraphic units: Plio-Pleistocene red sand and loam (locally known as “hamra”) (10 m and thicker) overlain by calcareous sandstone (locally known as “kurkar”) (45 m and thicker); and Holocene dunes (15 m and thicker) overlain by alluvium (2 m and thicker). According to their map, Ashdod-Yam lies on a triple junction of three contacts where dunes, calcareous sandstone, and red sand and loam meet (). The site is nominally founded on the Holocene dune sand unit, but is very close to the respective contacts of the underlying Plio-Pleistocene units.
Figure 4. Geological map excerpt mapped at 1:50,000 (Sneh and Rosensaft Citation2004). Red star marks Ashdod-Yam.
3. Archeological investigations and geophysical methods
3.1. Pilot excavation and electrical resistivity survey
3.1.1. Pilot excavation August 2017
The pilot excavation of several days’ duration in August 2017 succeeded in exposing the remains of a room with an almost fully-preserved dedicatory Greek inscription at its entrance (, left; later labeled Room 1). An additional adjoining room to the east (later labeled Room 3), only partially excavated, featured another Greek dedicatory inscription with a round medallion (, right). In order to preserve these exposed remains for future investigation (), they were covered by geotextile cloth and then backfilled using clean sand and sediments removed during the excavation.
Figure 5. Left: Room 1 at pilot season end. Right: Partially-excavated inscription in Room 3 at pilot season end (created by Sasha Flit).
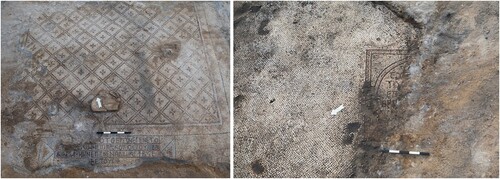
Figure 6. Exposed remains during the pilot season (created by Slava Pirsky).
3.1.2. Electrical resistivity survey (ERS)
The ERS was conducted on April 16, 2018 in the immediate vicinity of the remains exposed during the pilot season, now covered, for the purpose of detecting the structure’s eastern extent.Footnote4 ERS is a non-destructive method that measures voltage and amperage associated with controlled electrical currents flowing in the ground. These currents are introduced into the earth through remote reference electrodes and by electrodes moved in a grid to accumulate point-by-point resistivity data which enable constructing images (Loke Citation2011; Samouëlian et al. Citation2005). Changes in the ground resistivity caused by anomalies within the survey grid are detected both laterally and vertically. ERS uses actual wires to connect the reference electrodes and survey electrodes, requiring a site cleared of vegetation to ensure its effectivity. The ERS device can use the reference electrodes to compensate for a reasonable range of soil moisture.
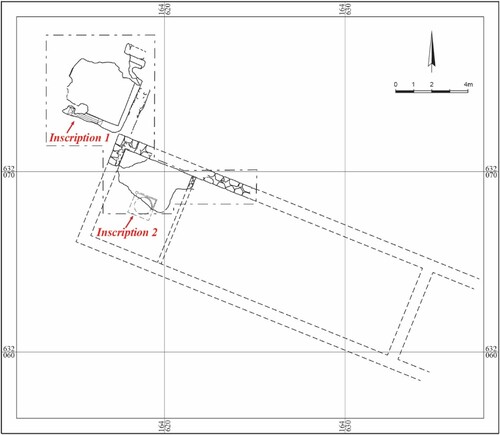
Clearing the ground of vegetation and then leveling the surface by tractor (one with a wide shovel bucket without teeth on the front) made the physical work of the survey much easier. The ERS equipment included the TR Systems earth resistivity meter and its associated hardware and software. The GIS team visited the site and inserted rebar pins for the six corners of two adjacent positioned 20 × 20 m squares. The ERS was anchored on those pin placements so that the results could be dropped into the GIS site plan. On survey day warm and sunny weather meant the ground was drying quickly, so at every point in the survey the meter showed persistent fluctuations over a range of 30 Ω or more. This indicated that the ground was near the limit of moisture content required for good image recording. Nevertheless, the survey was able to locate the already backfilled and geotextile-covered remains, and several additional anomalies to the east in an as-yet unexcavated section. In particular, some 15–20 m east of the pilot season’s exposed remains, a semi-circular anomaly was detected (). Given the ecclesiastical nature of the already-discovered inscriptions, this semi-circular anomaly was interpreted as an apsis of a small church. It was thus decided to excavate the entire complex during the next campaign.
Figure 7. Slanted rectangle in center delimits ERS results (created by John Hunt and Slava Pirsky). Background – orthophoto.
3.2. July/August 2019 excavation season and Ground Penetrating Radar survey
3.2.1. July/August 2019 excavation season.
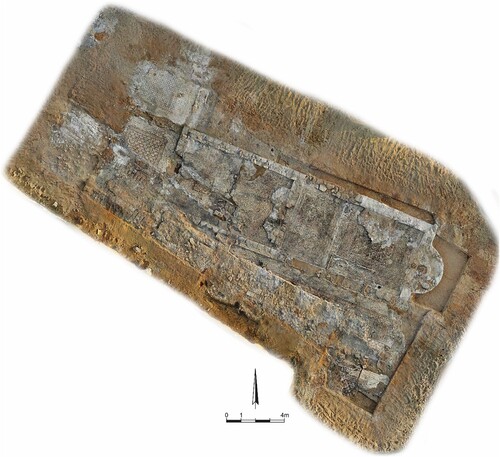
The full excavation campaign of July/August 2019 focused on uncovering the previously-detected structures, initially thought to be a small church with associated buildings. The excavation grid defined by the earlier ERS was expanded eastward to reveal more of the site. As the season progressed, the semi-circular anomaly identified by the ERS was unearthed, indeed revealing an apse; but contrary to the initial assessments it was not part of a small, isolated church. Instead, it belonged to an elaborate side chapel attached to the north of a monumental basilica. At season’s end it was possible to assess the monumentality of this complex. What emerged was a large three-aisled basilica-style church adorned with decorated mosaic floors, together with an elaborate chapel and adjoining rooms to the north. However, the 2019 season only revealed the chapel and the eastern part of the main church’s northern aisle (). In addition to the architectural finds, new inscriptions were unearthed in all excavated areas.
Figure 8. Post-season orthophoto, July/August 2019 (created by Slava Pirsky and Sergey Alon).
Based on the discovery of dated inscriptions and attested architectural changes, a preliminary, tentative building phase sequence could be offered as follows ():
Figure 9. Church complex post-excavation with three tentatively suggested constructional phases: Phase 1 (blue); Phase 2 (red); Phase 3 (green) (created by Slava Pirsky).
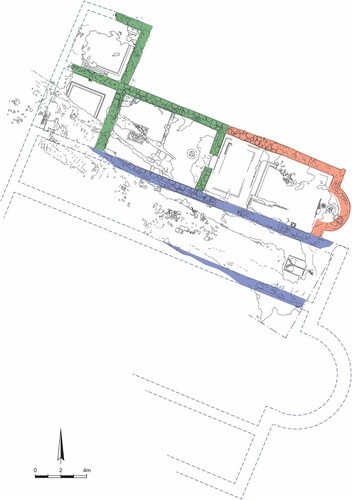
Phase 1: The main church (represented by only partially excavated northern aisle at the end of July/August 2019 excavation season), constructed in the early fifth century CE.
Phase 2: The elaborate chapel attached in the mid-fifth century CE to the northern aisle’s eastern part, on its north.
Phase 3: A series of rooms added to the Phase 2 chapel’s west, abutting the church’s northern aisle as well.
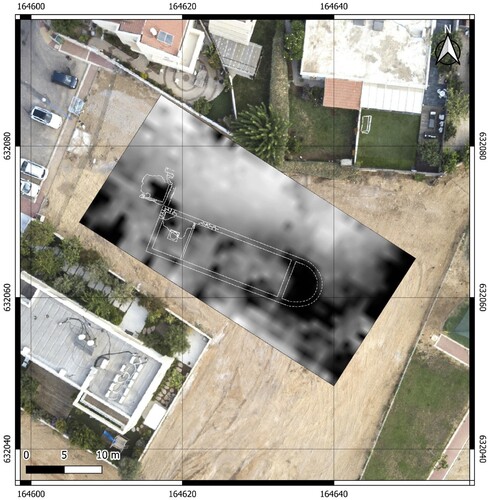
Post-excavation the exposed remains were again covered up with geotextile and backfilled using clean sand and sediments removed during the excavation (). Before embarking on the final campaign, a Ground Penetrating Radar survey of the backfilled and unexcavated parts of the entire area was conducted on September 10, 2019.
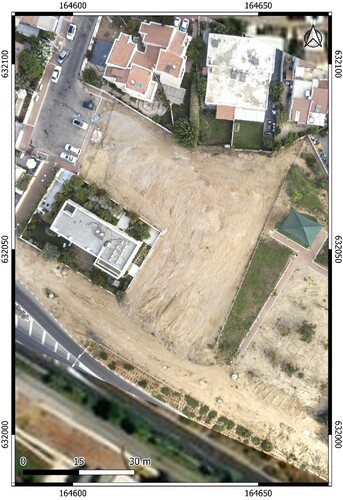
Figure 10. Post-season aerial photograph of the covered complex.
3.2.2. Ground Penetrating Radar (GPR) survey
GPR is a non-destructive electromagnetic geophysical technique that maps the subsurface using radio waves. The GPR instrument transmits electromagnetic radio pulses into the subsurface and receives them back, measuring the time elapsed between the transmission and any reflections from subsurface discontinuities (the two-way travel time – TWT). Reflected electromagnetic waves indicate discontinuities in the dielectric properties of the ground. Archeological features buried at shallow depths may generate a detectable contrast in the dielectric properties (Daniels Citation1996). The GPR is moved along a path and simultaneously collects the reflected radio-frequency (RF) intensity as a function of time (a radiogram trace or file per location) and a GPS position (in each file header). A GPR scan produces a 2D profile of the subsurface. Numerous scans are collected close to each other that effectively cover the entire area of interest. The data are assembled offline to generate maps of reflectance for each TWT, also known as time slices (Goodman, Nishimura, and Rogers Citation1995). Subsequent signal processing is used to refine the GPR maps and enhance the clarity of the imaged features of any potential underground objects. Partially excavating a small area, a practice known as “ground truthing,” can be used to validate and enhance the confidence in the interpretations drawn from GPR images.
The GPR was chosen to be used in this research due its advantages: relatively ease in collecting data and high lateral and vertical resolution. Besides these obvious advantages, in this case the contrast between the site’s sandy soil and the different materials comprising the archaeological materials makes the GPR method most suitable and able to produce results with a high resolution as compared to other geophysical methods.
The primary purpose of using GPR in this research was to understand roughly where more archaeological features could be found, to indicate where physical excavation would be most promising. Hence, data was acquired broadly and based only on GPS without marks.
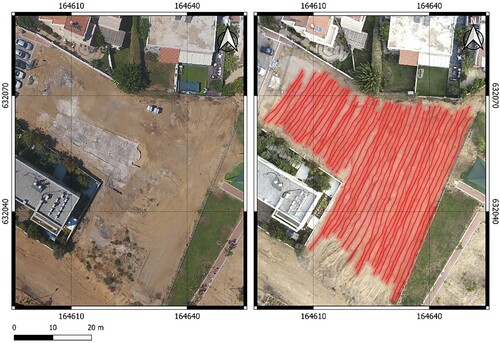
The GPR scan data were scanned using a Cobra CBD GPR device with simultaneous central frequencies of 200, 400, and 800 MHz and can received a multi-frequency band from 50 to 1,400 MHz. The Cobra GPR (CBD) antenna transmits pulses with triple frequencies in a blended pulse form. The CBD antenna selects the optimal frequency needed for all layers and targets at different depths. The profiles were acquired over an area of about 1700 m2 and included 45 profiles of about 1500 m total length (). Inter-profile spacing averaged 1.0–1.5 m. All GPR scans were acquired at intervals of 1 cm and with 512 samples per trace, resulting in a high spatial resolution, as required for archeological investigations. A time window of 50 ns was used to ensure depth penetration following expected feature depths. The wheeled GPR device, which carries a GPS logger (GT-600) for positioning, was pushed at an average walking speed of about 0.5 m/s in a continuous mode along parallel transects. For the device used, positioning was also constrained by a magnetic wheel counter, with the count being logged alongside the GPS solution in the header of each radiogram. This allowed for a series of consecutive adjacent radiograms to be plotted together, producing a radargram that provided an image of the subterranean section.
Figure 11. Excavation area (left) and GPR scan transects (right).
The data collected from the GPR scans were processed using GPR-SLICE v7.MT software, employing the following basic GPR processing steps ():
| 1. | “Time-zero corrections”: Shifting time to account for air-wave arrival. | ||||
| 2. | “De-wow filter”: Removing low-frequency noise. | ||||
| 3. | “Background filter”: Eliminating direct waves, ringing noise, and any erroneous horizontal banding. | ||||
| 4. | “Gain function”: Enhancing signals at greater depths to offset signal loss due to absorption and geometric scattering. | ||||
| 5. | “Frequency filtering (bandpass)”: Filtering out high and low frequencies that are not relevant, based on an analysis of the spectrum frequencies. | ||||
Figure 12. Schematic view of the GPR processing sequence (after Darvasi, Agnon, and Finkelstein Citation2022).
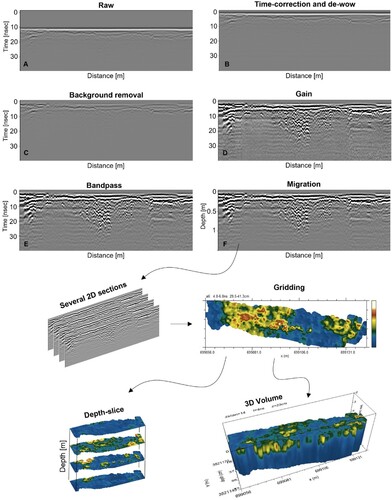
Following these steps, the data were further refined. Hyperbolas found over the TWT plotted against distance helped in migrating the data from time to depth. This was done using the hyperbola fit tool with an optimized velocity of ∼0.13 m/ns. After filtering each 2D scan, the data were gridded, using the inverse distance algorithm with a setting of 2. Finally, the data were smoothed with a 5 × 5 low-pass filter. This process resulted in the production of time-slice maps at selected depth intervals, creating a detailed 3D volume of the subsurface.
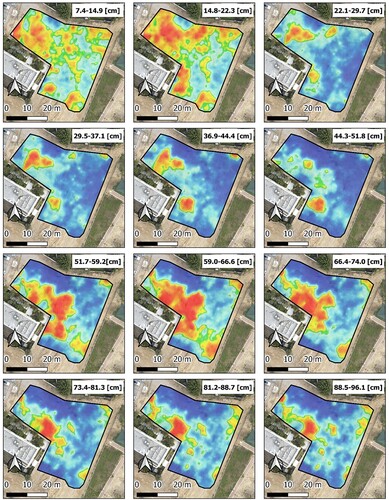
In the depth slices shown in , indications of where archeological remains might be located can be observed. The broad result of the depth slice is due to the 5X5 low-pass filter, and this is used to understand roughly where more archaeological remains can be found. Specifically, the GPR data revealed shallow features (∼10 cm depth) on the western side of the area previously excavated. In contrast, on the eastern side, significant anomalies are present at greater depths (>40 cm). This disparity in depth detection is attributed to the uneven depth of the loose sands, which are thicker towards the southeastern, yet-to-be excavated, part of the site. Thus, the GPR survey validated the earlier findings of the 2019 excavation and provided a guide to new areas for investigation, enhancing comprehension of the archaeological extent of the church complex.
Figure 13. GPR depth slices. Yellow-red colors indicate anomalies.
The strategic plan for the 2021 excavation season integrated the insights gained from both the 2019 archeological discoveries and the indicative interpretations from the GPR survey, which as mentioned had revealed strong anomalies to the southeast of the previously excavated remains. These anomalies were identified as likely key components of the basilica, namely the eastern and the most important part of the basilica’s nave, including a central main apse, and its southern aisle. The 2021 excavation season, therefore, focused on these areas. The archeological excavations conducted in 2021 indeed corroborated the GPR interpretations with high precision, with the unearthed structures closely matching the GPR predictions.
3.3. July/August 2021 excavation season and Ground Penetrating Radar survey during excavation
3.3.1. Brief synopsis of final results
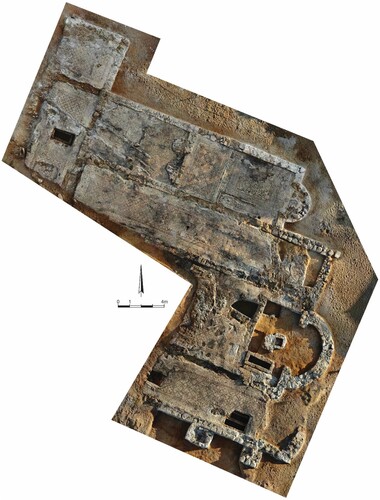
At the end of the 2021 final season, the surviving parts of the entire large three-aisled basilica-style church with associated buildings were exposed. The complex measured 18.52 × 23.64 m (with the apse, the length was 25.44 m). Unfortunately, unsupervised modern construction activity in the early 1980s had destroyed parts of the narthex and the major parts of the central nave and southern aisle (, ).
Figure 14. Orthophoto at July/August 2021 season end (created by Slava Pirsky and Sergey Alon).
An uncommon number of dated inscriptions, incorporated into the numerous, surviving mosaic floors, as well as evidence from dating recovered coins, suggest that the complex was used in the period ca. 400–600 CE.Footnote5 Several inscriptions contain a year and an indiction based on a chronological system using the city of Rome’s millennium, celebrated by the emperor Philippus Arabs in 247/8 CE to mark 1000 years since the city’s traditional 753 BCE foundation date, and views this date as a chronological anchor for calculating the date of Creation (Grumel Citation1958, 146–153; Mosshammer Citation2008, 268–272). This system is very unusual for the region, and it is conceivable that it was established at Ashdod-Yam and possibly later adopted by additional Christian communities (Di Segni, Bouzaglou, and Fantalkin Citation2023).
The earliest inscription (415/6 CE), found in the southern aisle, mentions a bishop Heraclius, together with Gaianus the priest and Severa the deaconess (Inscription 2 on ). The same Heraclius is known as a bishop of Azotos who attended the Council of Ephesus in 449 CE and also the Fourth Ecumenical Council at Chalcedon in 451 CE. A series of memorial inscriptions, mainly for deaconesses but also for deacons, were found in the main church’s northern aisle (Inscriptions 5–9 on ). Two bishops of Ashdod, mentioned in inscriptions elsewhere in the church (Inscriptions 12–13 on ), are not attested so far in any other known historical source. The church’s central apse housed the main altar, and a tomb with a single skeleton, probably dating to the Late Roman period. It further seems that the entire church complex was built around and aligned with this tomb, which is believed to have belonged to a saint or martyr. One indication is that this tomb was the only burial in the church not recycled in later times as a mass grave. Many other tombs, discovered beneath hasty repairs to the mosaic floors, were clearly turned into mass graves in the sixth century CE and yielded dozens of skeletons covered in lime.
Figure 15. Final stratigraphic and architectural phases of the excavated complex (created by Slava Pirsky, Liora Bouzaglou, & Alexander Fantalkin).
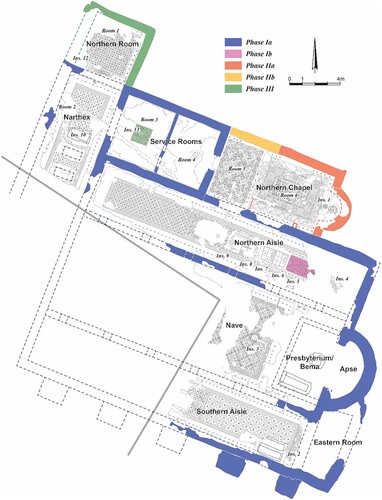
The complex demonstrated clear signs of destruction toward the end of the sixth century CE. Although many Byzantine churches exhibit burials and memorial inscriptions, the quantity of texts in the church discovered at Ashdod-Yam, the exclusive use of the millennium of Rome calendar, and the high number of female ministers mentioned in these inscriptions make it unique (Di Segni, Bouzaglou, and Fantalkin Citation2023; Habas Citation2023). Based on the discovery of additional dated inscriptions during the July/August 2021 excavation season and its exposure of other parts of the complex, the final stratigraphic sequence of the building phases has been refined as follows () (following Di Segni, Bouzaglou, and Fantalkin Citation2023):
Phase Ia: The church was constructed in the late fourth or early fifth century CE, at the latest. At this time, it comprised a central apse and a nave flanked by northern and southern aisles. Two rooms (Rooms 4 and 3, presumably used as service rooms) and the narthex running west across the edifice’s width were probably also built as part of the original program.
Phase Ib: This phase relates to the installation of several tombs in the northern aisle.
Phase IIa: This corresponds to the construction of a northern chapel (Room 6), which was added to the northern aisle.
Phase IIb: This corresponds to a westward enlargement of the chapel (Room 6). Room 5 was created in order to fill the space between the existing chapel and the block formed by Rooms 4 and 3. The western closing wall of Chapel Room 6 was dismantled, and the area was repaved with mosaic. An entrance was added to access Room 4 from Room 5.
Phase III: This phase relates to the addition of Room 1 to the narthex’s north side in the early sixth century CE. Around the middle or in the second half of this century, a new mosaic pavement was fashioned in Room 3. During this phase, several excavated tombs, discovered beneath patchy repairs to the mosaic floors in different parts of the church, had been converted to mass graves. It remains to be seen if this evidence may be connected to the so-called Plague of Justinian (cf. Meier Citation2016; and see, contra Mordechai et al. Citation2019; and response, Meier Citation2020).
3.3.2. Interpretation of 2D GPR scans
Although the depth slices obtained during the GPR survey prior to the July/August 2021 season supplied information primarily regarding the surveyed structure’s outline and borders (), the post-excavation study of the 2D GPR scans provided additional valuable information about specific archeological features (cf. Conyers Citation2023).
Figure 16. A semi-transparent map of the excavation orthophotos overlaid onto one GPE depth slice map. A. A post-2019 season orthophoto. B. A GPR depth slice (0.6 m) overlaying a post-2019 season orthophoto. C. A post-2021 season orthophoto. D. A GPR depth slice (0.6 m) overlaying a post-2021 season orthophoto, demonstrating the strong correlation between the GPR images and the actual excavation findings.
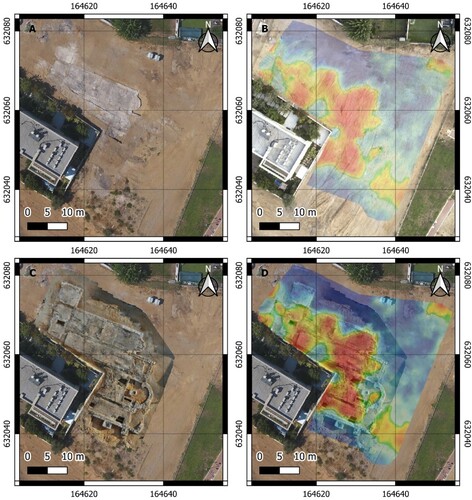
A comparative analysis of the 2D GPR scans alongside the actual archeological remains revealed a significant number of anomalies, or targets. These anomalies represented various archeological features, such as surfaces, walls, and pits. Further examination of the excavated findings, when viewed through the prism of the GPR data, enabled us to decipher several collected GPR profiles. Notable features, already discerned in the existing 2D scans, included a surface mosaic pavement between the walls of the structure, the stone foundations of the walls that were robbed in antiquity, and some collapse material (such as roof tiles and mud) that sealed the mosaic pavements (, ). Although this successful interpretation emerged post-factum, it demonstrates the substantial potential of GPR surveys. In this case, these accurate interpretations of the GPR data can now significantly contribute to any future archeological investigation of the surrounding area.
Figure 17. Ground-truthing and deciphering GPR profiles (a): An interpreted GPR profile with the excavated area following data acquisition. Yellow symbols and Photo 1 indicate the mosaics. Light blue symbols and Photo 2 indicate collapse of roof material. Green symbols and Photo 3 indicate a robbed wall. Red symbols and Photo 4 indicate the remaining foundations of stone walls.
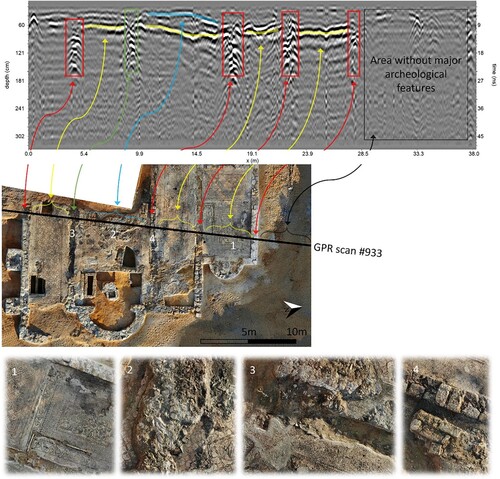
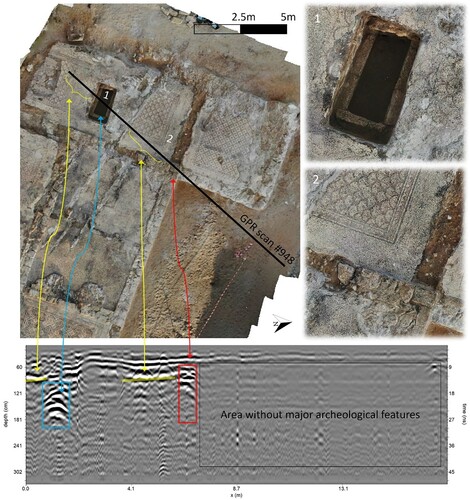
Figure 18. Ground-truthing and deciphering GPR profiles (b): An interpreted GPR profile with the excavated area following data acquisition. Light blue symbols and Photo 1 indicate an excavated grave. Red symbols and Photo 2 indicate the foundation of a stone wall. Green symbols and Photo 2 indicate a mosaic pavement.
3.3.3. GPR survey during the excavation
One GPR scan was acquired over the mosaic pavement of the northern aisle. Based on the series of memorial inscriptions and mosaic pavement repairs, underground tombs were suspected here (). The interpretation of this radargram indicates three to six cavities, of which several may be connected; pointing to the presence of unexcavated burial spaces beneath the repaired mosaic pavement. The excavation discovered similar actual tombs beneath hasty mosaic floors repairs in several different locations across the church area (), and the GPR reasonably indicates a similar situation.
Figure 19. GPR scans and anomalies found in the suspected tombs.
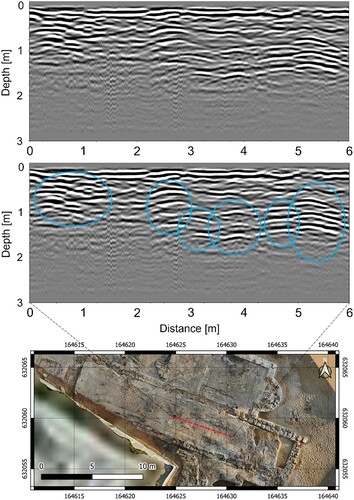
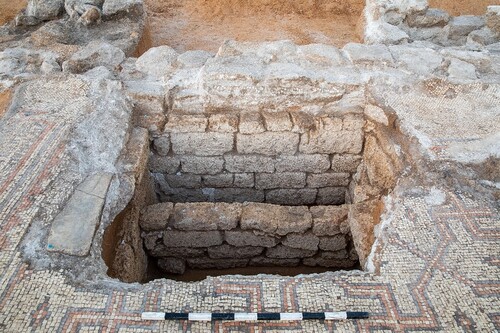
Figure 20. Two excavated graves, southern basilica aisle (created by Sasha Flit).
4. Conclusions
In this case study, we have explored the use of two geophysical techniques in the archeological investigation of the Early Byzantine Ecclesiastical complex at Ashdod-Yam. The deployment of Electrical Resistance Survey (ERS) and Ground Penetrating Radar (GPR) before and during the project facilitated the development of excavation strategies that were ultimately proven reliable and successful.
The ERS conducted prior to the 2019 excavation campaign successfully detected a semi-circular anomaly, initially identified as the apse of a small church. The preliminary assessment was later revised when it was revealed to be the apse of an elaborate side chapel, adjoining a monumental three-aisled basilica.
Prior to the 2021 excavation campaign, detailed GPR scans produced a 3D volume. These revealed several strong anomalies indicative of potential buried targets. A large anomaly, approximately 20 m wide and at depths ranging from 10 to 40 cm, was observed on the south side of the research area, suggesting the extent of the archeological features. The anomalies were interpreted as key basilica elements – the eastern and most important part of the nave, with a central main apse and the southern aisle of the church. The subsequent 2021 excavations confirmed these interpretations. Archeological features of a unique ecclesiastical complex precisely matched the GPR-detected anomalies. Moreover, the post-excavation analyses of 2D GPR scans provided additional valuable information about specific archeological features, such as the location of intact mosaic pavements, stone foundations of walls that had been robbed in antiquity, as well as the collapse material (such as roof tiles and mud) that sealed these pavements.
This correlation between the GPR interpretations and the actual findings underscores the immense potential of GPR data in guiding future archeological investigations in the surrounding area. Additionally, a GPR scan over the mosaic pavement of the northern aisle, carried out during the 2021 excavation campaign, indicated a potential series of underground tombs yet to be excavated. This finding is of high significance for future site preservation and for presentation efforts aimed at the general public.
Overall, this study demonstrates the effectiveness and advantages of deploying independent geophysical methods for any prospective archeological investigation, before and during excavation. More specifically, it validates the significant potential for coordinated ERS and GPR investigations to reduce the operational costs, increase the probability of finding archeological targets, and guide heritage preservation considerations.
Acknowledgments
We are grateful to Prof. Lawrence B. Conyers for his advise and assistance in interpreting the GPR data; to John Hunt for conducting the geoelectrical survey; to Sasha Flit for the photographs; and to Slava Pirsky for preparing the plans and illustrations.
Disclosure statement
No potential conflict of interest was reported by the author(s).
Data availability statement
Data may be available by request.
Additional information
Notes on contributors
Yaniv Darvasi
Yaniv Darvasi he received his B.Sc. (2014), M.Sc. (2016), and PhD (2024) degrees in geology from The Hebrew University of Jerusalem. His M.Sc. and PhD degrees focused on near-surface geophysical methods, particularly shallow seismic and ground-penetrating radar (GPR). At the end of 2024, he co-founded his company, HYPERLINK “https://www.insitu-ge.co.il/en”Insitu Geo-Engineering LTD, and today, he is its CEO. The company engages in geophysical and geological surveys for engineering purposes.
Alexander Fantalkin
Alexander Fantalkin PhD, 2008, Tel Aviv University, is an associate professor of archaeology at the Department of Archaeology and Ancient Near Eastern Cultures, Tel Aviv University. His research focuses on Near Eastern archaeology and history vis-à-vis the Aegean world in the first millennium BCE. He has published extensively on the topics of state formation in ancient Israel, biblical archaeology, burial customs, the Greek presence in the East before the Hellenistic period, Greek and Phoenician colonization, and, especially, chronological synchronization in the Iron Age from a pan-Mediterranean perspective. Since 2013, he has directed a large-scale archaeological project at the coastal site of Ashdod-Yam.
Paul Brindza
Paul Brindza is a Professor of Practice of Physics, Old Dominion University, Virginia 2016 to present, Jefferson Lab 1985 - 2016, Retired, Principal Engineer Physics Division and Jefferson Lab employee 1985 to 2016. Received his B.Sc in Physics in 1971 from Marquette University and his M.Sc. in Physics from Michigan State University in 1973. During his 40 year career he was employed at FNAL on the Energy Doubler Saver project (Tevatron), at the MIT Plasma Fusion Center as Project Engineer for the TARA Tandem Mirror Fusion project. He was the Lead Engineer for the High Momentum Spectrometer (HMS) in Hall C and was the Lead Engineer for the Super High Momentum Spectrometer (SHMS) for the 12 GeV Upgrade. Current Physics research is on Detectors for the Electron Ion Collider and magnet design for the FRIB lab. Research in Archeology with Tel Aviv University since 2017 including the use of Geo-Physics to explore archeological sites. His fields of expertise include large scale application of superconductivity especially SC magnets and cryogenic systems. He is the author of over 50 refereed publications in Applied Superconductivity, Magnetics, Cryogenics and High Vacuum and holds several patents in cryogenics and neutron shielding.
Amotz Agnon
Amotz Agnon is a full professor since 2008, received an M.Sc. degree in geology from the Hebrew University (1983) and a PhD in geophysics from the University of California, Berkeley (1989). He is a recipient of the Raphael Freund Medal of the Israel Geological Society (2002) and is an International Fellow of the Helmholtz Association. Since 1988, he has been teaching at the Fredy and Nadine Herrmann Institue of Earth Sciences, The Hebrew University, where he covered a wide variety of curricular subjects. Last March, he became an Emeritus Professor, teaching field-and-class courses in applied earth sciences, including applications of shallow geophysics. His research has covered issues from planetary to sub-atomic scales, and recently, he has focused on the synergy between earth sciences and archaeology.
Notes
1 The excavation (permit G-78/2017), directed by Alexander Fantalkin on behalf of the Institute of Archaeology at Tel Aviv University (TAU) in cooperation with Saar Ganor from the Israel Antiquities Authority (IAA), was conducted with a small group of volunteers over five days. Shaike Lender (IAA) served as area supervisor. The post-excavation restoration works were conducted by the IAA team (Southern District).
2 The excavation (permit G-50/2019), directed by Alexander Fantalkin on behalf of the Institute of Archaeology at TAU, was conducted with a group of ca. 15 students and volunteers over four weeks. Liora Bouzaglou (TAU) served as area supervisor, assisted by Yuval Hai (TAU). The post-excavation restoration works were conducted by the IAA team.
3 The excavation (permit G-26/2021), directed by Alexander Fantalkin on behalf of the Institute of Archaeology at TAU, was conducted with a group of ca. 30 students and volunteers over five weeks. Liora Bouzaglou (TAU) served as area supervisor, assisted by Yuval Hai (TAU) and Eli Itkin (TAU). The post-excavation restoration works were conducted by the IAA team.
4 The actual survey, including the necessary equipment and expertise, was conducted by John Hunt (Oxford, UK), to whom we extend our deepest thanks. During the field-survey, he was assisted by Paul Brindza and Alexander Fantalkin.
5 The inscriptions were translated and interpreted by Dr. Leah Di Segni, and the mosaic study was conducted by Dr. Lihi Habas (both of the Hebrew University of Jerusalem).
References
- Alliata, E. 1999. “The Legends of the Madaba Map.” In The Madaba Map Centenary 1897–1997, Travelling Through the Byzantine Umayyad (SBF, Collectio Maior 40), edited by M. Piccirillo, and E. Alliata, 47–102. Jerusalem: Studium Biblicum Franciscanum.
- Ashkenazi, D., and A. Fantalkin. 2019. “Archaeometallurgical and Archaeological Investigation of Hellenistic Metal Objects from Ashdod-Yam (Israel).” Archaeological and Anthropological Sciences 11 (3): 913–935. https://doi.org/10.1007/s12520-017-0579-1.
- Bäbler, B., and A. Fantalkin. 2023. “Azotos Paralios during the Periods of Roman and Byzantine Domination: Literary Sources vs. Archaeological Evidence.” In Word and Space Interacting in Palestine in Late Antiquity: Towards a History of Pluridimensionality (Eastern Mediterranean Texts and Contexts 5), edited by C. Horn, and B. Bäbler, 89–119. Chesterfield, Miss: Abelian Publishing.
- Conyers, L. B. 2004. Ground-Penetrating Radar for Archaeology. Walnut Creek: Altamira Press.
- Conyers, L. B. 2015. “Analysis and Interpretation of GPR Datasets for Integrated Archaeological Mapping.” Near Surface Geophysics 13 (6): 645–651. https://doi.org/10.3997/1873-0604.2015018.
- Conyers, L. B. 2023. Ground-Penetrating Radar for Archaeology. 4th Edition. Lanham, MD: Rowman & Littlefield.
- Conyers, L. B., and D. Goodman. 1997. Ground-Penetrating Radar: An Introduction for Archaeologists. London: Altamira Press.
- Cozzolino, M., V. Gentile, C. Giordano, and P. Mauriello. 2020. “Imaging Buried Archaeological Features through Ground Penetrating Radar: The Case of the Ancient Saepinum (Campobasso, Italy).” Geosciences 10 (6): 225. https://doi.org/10.3390/geosciences10060225.
- Cozzolino, M., F. Longo, N. Pizzano, M. L. Rizzo, O. Voza, and V. Amato. 2019. “A Multidisciplinary Approach to the Study of the Temple of Athena in Poseidonia-Paestum (Southern Italy): New Geomorphological, Geophysical and Archaeological Data.” Geosciences 9 (8): 324. https://doi.org/10.3390/geosciences9080324
- Daniels, D. J. 1996. “Surface-Penetrating Radar.” Electronics & Communication Engineering Journal 8 (4): 165–182. https://doi.org/10.1049/ecej:19960402.
- Darvasi, Y., A. Agnon, and I. Finkelstein. 2022. “GPR Mapping of Buried Monumental Retaining Walls at Biblical Kiriath-Yearim Near Jerusalem.” STAR: Science & Technology of Archaeological Research 8 (1): 20–30. https://doi.org/10.1080/20548923.2022.2089470
- Di Segni, L., L. Bouzaglou, and A. Fantalkin. 2023. “A Recently Discovered Church at Ashdod-Yam (Azotos Paralios) in Light of Its Greek Inscriptions.” Liber Annuus 72: 399–447. https://doi.org/10.1484/J.LA.5.134545.
- Dothan, M., ed. 1971. Ashdod II-III: The Second and Third Seasons of Excavations: 1963, 1965 (ʿAtiqot 9–10). Jerusalem.
- Dothan, M., and D. Ben-Shlomo, eds. 2005. Ashdod VI: The Excavations of Areas H and K (1968–1969) (Israel Antiquities Authority Reports 24). Jerusalem.
- Dothan, M., and D. N. Freedman, eds. 1967. Ashdod I: The First Season of Excavations 1962 (ʿAtiqot 7). Jerusalem.
- Dothan, M., and Y. Porath, eds. 1982. Ashdod IV: Excavation of Area M. ‘Atiqot 15. Jerusalem.
- Dothan, M., and Y. Porath. 1993. Ashdod V: Excavations of Area G. The Fourth-Sixth Seasons of Excavations 1968-1970 (ʿAtiqot 23). Jerusalem.
- Fantalkin, A. 2014. “Ashdod-Yam on the Israeli Mediterranean Coast: A First Season of Excavations.” Skyllis: Zeitschrift für Unterwasserarchäologie 14 (1): 45–57.
- Fantalkin, A. 2018. “Neo-Assyrian Involvement in the Southern Coastal Plain of Israel: Old Concepts and New Interpretations.” In The Southern Levant under Assyrian Domination, edited by A. Faust, and S. Zelig Aster, 162–185. Winona Lake: Eisenbrauns.
- Fantalkin, A., M. Johananoff, and S. Krispin. 2016. “Persian-Period Philistian Coins from Ashdod-Yam.” Israel Numismatic Journal 11: 23–28.
- Gaffney, C. 2008. “Detecting Trends in the Prediction of the Buried Past: A Review of Geophysical Techniques in Archaeology.” Archaeometry 50 (2): 313–336. https://doi.org/10.1111/j.1475-4754.2008.00388.x.
- Ganor, S. 2017. “Horbat Ashdod-Yam.” Hadashot Arkheologiyot – Excavations and Surveys in Israel 129. https://www.hadashot-esi.org.il/report_detail_eng.aspx?id=25173&mag_id=125.
- Garrison, E. 2016. Techniques in Archaeological Geology. 2nd ed. New York: Springer.
- Goodman, D., Y. Nishimura, and J. D. Rogers. 1995. “GPR time slices in Archaeological Prospection.” Archaeological Prospection 2 (2): 85–89.
- Goodman, D., and S. Piro. 2013. GPR Remote Sensing in Archaeology (Geotechnologies and the Environment Vol. 9). New York: Springer.
- Grumel, Vencance. 1958. Traité d’Études Byzantines. I. La Chronologie. Paris: Presses Universitaires de France.
- Gvirtzman, G., M. Netser, and E. Katsav. 1998. “Last-Glacial to Holocene Kurkar Ridges, Hamra Soils, and Dune Fields in the Coastal Belt of Central Israel.” Israel Journal of Earth Sciences 47 (1): 27–46.
- Habas, L. 2023. “Symbols of Faith in the Mosaic Floors of the Newly Discovered Ecclesiastical Complex at Ashdod Maritima, Israel.” Journal of Mosaic Research (16): 251–267. https://doi.org/10.26658/jmr.1376813.
- Isaac, B. 2014. “Azotus.” In Corpus Inscriptionum Iudaeae/Palaestinae Volume III: South Coast 2161–2648, edited by W. Ameling, H. M. Cotton, W. Eck, B. Isaac, A. Kushnir-Stein, H. Misgav, J. Price, and A. Yardeni, 199–201. Berlin and Boston: Walter De Gruyter.
- Kaplan, J. 1969. “The Stronghold of Yamani at Ashdod-Yam.” Israel Exploration Journal 19: 137–149.
- Loke, M. H. 2011. “Electrical Resistivity Surveys and Data Interpretation.” In Encyclopedia of Solid Earth Geophysics, edited by H. K. Gupta, 276–282. Dordrecht: Springer.
- Mauz, B., M. P. Hijma, A. Amorosi, N. Porat, E. Galili, and J. Bloemendal. 2013. “Aeolian Beach Ridges and their Significance for Climate and Sea Level: Concept and Insight from the Levant Coast (East Mediterranean).” Earth-Science Reviews 121: 31–54. https://doi.org/10.1016/j.earscirev.2013.03.003.
- Meier, M. 2016. “The ‘Justinianic Plague’. The Economic Consequences of the Pandemic in the Eastern Roman Empire and Its Cultural and Religious Effects.” Early Medieval Europe 24 (3): 267–292. https://doi.org/10.1111/emed.12152.
- Meier, M. 2020. “The ‘Justinianic Plague’: An “Inconsequential Pandemic”? A Reply.” Medizinhistorisches Journal 55 (2): 172–199. https://doi.org/10.25162/mhj-2020-0006.
- Mordechai, L., M. Eisenberg, T. P. Newfield, and H. Poinar. 2019. “The Justinianic Plague: An inconsequential pandemic?.” Proceedings of the National Academy of Sciences 116 (51): 25546–25554. https://doi.org/10.1073/pnas.1903797116.
- Mosshammer, A. A. 2008. The Easter Computus and the Origins of the Christian Era. Oxford: Oxford University Press.
- Nachlieli, D. 2008. “Ashdod Yam.” In The New Encyclopedia of Archaeological Excavations in the Holy Land. V: Supplementary Volume, edited by E. Stern, 1575–1576. Jerusalem: CARTA.
- Pipano, S. 1990. “The History of Ashdod-Yam in the Byzantine Period.” In Ashdod Geography, History, Nature and Short Hikes Article Collection, edited by B. Raʻanan, 143–146. Ashdod: The Society for the Protection of Nature (in Hebrew).
- Raphael, K. 2014. Azdud (Ashdod-Yam): An Early Islamic Fortress on the Mediterranean Coast. Oxford: Archeopress.
- Samouëlian, A., I. Cousin, A. Tabbagh, A. Bruand, and G. Richard. 2005. “Electrical Resistivity Survey in Soil Science: A Review.” Soil & Tillage Research 83 (2): 173–193. https://doi.org/10.1016/j.still.2004.10.004.
- Sneh, A., and M. Rosensaft. 2004. “The Geological Map of Israel, 1:50,000. Sheet 10-I, Ashdod.” In Vectorial Format of the 1:50,000 geological map of Israel, edited by M. Rosensaft. Jerusalem: Isr. Geol. Surv.
- Tsafrir, Y., L. Di Segni, and Y. Grin. 1994. Tabula Imperii Romani. Iudaea, Palaestina. Eretz Israel in the Hellenistic, Roman and Byzantine period. Maps and Gazetteer. Jerusalem: Israel Academy of Sciences and Humanities.